OSS Data Analytics
Overview
The China Open Source Annual Report is based on in-depth and comprehensive data insights and is divided into eight major parts. The 1st part, General Overall Macro Insights, provides an overview of China's global open-source ecology through an in-depth analysis of essential events, active repositories, active users, open-source licensing, and programming languages. The 2nd part, OpenRank Rank List, is the list of open source projects, enterprises, foundations, developers, and collaborative robots in all areas of the world and China, and provides a comprehensive and systematic OpenRank indicator information service for industry. Part 3 and Part 4 contain Enterprise Insights and Foundation Insights, which illustrate the evolution of global and Chinese enterprises and foundations in the open source area through evolution maps and trend analyses. Part 5 Technology Sector Insights provides an in-depth study on the evolution of the Top 10 lists and projects in each area, showing the direction and trends in forward technology. Part 6 Open Source Project Insights provides insights into the diversity and innovative directions of different project types, areas, and topics. Part 7 Open Source Developer Insights An analysis of developer types, hours of work, geographical distribution, and robotic use shows the diversity and characteristics of the developer community. Part 8, Case Studies, provides a series of interesting case analyses that allow readers to glimpse China's exponential ecological boom. Overall, the data page offers a panorama of China's open-source ecology in 2023 through rich data insights and analyses.
Introduction to indicators
OpenRank
The OpenRank indicator is a collaborative network indicator developed by the X-lab Open Laboratory and based on an open source developer-project collaborative relationships network, which not only characterizes the overall development of projects community participation but also introduces elements of open source ecology, which can be well identified and displayed by such entities as projects, people, organizations, etc. in open source ecology. OpenRank is now widely accepted by industry and academia, including the China Institute for Standardization (ISI) series of Open Source Governance Standards, the ICT White Paper on Open Source Governance, the Open Atomic Open Source Foundation Global Open Source Screen, and the Business Open Source Office Governance Toolkit.
For a definition of this indicator, refer to:
[1] [Shengyu Zhao et al.: OpenRank Leaderboard: Motivating Open Source Collections Through Social Network Evaluation in Alibaba. ICSE, 2024] (https://www.researchgate.net/publication/3766686121_OpenRank_Leaderboard_Motivating_Open_Source_Collections_Through_Social_Network_Evaluation_in_Alibaba)
[2] [Zhao Honghou: How to evaluate an open source project (iii) value stream, 2021] (https://blog.frankzhao.cn/how_to_measure_open_source_3)
[3] Institute for Standardization of the Ministry of Industry and Information: Information Technology Open Source Governance Part 3:Community Governance and Operationalisation [T/CESA 1270.3-2023]; Information Technology Open Source Governance Part 5:Evaluation Model for Open Source Contributors" [T/CESA 1270.5-2023], 2023
Activity
Activity is a statistical indicator of the level of activity of the X-lab researcher or developer. Developer activity is weighted by the behavior of developers, such as Issue, PR, and Code Review. The project's activity is processed by the sum of the total activity of all developers in the project.
For a definition of this indicator, refer to:
[2] Frank Zhao:How to evaluate an open source project (i) - activity,2021
1. Overall Macro Insight
1.1 Basic Events
Basic events are the database for this data page analysis and refer to a series of event log data generated by developer activity on GitHub, Gitee, and others on the global open-source collaborative platform. A statistical analysis of underlying events provides a macro insight into the dynamics of global ecological development. This annual open-source report covers the collaborative platforms GitHub, Gitee, and GitLink.
1.1.1 Trends in events across GitHub
First, the total number of events logs for statistical analysis across GitHub is shown in the graph below.

The overall activity of global open sources and the number of active warehouses have increased significantly in recent years, reflecting the growth rate in global open-source development.2023 GitHub log data reached 1.4 billion compared to 2022 when it increased by about 10.32 percent. After high growth in 2018-2020, the GitHub platform's annual event growth gradually declined, with a growth rate of about 10% in 2023. However, the 10 percent growth rate, because of its overall volume, continues to highlight open-source technology's dynamic and critical role in the global digital transition.
1.1.2 Comparison of overall events trends in GitHub and Gitee
Because of the size of the events active on the GitHub platform, the subsequent analysis was built on the benchmark of the top 30,000 active warehouses per platform. For ease of comparison, we have selected GitHub for statistical analysis of 8 categories of events of greater relevance to open source participation in Gitee, including CommunityCommentEvent, ForkEvent, IssueCommentEvent, IssuesEvent, FullRequestEvent, FullRequestReviewCommentEvent, PushEvent, and WatchEvent.

The Gitee platform showed a more pronounced growth trend. Even since 2021, the number of incidents in the top 30,000 active warehouses has surpassed GitHub, highlighting the outbreak of active open-source projects in the country. Domestic developers' active participation and contribution to open-source communities have injected new dynamism into technological innovation and knowledge sharing.
However, it must be emphasized that data on the first 30,000 active projects alone does not fully reveal the reality of the global GitHub platform, as the long-end effects are still evident globally. Subsequent analyses will reflect this more clearly, especially in the broad and diverse nature of the GitHub platform as the world's leading open-source community. In the future, with the evolution of technology and the promotion of an open-source culture, the Chinese open-source community can be expected to continue to flourish globally.
Further to the analysis of disaggregated data on underlying events, the results are shown in the figure below.

Can be seen from the analytics results:
The most frequent event type on the GitHub platform is the Push event, while Pull Request events and Issue Comment events rank 2nd and 3rd, respectively. The occurrence rates of each event type have remained relatively stable, reflecting a trend towards a stable ecosystem in GitHub's open-source community. On the Gitee platform, event data grew significantly in 2020, initially focusing on Watch events. But after 2020, Pull Request and Review Events grew rapidly, becoming the largest event type in 2022 and growing steadily in 2023. The structural changes in Gitee event data reflect a significant shift in the role of domestic developers from a watchdog to a contributor, which is consistent with observations worldwide.
1.1.3 GitLink Events Analysis
For the GitLink platform, we have also selected the top 30,000 active repositories as benchmarks. Given the limitations of the data, only data covering the six types of events—CommunityCommentEvent, ForkEvent, IssueCommentEvent, IssuesEvent, FullRequestEvent, and WatchEvent—were selected for analysis.
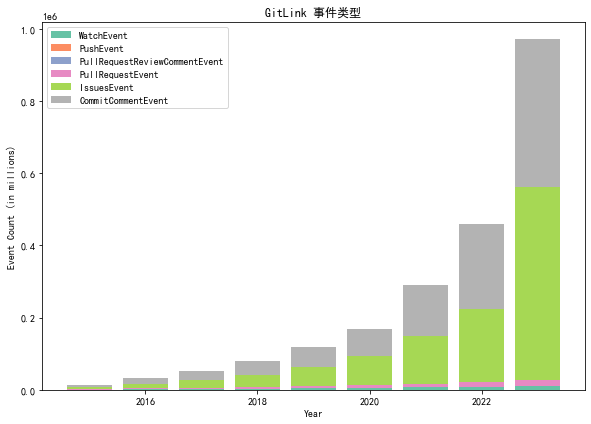
While the number of active repository events on GitLink still lags behind platforms like GitHub and Gitee, it exhibits a notable upward trend. On the GitLink platform, Issues events and CommitComment events constitute the vast majority of active repository events.
1.2 Active Repository
1.2.1 Trends in GitHub total number of active warehouses
The following figure shows the statistical analysis of the overall activity trends of GitHub and Gitee active repositories.

According to overall data for 2023, the total number of active repositories worldwide reached 87.92 million, marking a 4.06% increase from the previous year; this aligns with the overall trend in events, which has been declining annually since experiencing high growth from 2018 to 2020. This decline could stem from the COVID-19 pandemic and global economic developments.
Because of the gap in the number of GitHub and Gitee warehouses, the following analytical work is also based on 30,000 active repositories in front of each platform.
1.2.2 Comparison of the overall activity of GitHub and Gitee
The graph below shows the statistical analysis of GitHub and Gitee's overall activity in the repositories.

Looking at the activity data of the top 30,000 active repositories from each platform, the overall activity on the Gitee platform grew rapidly from 2019 onwards. By 2022, it surpassed GitHub and maintained this high-growth trend, revealing the enormous vitality of open-source development in China during this period.

Furthermore, the detailed analysis of the composition of the activity reveals the following:
On the GitHub platform, the activity stemming from "Create PR" events comprises nearly half of the total activity, while "Merge PR" events contribute to approximately one-fourth. Reviewing PRs contributes around 10% of the activity, while the combined activity from issue creation and comments nearly matches, accounting for 7%.
On the Gitee platform, the highest activity contribution comes from reviewing PRs, constituting two-thirds of the total activity. Similarly to GitHub, "Merge PR" events follow closely behind in activity contribution, with a proportion comparable to that on the GitHub platform. A surprising finding is that while "Create PR" events contribute the highest proportion of activity on GitHub, they contribute the least on the Gitee platform, accounting for only 2% of the total activity events.
1.2.3 GitHub and Gitee overall active repository OpenRank trends vs.
The graph below shows the statistical analysis of GitHub and Gitee's active repository, OpenRank trends.

Although the activity of the top 30,000 repositories on Gitee briefly surpassed that of GitHub in 2022, the influence gap measured by OpenRank remains significant (approximately 5:2). Not only is the gap considerable but there also seems to be no indication of it narrowing in terms of trends. This is particularly noteworthy and underscores a key area of focus for future open-source development in China.
1.3 Active users
1.3.1 Trends in the total number of active users on GitHub
The following figure presents a statistical analysis of the overall active user count on GitHub.

In 2023, the total number of active developers in the field reached 21.93 million, an increase of 8.88 percent over the previous year. Like the GitHub active warehouse, after nearly five years of high growth, the growth rate began to decline in 2020. The growth of active users on the GitHub platform began to slow (although the GitHub official announced at the beginning of 2023 that the overall number of users of its platform surpassed 100 million), there was also some correlation with changes in the global situation and the rise of a platform like Gitee.
1.3.2 Active user geographical distribution and ranking
The annual report can include detailed geo-location data analysis for GitHub developers as a contribution to the award-winning game of the OpenDigger Open Source Software Ecological Data Analysis Dredging Platform (OpenSODA).
The following analysis is based on approximately 2 million developers who have correctly filled in their geographical location information out of the 10 million active developers on GitHub in 2023. Considering the total registered users on GitHub to be 100 million, the sampling ratio is approximately 2%.
1. Geographical distribution of global developers
First, analyze developers' geographical distribution worldwide, as shown in the following chart.

| Ranking | States | Total Number | Percentage | Annual Activity | Active rate |
|---|---|---|---|---|---|
| 1 | United States | 408983 | 21.09% | 236899 | 57.92% |
| 2 | India | 177669 | 9.16% | 107066 | 60.26% |
| 3 | China | 171039 | 8.82% | 126238 | 73.81% |
| 4 | Brazil | 114855 | 5.92% | 83932 | 73.08% |
| 5 | Germany | 88767 | 4.58% | 64836 | 73.04% |
| 6 | United Kingdom | 83245 | 4.29% | 55175 | 66.28% |
| 7 | Canada | 65241 | 3.36% | 42238 | 64.74% |
| 8 | France | 57480 | 2.96% | 40341 | 70.18% |
| 9 | Russia | 47213 | 2.43% | 31534 | 66.79% |
| 10 | Australia | 31638 | 1.63% | 20512 | 64.83% |
| 11 | Poland | 31469 | 1.62% | 21792 | 69.25% |
| 12 | Japan | 30873 | 1.59% | 21942 | 71.07% |
| 13 | Netherlands | 30617 | 1.58% | 21685 | 70.83% |
| 14 | Spain | 28928 | 1.49% | 19509 | 67.44% |
| 15 | South Korea | 28325 | 1.46% | 21811 | 77.00% |
Overall, developers from various countries are continuously increasing:
- The United States ranks first due to its early involvement in the open-source domain and its advantage in technology talent.
- Based on the calculated total number of developers from the United States in the table (409,000), the actual number of developers from the United States on GitHub is estimated to be around 21.01 million, with a deviation of approximately 4% from the official data released by GitHub (22 million).
- India, China, and Brazil, with their large population bases, rank second, third, and fourth in terms of the number of developers. However, based on the activity rate (annual active users/total users), China has the highest rate among the top four.
- Developers from European countries also constitute a significant force in the open-source community, collectively ranking second in volume.
- According to the official data released by GitHub and Gitee (both around 12 million), the total number of global open-source developers from China is likely to exceed 20 million, roughly equivalent to the number from the United States in quantity alone.
2. Geographical distribution of Chinese developers
Further analysis shows the geographical distribution of Chinese developers, as shown in the graph below.Of these, the data sources are almost 150,000 developers of “China” users who correctly fill out provincial information.

According to data from GitHub 2023 Q3 quarter, the total number of Chinese developers is approximately 18.8 million, which can be estimated on the basis of proportion to the total actual developers in each province.
| Ranking | Provinces | Total Number | National percentage | Actual Total |
|---|---|---|---|---|
| 1 | Beijing | 32982 | 22.04% | 262.25 million |
| 2 | Sengah | 24581 | 16.43% | 1955.45 million |
| 3 | Guangdong | 21684 | 14.49% | 172.41 000 |
| 4 | Zhejiang | 14256 | 9.53% | 113.35 million |
| 5 | Taiwan | 12173 | 8.13% | 96.79 million |
| 6 | Jiangsu | 7335 | 4.90% | 58.32 million |
| 7 | Chechen | 7012 | 4.69% | 55.75 million |
| 8 | Hong Kong | 4678 | 3.13% | 37.19 million |
| 9 | Hubei | 4415 | 2.95% | 35.1 million |
| 10 | Shaanxi | 2815 | 1.88% | 22.38 000 |
| 11 | Fujian | 2405 | 1.61% | 19.12 million |
| 12 | Shandong | 2035 | 1.36% | 16.18 million |
| 13 | Hunan | 1858 | 1.24% | 14.77 000 |
| 14 | Chongqing | 1833 | 1.22% | 1457 000 |
| 15 | Annah | 1487 | 0.99% | 11.82 million |
Ranking and data in the above table reveal the relevance of Chinese open-source developers and regional economic development levels:
- The number of open source developers in the North, Upper and Zhej's four major cities has surpassed one million classes, particularly in Beijing;
- The fifth and eighth places respectively of Taiwan and Hong Kong, highlighting the importance of Hong Kong and the Taiwan Strait;
- The open source developer in the Long Triangle (Jijjiang Zhejushu) region has reached almost 38.8 million;
- The central western regions, such as Sichuan, Hubei and Shaanxi, have also shown good performance, particularly in Sichuan, which has attracted a large number of developers through their suitable, fast-growing software industries.
1.4 Open source licenses
1.4.1 Number of warehouses using open-source licenses
The graph below shows the number of open-source licenses that GitHub's active repository uses.
The analysis revealed that the most used open-source licenses are currently available, including MIT licenses, Apache licenses v2.0, GNU General Public Licence v3.0, and BSD 3-Clause licenses. Of these, MIT licenses rank first to reach 60%. The MIT license is named after the Massachusetts Institute of Technology. The simplicity and flexibility of MIT licenses have made it one of the licenses chosen by many developers and have provided the least legal restrictions to encourage developers to use and disseminate software freely.
1.4.2 Trends in Open-Source Licensing Types
Statistical analysis has been conducted on the trends of open-source license types, as shown in the following figures.

Overall, the number of open-source license types has continuously increased since 2017. Introducing licenses such as the Eclipse Public License 2.0, the European Union Public License 1.2, and others contributed to the growth observed between 2017 and 2018. Subsequently, the growth rate of open-source license types slowed down. Between 2021 and 2022, a new batch of open-source licenses, such as the Mulan Series Licenses and the CERN License v2, began to emerge. Following this, the development trend stabilized, and currently, the mainstream license types on GitHub have remained steady at 46 types for two years.
1.4.3 Trends in the Number of Repositories Using Open Source Licenses
According to Github's log data, in 2023, nearly 7.7 million active repositories used various open-source licenses, accounting for 8.76% of all active repositories. We present the MIT License's data separately due to its significant influence.
1. Trends in the Number of Repositories Using the MIT License
Statistical analysis of the trends in the number of repositories using the MIT License is shown in the following figure.

Observations:
- The MIT License is currently the most popular open-source license, with 1.58 million active repositories in 2023.
- The trends in the number of repositories using the MIT License are similar to those of the total repository count, with significant growth observed. However, the growth rate slowed down in 2022 and 2023, which correlates with the overall slowdown in project growth.
2. Trends in the Number of Repositories Using Other Top Five Open Source Licenses
The following figure shows a statistical analysis of the trends in the number of repositories using other top-five open-source licenses.

Observations:
- The number of open-source licenses is growing, with MIT, Apache, and GNU licenses remaining the top choices.
- Differences between niche and popular open-source licenses still exist.
- Since 2022, the usage of GNU General Public License (GPL) versions 2 and 3 has been declining overall, while GNU Affero General Public License version 3 has been increasing yearly.
1.4.3 Trends in the Number of Repositories Using the Mulan Series Licenses
The following figure shows a statistical analysis of the trends in the number of repositories using the Mulan Series Licenses.

The Mulan Series Licenses (including the Mulan Permissive Software License and the Mulan Public License, among others) are drafted, revised, and released by Peking University, with the support of the National Standardization Technical Committee on Cloud Computing and the China Open Source Cloud Alliance. As the first open-source software agreement recognized by the Open Source Initiative (OSI) in China, the Mulan Permissive Software License (Mulan PSL) holds significant influence.
Observations indicate a growth in repositories utilizing the Mulan licenses starting September 2022. By December 2023, there were 220 such active repositories, showcasing the increasing influence of Mulan open-source licenses.
1.5 Programming Languages
1.5.1 Top Programming Languages Used by Developers in 2023
The popularity of programming languages is of great interest to developers. The analysis below presents the most popular programming languages among developers in 2023, as shown in the following table.
| Rank | Programming Language | Number of Developers Using | Number of Repositories Using |
|---|---|---|---|
| 1 | JavaScript | 765,589 | 1,806,477 |
| 2 | Python | 629,423 | 653,025 |
| 3 | HTML | 564,121 | 676,364 |
| 4 | TypeScript | 462,729 | 886,453 |
| 5 | Java | 368,795 | 463,660 |
| 6 | CSS | 190,480 | 239,187 |
| 7 | C++ | 177,905 | 135,330 |
| 8 | C# | 158,159 | 180,537 |
| 9 | Go | 143,433 | 165,367 |
| 10 | PHP | 128,186 | 272,980 |
| 11 | Jupyter Notebook | 122,475 | 102,708 |
| 12 | Shell | 122,456 | 108,209 |
| 13 | C | 107,918 | 80,159 |
| 14 | Rust | 69,370 | 72,778 |
| 15 | Ruby | 66,857 | 374,835 |
| 16 | Kotlin | 64,307 | 62,709 |
| 17 | Vue | 56,099 | 170,639 |
| 18 | SCSS | 50,526 | 44,672 |
| 19 | Dart | 46,143 | 43,006 |
| 20 | Swift | 33,839 | 35,978 |
From the table above:
- The top five programming languages most used by developers are JavaScript, Python, HTML, TypeScript, and Java, which represent the leading programming languages developers use. Starting from the sixth-ranked CSS, the number of users decreased by nearly half compared to Java, the fifth-ranked language.
1.5.2 Trends in Programming Language Usage from 2019 to 2023
Statistical analysis of developers' programming language usage trends from 2019 to 2023 is depicted in the following figure.

Observations from the figure:
- JavaScript, Python, HTML, TypeScript, and Java are the leading programming languages developers use.
- Python and TypeScript have shown rapid growth compared to the other three primary languages and have maintained a consistently rapid growth trend over the past five years.
- TypeScript, in particular, has experienced rapid growth in the number of users over the past five years. In 2021, it significantly surpassed other programming languages, becoming one of the main programming languages developers use. Perhaps by 2024, the number of developers using it will be comparable to the number of developers using HTML, which is ranked third.
2. OpenRank Rankings
Rankings are a popular form of presenting analysis results.
The 2023 China Open Source Annual Report separates the rankings into a dedicated section for centralized display. This is partly to showcase better the development trends of various entities (repositories/projects, countries/regions, enterprises, foundations, developers, etc.) in the open source ecosystem, and another important reason is the maturation of the OpenRank indicators and the completeness of global data.
With the addition of global data from both GitHub and Gitee this year, we are able to take a global perspective with China's open source as the starting point, allowing the world to see the joint efforts and contributions of Chinese enterprises, foundations, developers, and other entities in developing the global open-source ecosystem, which is not available in other reports on the market.
2.1 Global Open Source Repository OpenRank Rankings

2.2 China Open Source Project OpenRank Rankings

Chinese open-source projects are based on data from the OpenDigger project tags, and a single project may include multiple organizations or repositories on GitHub or Gitee platforms.
2.3 Global Enterprise OpenRank Rankings

Enterprise rankings are based on data from OpenDigger project tags, meaning the sum of all open source projects initiated by a certain enterprise's OpenRank, including projects donated to foundations.
2.4 China Enterprise OpenRank Rankings

2.5 Global Foundation OpenRank Rankings

2.6 Country and Region OpenRank Rankings

Country and region data is based on location information filled in by GitHub developers, with a sample size of the top 10 million OpenRank users globally.
2.7 Global Developer OpenRank Rankings

2.8 China Developer OpenRank Rankings

Chinese developer accounts are based on OpenDigger tag data.
3. Enterprise Insights
Enterprises are the core force driving the development of the global open-source ecosystem. They are initiators, as well as developers and maintainers, at the forefront of the development and commercial exploration of open-source projects.
3.1 Evolution of Global Enterprise OpenRank Over the Past 10 Years


Observations on the global impact of enterprise open source are as follows:
- Microsoft began laying out open source over a decade ago (in 2008) and reached the pinnacle of global open source influence in 2016, a position it has held unchallenged to this day.
- Since being officially sanctioned by the United States in 2019, Huawei has made open source a strategic priority. It has been soaring ever since and surpassed Google and Amazon this year.
- Alibaba has been a leader in domestic open source until 2021 and has maintained its sixth position globally.
- Ant Group's performance in the past three years has been remarkable, and it officially entered the top ten in the world in 2023.
- Baidu, the fourth largest player in domestic open source, has fallen to 12th globally due to rapid changes in the domestic open source landscape.
- According to the OpenLeaderboard, Chinese enterprises entering the top 30 globally also include ByteDance (18), PingCAP (19), Feizhiyun (24), Deepin (25), Tencent (26), and Espressif (27).
3.2 Evolution of China Enterprise OpenRank Over the Past 10 Years

This chart effectively demonstrates the open-source strategies of domestic companies and their changing trends:
Huawei began to make efforts in 2019 and, in just two years, achieved first place in China and second place globally. As traditional domestic leaders in open source, Alibaba and Ant have shown stable performance.
- Baidu has slipped to fourth place due to competition from the first three.
- ByteDance has made visible and rapid progress in recent years.
- Espressif (Espressif Systems) is a relatively low-profile semiconductor open-source leader in China.
- Fit2Cloud is another low-key but pragmatic open-source enterprise, with several open-source software under its belt being highly favored by developers.
- Tencent, PingCAP, JD, and TAOS have shown a slight downward trend in the past two years, indicating that competition in the post-pandemic era will intensify.
3.3 Proportion of China Enterprises' OpenRank on GitHub/Gitee Platforms


The left chart shows the trend of increasing influence of Chinese enterprises in the global open source ecosystem, while the right chart reflects the trend of ups and downs between China and the United States in the post-trade war era, especially after the pandemic. The influence of Chinese open source has risen significantly, as has the influence of companies like Huawei. However, it can also be seen that the gap between Chinese and American enterprises in overall open source influence is still significant (about 3 times the difference). Still, this momentum is very promising for the future.
4. Foundations Insights
This section examines the development of open-source ecology from a foundation perspective. Foundations are non-profit organizations that play a crucial role in organizing, developing, and innovating open-source projects and communities. They provide comprehensive support in technology, operations, and law to incubate open-source software and guide the building and operation of open-source communities. Foundations act as incubators and accelerators and are essential organizers of the open-source ecosystem. This year, we have included a separate section on insights from open-source foundations, where we can see the global impact of China's open-source foundations.
4.1 Global Foundation OpenRank trend analysis

The following trends can be seen in:
- The Apache Foundation's #1 ranking has evolved at a mature and steady pace, and today it remains the first choice for many companies to develop globalization projects;
- OpenAtom Open Source Foundation was founded more than three years ago, the rapid development of its projects, and the total impact of its projects beyond the Linux Foundation's sub-foundations, ranked second only after the Apache Foundation;
- LF AI & Data ranked third, outpacing CNCF in cloud-native due to advancements in AI.;
- The development of the other (sub)foundations has generally been relatively stable..
4.2 Global Foundation project OpenRank trend analysis

In terms of open source projects under the Global Foundation:
- Kubernetes continues to rank first, but influence declines every year, giving way to projects in emerging areas;
- Doris, an open source real-time data warehouse initiated by Baidu under the Apache Foundation, has grown rapidly in recent years and ranks second;
- OpenHarmony, a project of OpenAtom Open Source Foundation, and its various sub-repositories are a close second. If combined, they would rank #1.
4.3 Analysis of Trends in OpenRank Projects under Foundation in China

Chinese projects under various foundations are examined separately:
- Doris and OpenHarmony are developing most noticeably;
- The Milvus Vector Database has experienced rapid growth due to demand in the AIGC domain;
- Projects like Flink and ShardingSphere are relatively stable.
4.4 Analysis of Trends in OpenRank Projects under the Open Atom Foundation

This year marks the first time we can observe the development of projects under the Open Atom Flag:
- The top three are OpenHarmony, openEuler, and Anolis, representing the absolute status of the operating system, especially OpenHarmony, which is developing the fastest;
- Other listed projects are developing steadily, and we look forward to their progress in the new year.
5. Technological insights
The technology field is rapidly evolving, especially in various subfields. Operating systems are being developed in new architectures, cloud native are driving digital transformation, databases are becoming the infrastructure for data innovation, big data is facilitating intelligent decision-making, artificial intelligence is accelerating automation in various industries, and front-end technologies are focusing on interaction and aesthetics. These areas are at the forefront of technology, attracting innovators and investors and creating a booming trend. In this section, we will provide insights into these six areas in terms of two metrics: influence and activity.
5.1 Overall development trend of six major technology areas in the past five years


Cloud-native computing and artificial intelligence (AI) have gained popularity in the past five years, reflected in their increased number of repositories. Databases remain critical, while the influence of front-end development is shrinking. Operating systems have a smaller number of repositories but hold great value.
5.2 5-Year Trends in OpenRank and Activity for the Top 10 Projects in Each Technology Area
5.2.1 Cloud Native


Both indicators of Kubernetes have significantly decreased, while Grafana has emerged as the top influencer. The llvm-project has shown remarkable growth and has become the most active project in the past three years. LLVM is a compiler framework that comprises a collection of modular and reusable compiler as well as toolchain technologies. Its rapid growth in popularity among developers is a testament to its effectiveness.
5.2.2 Artificial intelligence


TensorFlow has been declining and is out of the top 5, while Pytorch is growing and widening the gap. LangChain, an open-source software project by Harrison Chase, is in second place in both indicators since it launched in October 2022 and is now one of the most popular frameworks for LLM development.
5.2.3 Big Data


Kibana and Grafana are the top two big data solutions, with a consistent upward trend. Grafana is predicted to surpass Kibana and become the top-ranked solution in the future.
Kibana is an open-source tool for data visualization and exploration, tightly integrated with ElasticSearch.
Grafana is an open-source tool for monitoring and reporting. It can visualize data from various sources, including Prometheus, InfluxDB, and Graphite, among others. Grafana's data processing and visualization features enable the creation of different charts and dashboards.
5.2.4 Database

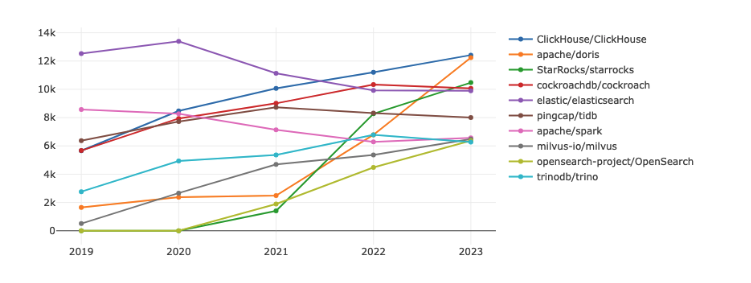
Doris is the fastest-growing database, with activity metrics nearing the top spot, while ElasticSearch is dropping back in popularity. It is predicted that Doris will surpass ClickHouse in the future.
ClickHouse is an open source MPP architecture designed by Yandex. It analyzes large amounts of data and is claimed to be 100-1000x faster than traditional databases. Key feature: high-performance vectorized execution engine. Also known for rich functionality and reliability.
Apache Doris is contributed by Baidu open source MPP analytical database products , distributed architecture is simple , easy to operate and maintain .
5.2.5 Frontend
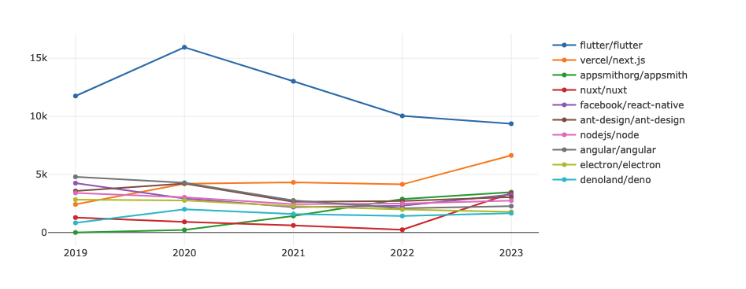
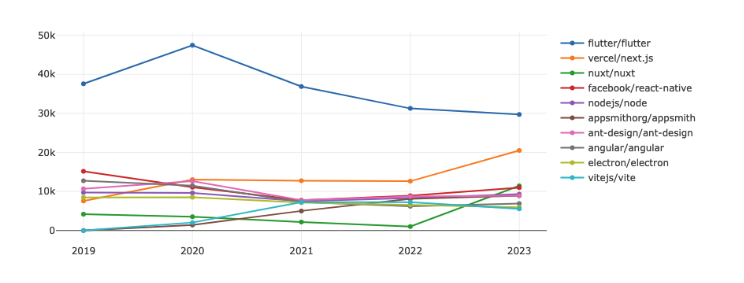
While declining in both indicators year over year, Flutter still has a clear advantage over Next.js, which started to gain momentum in 2023 and is rising significantly. The 3-10 ranked programs are highly competitive, with little gap between them.
Flutter is a framework developed and supported by Google. Front-end and full-stack developers use Flutter to build the user interface of applications for multiple platforms with a single code base.
Next.js is an open source platform created by Vercel, built with Node.js and Babel translators and designed for use with React Single Page Application Framework. In addition, Next.js provides many useful features, such as preview mode, rapid developer compilation and static export.
5.2.6 Operating system
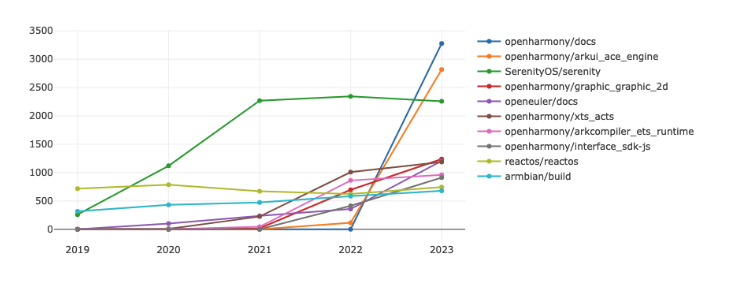
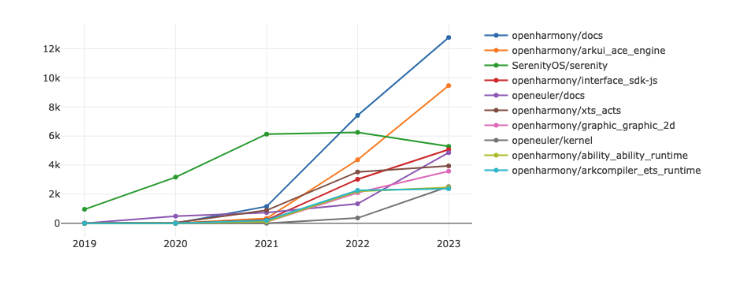
As you can see, several repositories under the OpenHarmony project are in the top 10 list. This insight combines data from the Gitee platform so you can more intuitively see the advantages of domestic operating systems in various aspects (there are several repositories under the OpenHarmony project, and this insight analyzes them in terms of repositories). SerenityOS has fallen back a bit since 2021 and is second only to OpenHarmony and OpenEuler, which also have good performance.
5.3 OpenRank Top 10 list for each field in 2023
Below are the OpenRank rankings for projects in each field for 2023.
5.3.1 Cloud Native
Table 5.1 Top Projects in Cloud Native
| Number | Project Name | OpenRank |
|---|---|---|
| 1 | grafana/grafana | 7134.37 |
| 2 | lvm/llvm-project | 7049.62 |
| 3 | kubernetes/kubernetes | 5374.14 |
| 4 | ClickHouse/ClickHouse | 4941.99 |
| 5 | cilium/cilum | 3215.42 |
| 6 | ceph/ceeph | 3172.49 |
| 7 | keycloak/keycloak | 3095.56 |
| 8 | gravitational/teleport | 3082.18 |
| 9 | envoyproxy/envoy | 2929.08 |
| 10 | backstopage/package | 2903.39 |
5.3.2 Artificial Intelligence
Table 5.2 Top Projects in Artificial Intelligence
| Number | Project Name | OpenRank |
|---|---|---|
| 1 | pytorch/pytorch | 10182.45 |
| 2 | langchain-ai/langchain | 6080.25 |
| 3 | Paddle/Paddle | 5408.62 |
| 4 | huggingface/transformers | 4422.84 |
| 5 | AUTOMATIC1111/stable-diffusion-webui | 3881.6 |
| 6 | openvinoolkit/openvinvinino | 3857.31 |
| 7 | microsoft/onnxruntime | 3006.75 |
| 8 | tensorflow/tensor | 2723.26 |
| 9 | Significant-Gravitas/AutoGPT | 2664.85 |
| 10 | ggerganov/llama.cpp | 2339.8 |
5.3.3 Big Data
Table 5.3 Top Projects in Big Data
| Number | Project Name | OpenRank |
|---|---|---|
| 1 | elastic/kibana | 7601.04 |
| 2 | grafana/grafana | 7134.37 |
| 3 | ClickHouse/ClickHouse | 4941.99 |
| 4 | airbytehq/airbyte | 4658.86 |
| 5 | apache/doris | 4307.26 |
| 6 | elastic/elasticsearch | 3729.39 |
| 7 | apache/airflow | 3642.9 |
| 8 | StarRocks/starrocks | 3194.56 |
| 9 | trinodb/trino | 2703.4 |
| 10 | apache/spark | 2654.02 |
5.3.4 Database
Table 5.4 Top Projects in Database
| Number | Project Name | OpenRank |
|---|---|---|
| 1 | ClickHouse/ClickHouse | 4941.99 |
| 2 | apache/doris | 4307.26 |
| 3 | elastic/elasticsearch | 3729.39 |
| 4 | cockroachdb/cockroach | 3443.7 |
| 5 | StarRocks/starrocks | 3194.56 |
| 6 | trinodb/trino | 2703.4 |
| 7 | apache/spark | 2654.02 |
| 8 | pingcap/tidb | 2200.38 |
| 9 | milvus-io/milus | 2001.11 |
| 10 | yugabyte/yugabyte-db | 1940.75 |
5.3.5 Frontend
Table 5.5 Top Projects in Frontend
| Number | Project Name | OpenRank |
|---|---|---|
| 1 | flutter/futter | 9361.81 |
| 2 | vercel/next.js | 6638.65 |
| 3 | appsmithorg/appsmith | 3474.07 |
| 4 | nuxt/nuxt | 3387.23 |
| 5 | facebook/react-native | 3260.55 |
| 6 | Ant-design/ant-design | 3053.25 |
| 7 | nodejs/node | 2736.37 |
| 8 | angular/angular | 2273.82 |
| 9 | Electron/electron | 1773.31 |
| 10 | denoland/denoo | 1654.01 |
5.3.6 Operating system
Table 5.6 Top Projects in Operating System
| Number | Project Name | OpenRank |
|---|---|---|
| 1 | openharmony/docs | 3277.69 |
| 2 | openharmony/arkui_ace_engagement | 2818.09 |
| 3 | SerenityOS/serenity | 2257.68 |
| 4 | openharmony/graphic_graphic_2d | 1239.6 |
| 5 | openeuer/docs | 1206.9 |
| 6 | openharmony/xts_acts | 1186.06 |
| 7 | openharmony/arkcompiler_ets_runtime | 961.99 |
| 8 | openharmony/interface_sdk-js | 910.91 |
| 9 | reactos/reactos | 745.23 |
| 10 | armbian/build | 679.1 |
6. Insights on open source projects
In 2023, large AI models like GPT-4 and CLIP emerged, leading to competition among global enterprises to invest in research and development for cutting-edge technologies like language understanding and image generation. The industry saw rapid evolution, marking the beginning of a new era in the broad application of AI. The database field experienced a trend of innovation with various technologies like distributed databases, time-series databases, and graph databases emerging to cater to different application scenarios. Cloud-native databases became popular, offering flexible scaling and high availability. This section provides data insights on project types by statistically analyzing project topics. In-depth insights are also provided into the two core areas of database and AI.
6.1 Type of project
This subsection selects the top 10,000 active GitHub repositories for statistical analysis.
6.1.1 Ratios for different project types

- Software development primarily comprises components and frameworks (libraries and frameworks), which constitute 31.36% of it. Developers enjoy using these open-source collaborative innovations, which are the most popular types to contribute to;
- The Application Software category is second only to the Component Framework category (24.34%) due to its utility, enabling all users (not just developers) to utilize open source software in a variety of industries and domains;
- Non-Software content holds a significant share of 23.17%. It shows the growing trend of open-source as a collaborative development model that extends to the entire content domain, including documentation, education, art, hardware, and other non-programming-related areas;
- Developers find the Software Tools category valuable as it allows them to focus on building software applications and products, making up 18.9% of their work;
- The System Software category comprises fundamental software, accounting for only 2.3% of the total despite its immense value and complexity.
6.1.2 Percentage of OpenRank by Project Type

Let's take this a step further and look at these categories through the lens of OpenRank influence:
- The most significant change is that content resource type (Non-Software) projects have relatively low impact, although they have high activity;
- System Software, on the other hand, has a small percentage of activity but a relatively large percentage of influence, and a similar phenomenon can be observed with Software Tools projects;
- The component framework type and the application software type have not changed much, and both are among the more prevalent types.
6.1.3 OpenRank Trends by Project Type in the Last 5 Years

As you can see from the five-year OpenRank evolution chart above, the influence of the System Software category is increasing year by year, while the influence of the Non Software category is decreasing.
6.2 Project Topic Analysis
This section also analyzes the top 10,000 active GitHub repositories and obtains insights from the Topic tags under the repositories.
6.2.1 Top Topic

Figure 6.4 Top 10 appearances of Topic
The top 10 topics cover a diverse range of areas, demonstrating the broad interest of the open-source community. JavaScript, Hacktoberfest, and Python are some of the most popular topics, representing hotspots for cutting-edge technologies, active community activities, and versatile programming languages. These topics highlight the interest in front-end development, open-source contributions, and interdisciplinary programming.
6.2.2 Overall OpenRank Trends for Repositories of Popular Topics
Figure 6.5 OpenRank trends for repositories with top 10 Topic occurrences (2019 - 2023)
- Hacktoberfest is an annual event that takes place in October. It aims to promote the open-source community and is organized by DigitalOcean in collaboration with GitHub. The goal of the event is to encourage more people to participate in open-source projects and contribute to the community. OpenRank is used to measure people's enthusiasm for open-source projects, community involvement, and contributions. Developers play an active role in the campaign by submitting Pull Requests to open-source projects, thus helping to increase the reputation and influence of the repository.
- JavaScript and Python:technologies have maintained relatively stable trends over the past few years, with no significant growth or decline.
6.3 Project analysis in databases
This section uses information from open-source databases, which are disclosed in the Database of Databases and DB-Engines Ranking. The field is divided into 18 subcategories based on the storage structure and usage of databases. These subcategories include Relational, Key-value, Document, Search Engine, Wide Column, Time Series, Graph, Vector, Object Oriented, Hierarchical, RDF, Array, Event, Spatial, Native XML, Multivalue, Content, and Network. We then collect and analyze corresponding database information on GitHub. We examine the corresponding open-source projects for each database and gather and analyze their collaboration log data on GitHub. This helps us gain detailed insights into the field.
6.3.1 2023 OpenRank and Activity Lists by Subdomain in the Database Domain
1, OpenRank Rankings for Database Subdomains
Table 6.1 OpenRank Rankings for Database Subdomains
| Ranking | Subfield Name | OpenRank |
|---|---|---|
| 1 | Relational | 58092.36 |
| 2 | Key-value | 21834.08 |
| 3 | Document | 17264.93 |
| 4 | Search Engine | 8093.77 |
| 5 | Wide Column | 7896.43 |
| 6 | Time Series | 7813.54 |
| 7 | Graph | 5196.52 |
| 8 | Vector | 4965.41 |
| 9 | Object Oriented | 3104.07 |
| 10 | Hierarchical | 1355.4 |
| 11 | RDF | 592.68 |
| 12 | Array | 383.95 |
| 13 | Event | 256.59 |
| 14 | Spatial | 224.05 |
| 15 | Native XML | 209.51 |
| 16 | Multivalue | 15.89 |
| 17 | Content | 3.43 |
2, Activity Rankings for Database Subdomains
Table 6.2 Activity Rankings for Database Subdomains
| Ranking | Subfield Name | Activity |
|---|---|---|
| 1 | Relational | 161025.44 |
| 2 | Key-value | 62501.64 |
| 3 | Document | 49400.11 |
| 4 | Search Engine | 23799.87 |
| 5 | Time Series | 22077.57 |
| 6 | Wide Column | 21292.17 |
| 7 | Vector | 16395.88 |
| 8 | Graph | 14947.43 |
| 9 | Object Oriented | 8418.14 |
| 10 | Hierarchical | 3406.55 |
| 11 | RDF | 1701.67 |
| 12 | Array | 1280.14 |
| 13 | Native XML | 737.94 |
| 14 | Spatial | 680.79 |
| 15 | Event | 654.42 |
| 16 | Content | 33.94 |
| 17 | Multivalue | 12.68 |
The OpenRank and activity rankings for 2023 for each sub-domain of the database domain show that:
- Relational, key-value, and document databases are the top three subdomains, accounting for over 70% of the database domain;
- Relational's two indicators exceeded those of the second through fifth-place finishers combined and accounted for more than 40 percent of the database field, making it a mega-subcategory.
6.3.2 Trends over the last five years in projects under the various subfields of the database area

Figure 6.6 Trends in OpenRank by Subdomain in Database Domain (2019 - 2023)

Figure 6.7 Trends in Activity by Subdomain in Database Domain (2019 - 2023)
The trend of OpenRank and the trend of activity of projects in each subdomain of the database domain over the past five years shows that:
- Over the past five years, Relational, Key-value, and Document have consistently ranked in the top three in both indicators;
- Search Engine, Wide Column, Time Series, Graph, Vector, and Object Oriented ranked fourth through ninth, with both indicators trending upward;
- Search Engine and Vector subcategories have shown a fast growth rate. Search Engines have jumped two positions to become the fourth largest subcategory. Vector is still competing with the Graph subcategory and has the potential to improve its OpenRank. The influence created by the large model has not yet subsided, and it is predicted that Vector will overtake Graph by 2024.
6.3.3 Open source quadrant map of projects under each sub-domain of the database domain
There are three metrics involved in the Open Source Quadrant diagram: Activity, Openrank, and CommunityVolume. CommunityVolume is the same formula as the Attention metric in open-digger, i.e. a weighted sum of the number of stars and the number of forks of the target project in a given period of time:sum(1*star+2*fork).
Quadrant plotting methods:
- Select the Top 10 projects by activity for each database subcategory;
- Make a
log(x)-log(y)scatterplot oflog(openrank)-log(communityvolume), the base of the log is 2, denote the number of half-lives required for the spatial influence openrank and the temporal influence communityvolume to decay to 1, respectively. - The vertical line corresponding to the mean value of the horizontal coordinates of all points on the graph is used as the vertical axis, and the horizontal line corresponding to the mean value of the vertical coordinates of all points on the graph is used as the horizontal axis to divide into four quadrants.
There are a total of 18 subcategory labels in the database domain, and the top 9 categories that account for more than 1% of activity in 2023 were selected for statistical analysis to map the open source quadrant as follows:
The search engine category is highly polarized, with projects like ElasticSearch with high OpenRank and CommmunityVolume, and projects like Sphinx and Xapian with very low OpenRank and CommmunityVolume.
From the first quadrant: relational, document, search engine, and vector are all database types with strong openrank influence and CommmunityVolume focus, while object_oriented is relatively weak in both areas.
The Open Source Quadrant plot shows the vertical distribution of the Top 9 subclasses of databases in terms of activity. Among these subclasses, two stand out - search engine and vector. These two subclasses have a higher community volume than OpenRank, which means they have more active contributors. They also have a higher community voice, meaning their opinions and feedback are more valued. Additionally, they are known for faster development expectations compared to the other subclasses.
6.4 Project Analysis of Generative AI Area
This section will examine the open-source projects related to generative AI, using the Generative AI Open Source (GenOS) Index as a reference point. We will classify these projects into four subcategories: tools, models, applications, and infrastructure. The detailed insights are outlined below:
6.4.1 Growth trends in subfields of generative AI over the past five years


- Categorization analysis of activity and influence across models, tools, apps, and infrastructure reveals consistent trends;
- AIGC open source projects in the modeling category are more influential and active than those in the tools and applications categories;
- The modeling category has grown rapidly since 2022 and surpassed Infrastructure in 2023. AIGC's innovative application development had a significant breakthrough in 2023, leading to concurrent application growth.
6.4.2 Trends in OpenRank and Activity Top 10 for Projects in the Generative AI Domain


- langchain is ranked #1 in terms of influence and activity and is highly regarded by developers;
- transformers has been the reigning champion in the AIGC field for the past few years, and its position is expected to remain unchallenged until 2023. This project has significantly impacted both the academic and open-source communities, showcasing its groundbreaking capabilities;
- stable-diffusion-webui is an AIGC tool that has gained a lot of attention from developers. It has surpassed "Transformers" in terms of activity and is likely to surpass it in terms of influence by 2024;
- Since being open-sourced in 2023, several AIGC projects have gained significant influence and activity, placing them on the Top 10 list. This highlights the rapid pace of change in the field of AIGC.
6.4.3 Top 10 List of OpenRank and Activity of Projects in Generative AI in 2023
1. List of OpenRank Top 10 Projects in Generative AI
| Ranking | Project Name | OpenRank |
|---|---|---|
| 1 | langchain-ai/langchain | 6080.25 |
| 2 | huggingface/transformers | 4422.84 |
| 3 | AUTOMATIC1111/stable-diffusion-webui | 3881.6 |
| 4 | Significant-Gravitas/AutoGPT | 2664.85 |
| 5 | ggerganov/llama.cpp | 2339.8 |
| 6 | oobabooga/text-generation-webui | 2242.5 |
| 7 | milvus-io/milus | 2001.11 |
| 8 | run-llama/llama_index | 1913.01 |
| 9 | facebookincubator/velox | 1589.53 |
| 10 | invoke-ai/InvokeAI | 1571.45 |
2. List of Top 10 Active Projects in Generative AI
| Ranking | Project Name | Activity |
|---|---|---|
| 1 | langchain-ai/langchain | 22563.04 |
| 2 | AUTOMATIC1111/stable-diffusion-webui | 13933.03 |
| 3 | huggingface/transformers | 13618.11 |
| 4 | Significant-Gravitas/AutoGPT | 10961.81 |
| 5 | cobabooga/text-generation-webui | 8597.33 |
| 6 | ggerganov/llama.cpp | 8108.62 |
| 7 | run-llama/llama_index | 7532.47 |
| 8 | milvus-io/milus | 6488.35 |
| 9 | facebookincubator/velox | 4923.05 |
| 10 | Chatchat-space/Langchain-Chatchat | 4477.63 |
7. Developer Insights
Developers are vital to open-source innovation. They create and supply open-source projects and contribute significantly to them. The total number of developers and their collaboration mechanism impact the amount of contribution. In this section, we will analyze data on individual developers at national and regional levels.
7.1 Geographical distribution of developers
This analysis, like the one in Section 1.3, is based on 10 million active GitHub developers. Out of the 100 million registered users on GitHub, only 2 million developers have provided accurate geolocation information, which makes up a 2% sample.
1. GitHub Active Developers Distribution Map
The number of active developers on GitHub was first visualized on a map, as shown below.

Figure 7.1 2023 GitHub Active Developers Distribution Map
GitHub developers are concentrated in areas with large populations and fast internet development, such as coastal regions of China, Europe, the United States, India, and the southeast coast of Brazil. They are sparsely distributed in other areas with small populations or less developed internet.
2. GitHub Active Developers by Country / Region

Table 7.1 2023 Ranking of Countries/Regions by Number of Active Developers
| Ranking | States | Number of active |
|---|---|---|
| 1 | United States | 236899 |
| 2 | China | 113893 |
| 3 | India | 107066 |
| 4 | Brazil | 83932 |
| 5 | Germany | 64836 |
| 6 | United Kingdom | 55175 |
| 7 | Canada | 42238 |
| 8 | France | 40341 |
| 9 | Russia | 31534 |
| 10 | Japan | 21942 |
The United States has the largest number of developers, followed by China, India and Brazil, while other countries with a certain population and economic level, such as Canada and some European countries, also have a large number of developers on GitHub.
3. Distribution of Active Developers on GitHub in China
The graph below visualizes the distribution of the number of active developers on GitHub on a map.

Table 7.2 2023 Regional Ranking of Active Developers in China
| Ranking | Regions | Quantity |
|---|---|---|
| 1 | Beijing | 24151 |
| 2 | Sengah | 18215 |
| 3 | Guangdong | 16153 |
| 4 | Zhejiang | 10927 |
| 5 | Taiwan | 8823 |
| 6 | Jiangsu | 5437 |
| 7 | Chechen | 5311 |
| 8 | Hong Kong | 3344 |
| 9 | Hubei | 3273 |
| 10 | Shaanxi | 1993 |
Beijing is found to have the most GitHub users in China, followed by Shanghai, Guangzhou, and Zhejiang. Most of China's active GitHub users are in the eastern coastal regions, while some central provinces such as Shaanxi, Hunan, and Hubei also have a lot of active users, and it's worth noting that Sichuan has the most active GitHub users outside of the coastal regions.
4. GitHub China Developer Influence Distribution after OpenRank Weighting
Trying to do the aggregation with the OpenRank value of the developers in each region, we get the influence distribution map and regional ranking of Chinese developers, as shown in the following graph.

Table 7.3 OpenRank Influence Ranking in China
| Ranking | Regions | OpenRank |
|---|---|---|
| 1 | Beijing | 506624.08 |
| 2 | Sengah | 435804.42 |
| 3 | Guangdong | 306014.24 |
| 4 | Zhejiang | 274284.92 |
| 5 | Taiwan | 216991.49 |
| 6 | Chechen | 96881.79 |
| 7 | Jiangsu | 83321.13 |
| 8 | Hong Kong | 83238.46 |
| 9 | Hubei | 51370.74 |
| 10 | Fujian | 33482.25 |
As you can see from the rankings, the OpenRank regional rankings are highly consistent with the regional rankings for the number of active developers:
- There are significant regional differences in terms of the influence of Chinese developers. Developers from Beijing and Shanghai dominate the first class, while developers from Guangdong, Zhejiang, and Taiwan fall into the second class. These regions have a different level of influence compared to those ranked lower;
- The overall number of active people in Sichuan is smaller than in Jiangsu, but the overall influence is greater, and the same phenomenon occurs in Fujian and Shaanxi.
7.2 Developer Working Hours Analysis
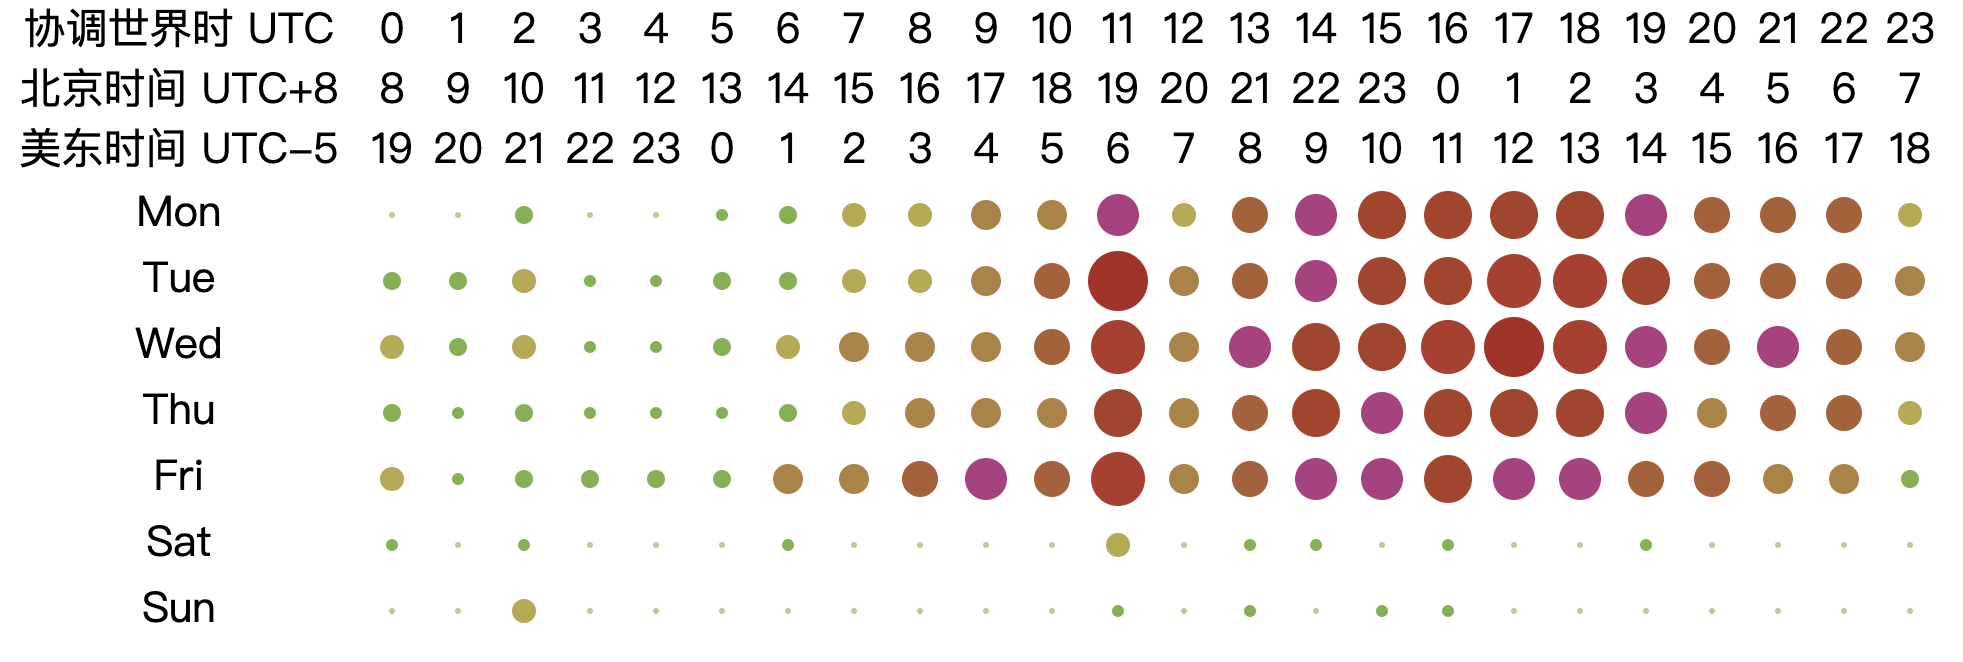
This section analyzes the working hours of GitHub and Gitee developers. By default, the time is in the UTC zone, with an 8-hour lag compared to the East Eighth Time Zone, i.e., Beijing Standard Time. The data is scaled to the [1-10] range by default using the min-max method, with larger dots representing higher values in the time zone graph.
7.2.1 Distribution of working hours of global developers
Distribution of working hours of GitHub-wide developers
According to statistics on developers' working hours across GitHub, the majority of developers work between 6 and 21 hours. There is a higher concentration of developers working at 12 o'clock, likely due to timed tasks. Weekends (Saturdays and Sundays) are relatively inactive.

Distribution of working hours of Gitee-wide developers

The Gitee data clearly aligns more with the East Eighth Time Zone's work time routine.
Global developer working hours distribution, excluding bots

RAfter removing the bot data, it is found that the time distribution of developers is more prevalent in the interval of 6:00 - 21:00, which is more evenly distributed.
7.2.2 Distribution of working hours on the project
Below is a comparison of the working hours distribution of the top four Chinese OpenRank repositories and the top four global OpenRank GitHub repositories in 2023.
Distribution of working hours on the top four OpenRank projects in the global GitHub repository
- NixOS/Nixpkg
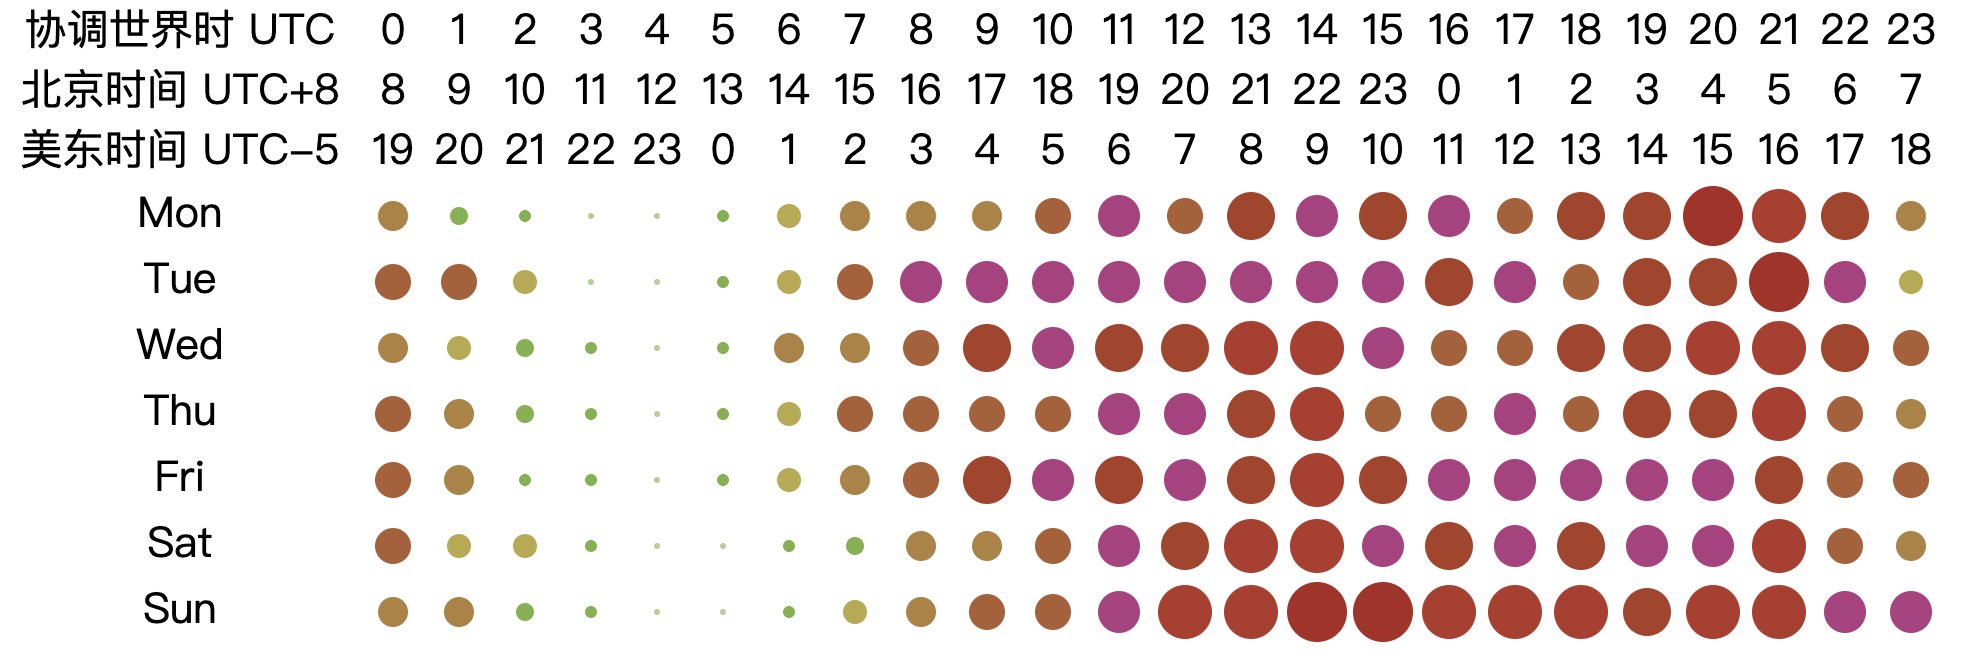
- Home-assistanceant/core

- microsoft/vscode
- MicrosoftDocs/azure-docs

Distribution of working hours of the top 4 OpenRank repositories in China
- OpenHarmony
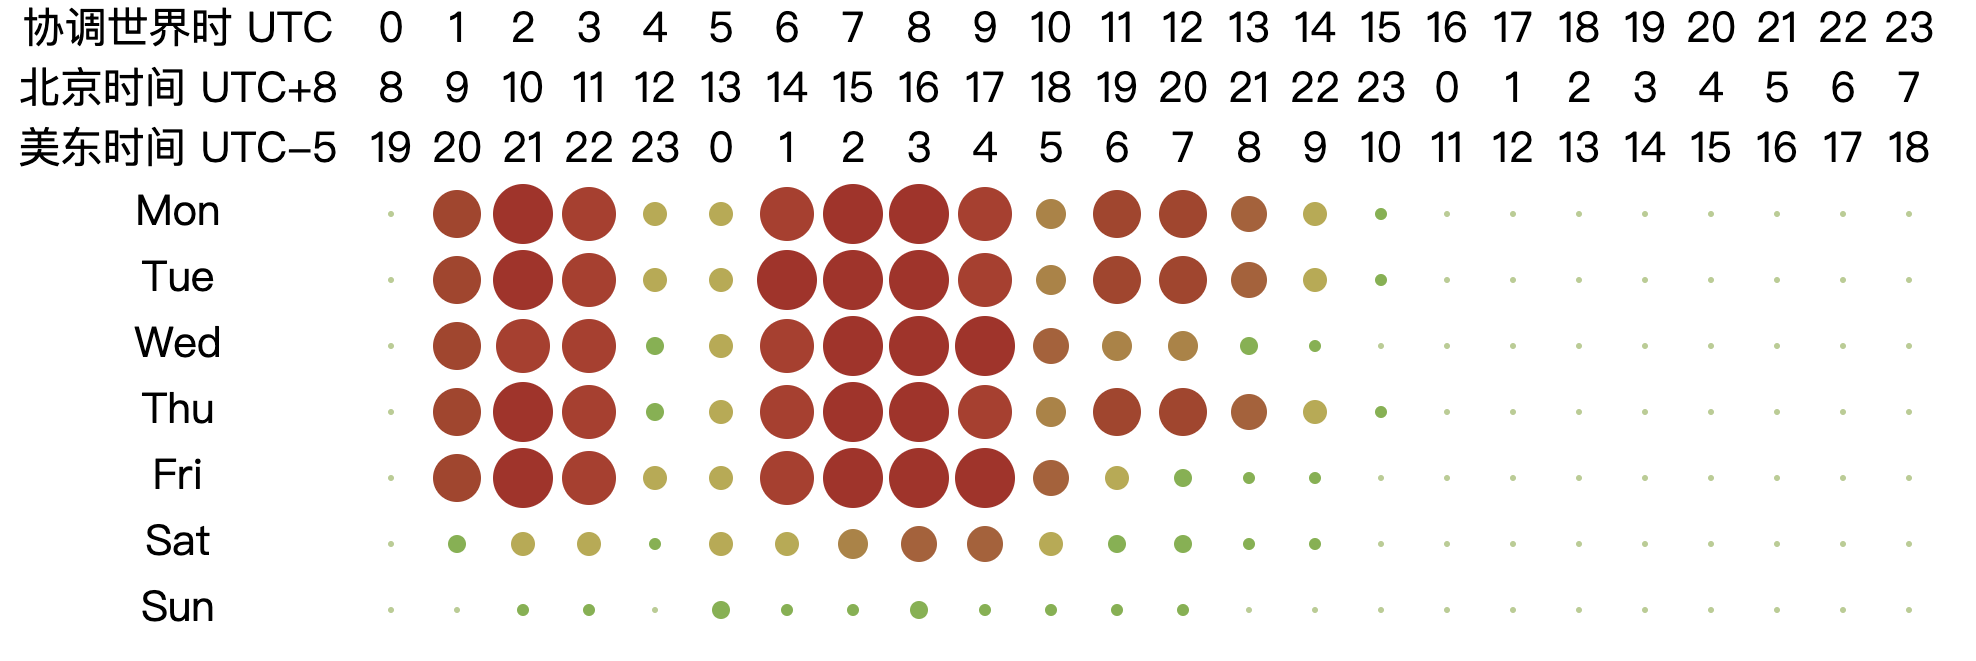
- openEuler
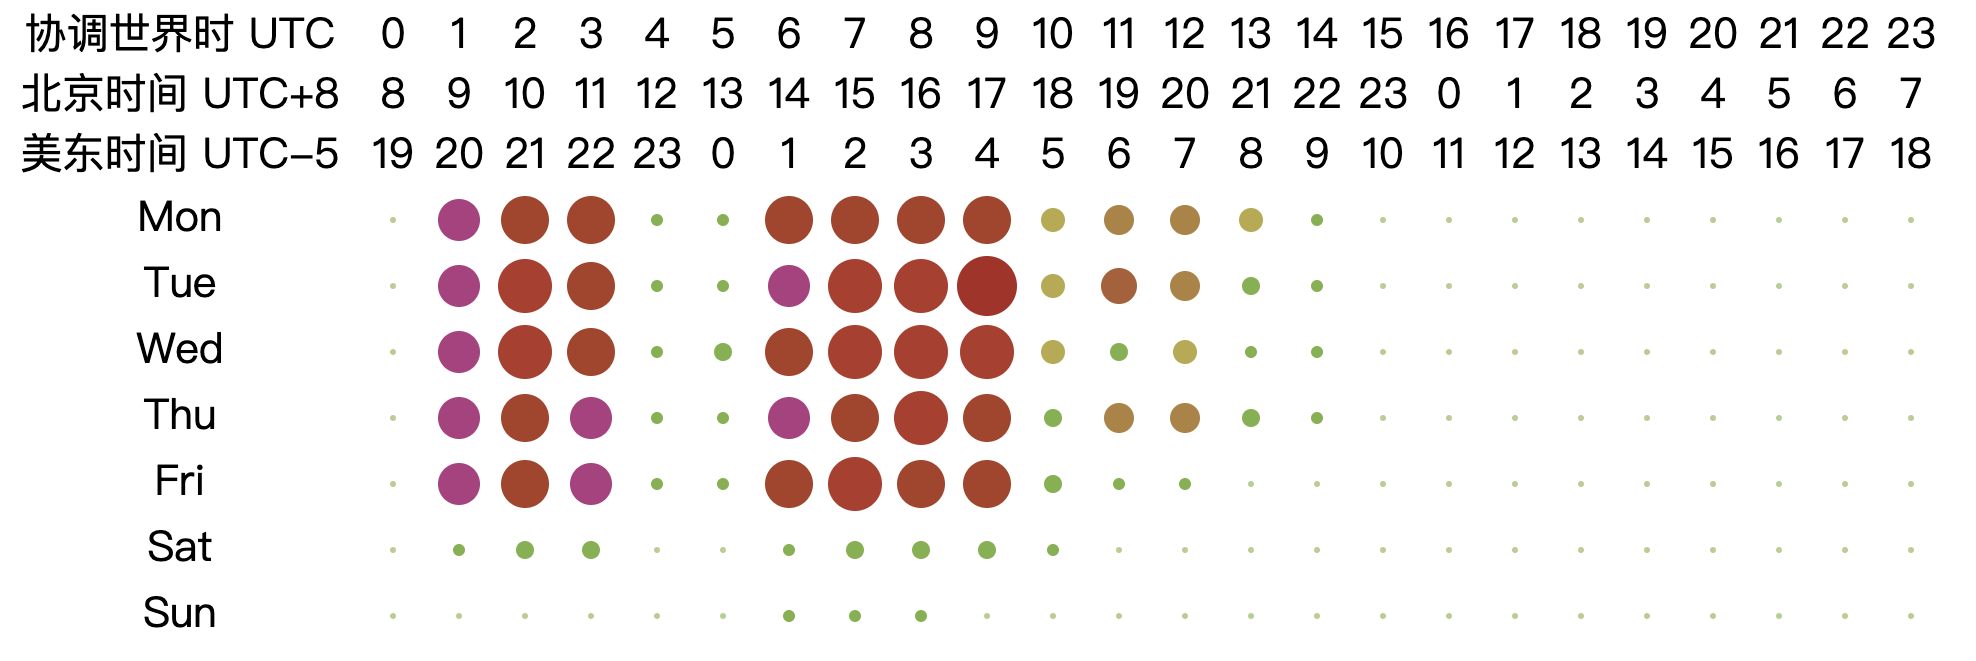
- PaddlePaddle

- MindSpore

7.3 Developer Role Analysis
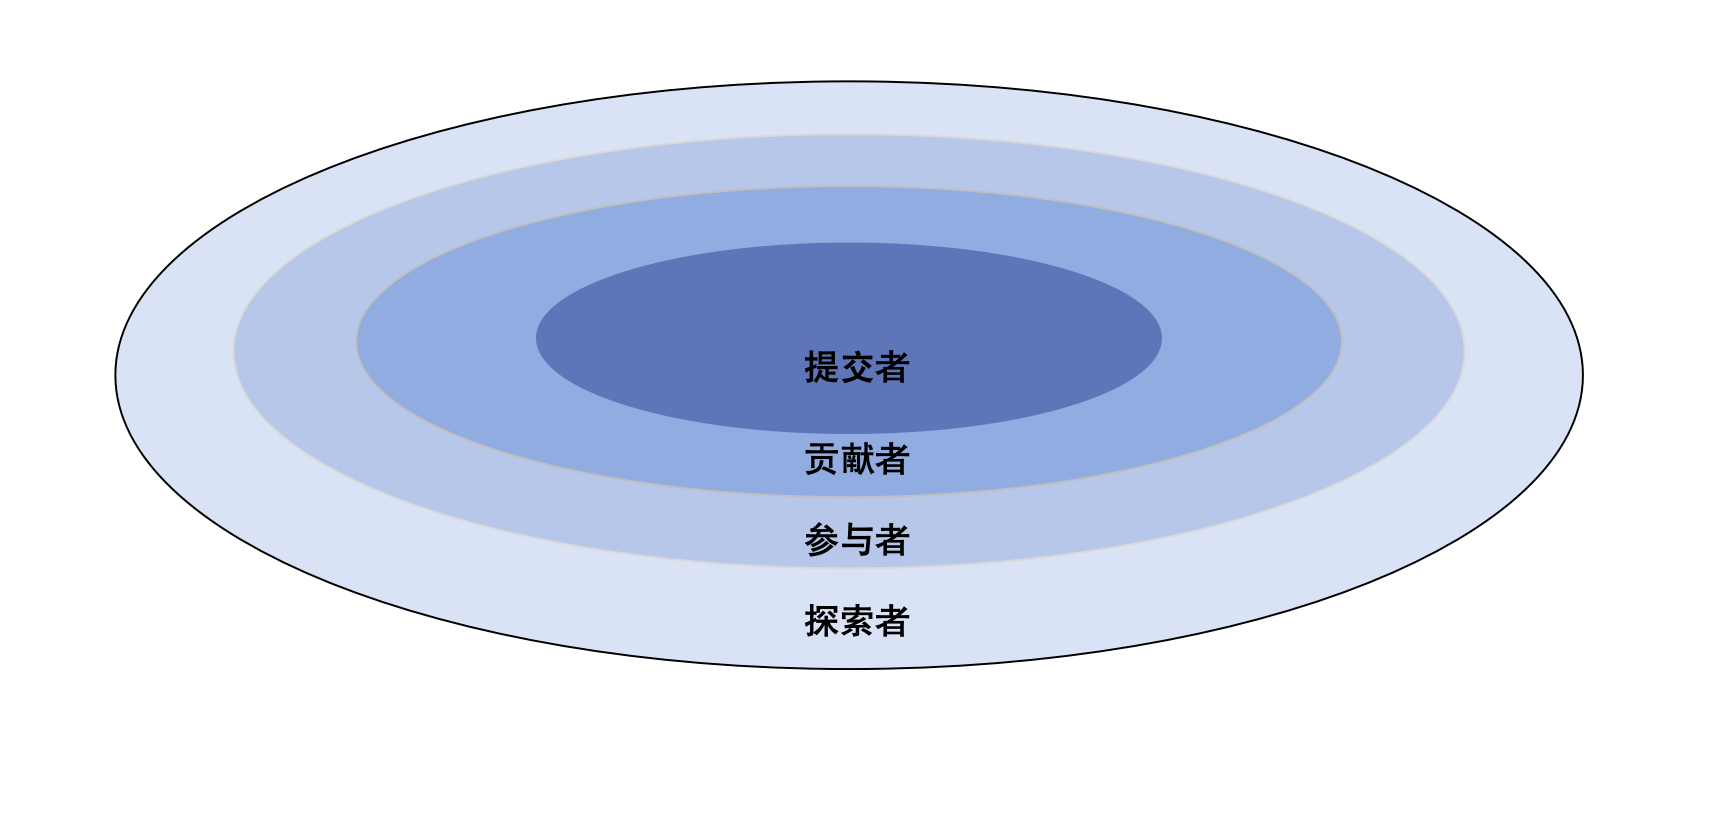
This section categorizes GitHub users into four roles: Explorer, Participant, Contributor, and Committer, based on events they trigger in open-source repositories. The four roles are defined in the table below.
| Roles | Definitions | Meaning |
|---|---|---|
| Explorer | Users who star a project | Indicates the user has some interest in the project |
| Participants | Users who have made an Issue or Comment on a project | Indicates user participation in the project |
| Contributor | Users with Pull Requests (PRs) for a project | Indicates that the user has contributed to the project's code base |
| Commiter | Users participating in PR-review or merge | Indicates that the user has contributed deeply to the project |
The figure below shows the four cascaded and structured roles. Using the defined role structure, we evaluate the top 10 projects in the OpenRank rankings of GitHub-wide projects from three perspectives: number of roles, time change, and developer role evolution. This is based on the project ranking list in Part II.
7.3.1 Distribution of roles
| Repository name | Explorer | Participant | Contributor | Committer |
|---|---|---|---|---|
| NixOS/Nixpkg | 6244 | 3381 | 3074 | 2638 |
| Home-assistanceant/core | 17777 | 9116 | 1230 | 905 |
| microsoft/vscode | 20113 | 16027 | 525 | 339 |
| MicrosoftDocs/azure-docs | 8939 | 2282 | 1591 | 610 |
| pytorch/pytorch | 13237 | 6391 | 1230 | 685 |
| godotenine/godot | 23426 | 7203 | 1020 | 569 |
| flutter/futter | 14056 | 11101 | 637 | 334 |
| odooo/odoo | 5078 | 1841 | 930 | 570 |
| digitalinnovationone/dio-lab-open-source | 3619 | 907 | 504 | 40 |
| microsoft/winget-pkgs | 1852 | 1395 | 1384 | 286 |
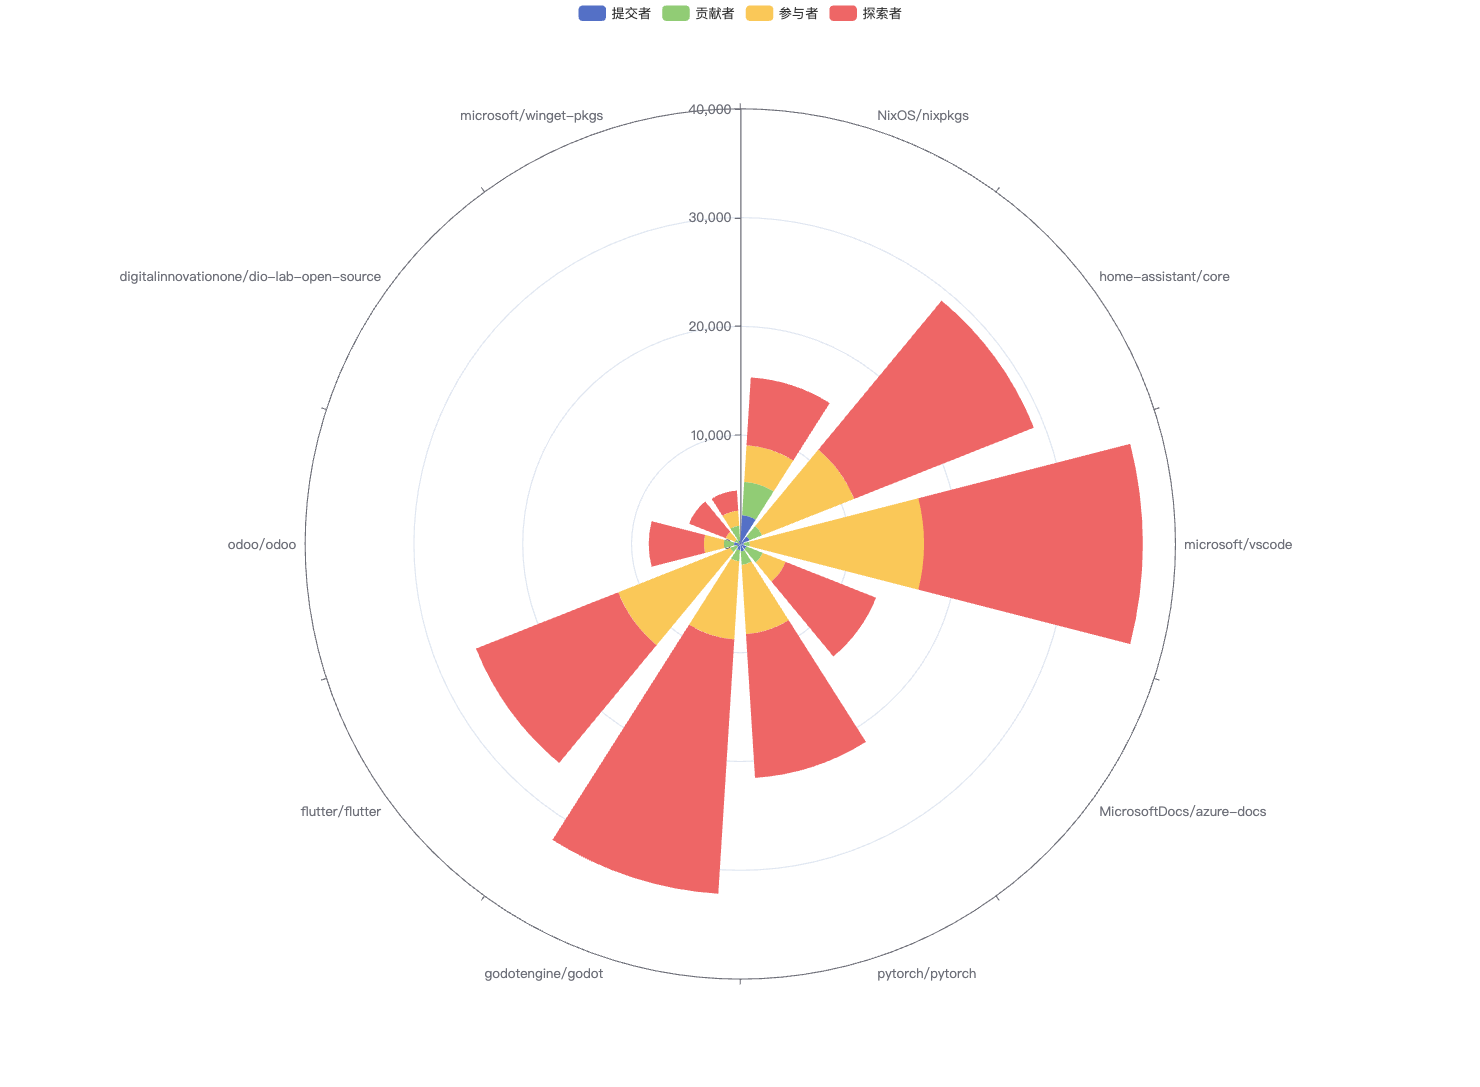
Spring:
- Based on the number of explorers, the three most popular projects are godotengine/godot, microsoft/vscode, and home-assistant/core, suggesting they have received widespread attention and support;
- microsoft/vscode is the project with the largest gap between the number of participants and contributors, while microsoft/winget-pkgs has the smallest gap between the two;
- NixOS/nixpkgs has the highest number of committers at 2,638 compared to other projects. In contrast, the digitalinnovationone/dio-lab-open-source project has the lowest number of committers.
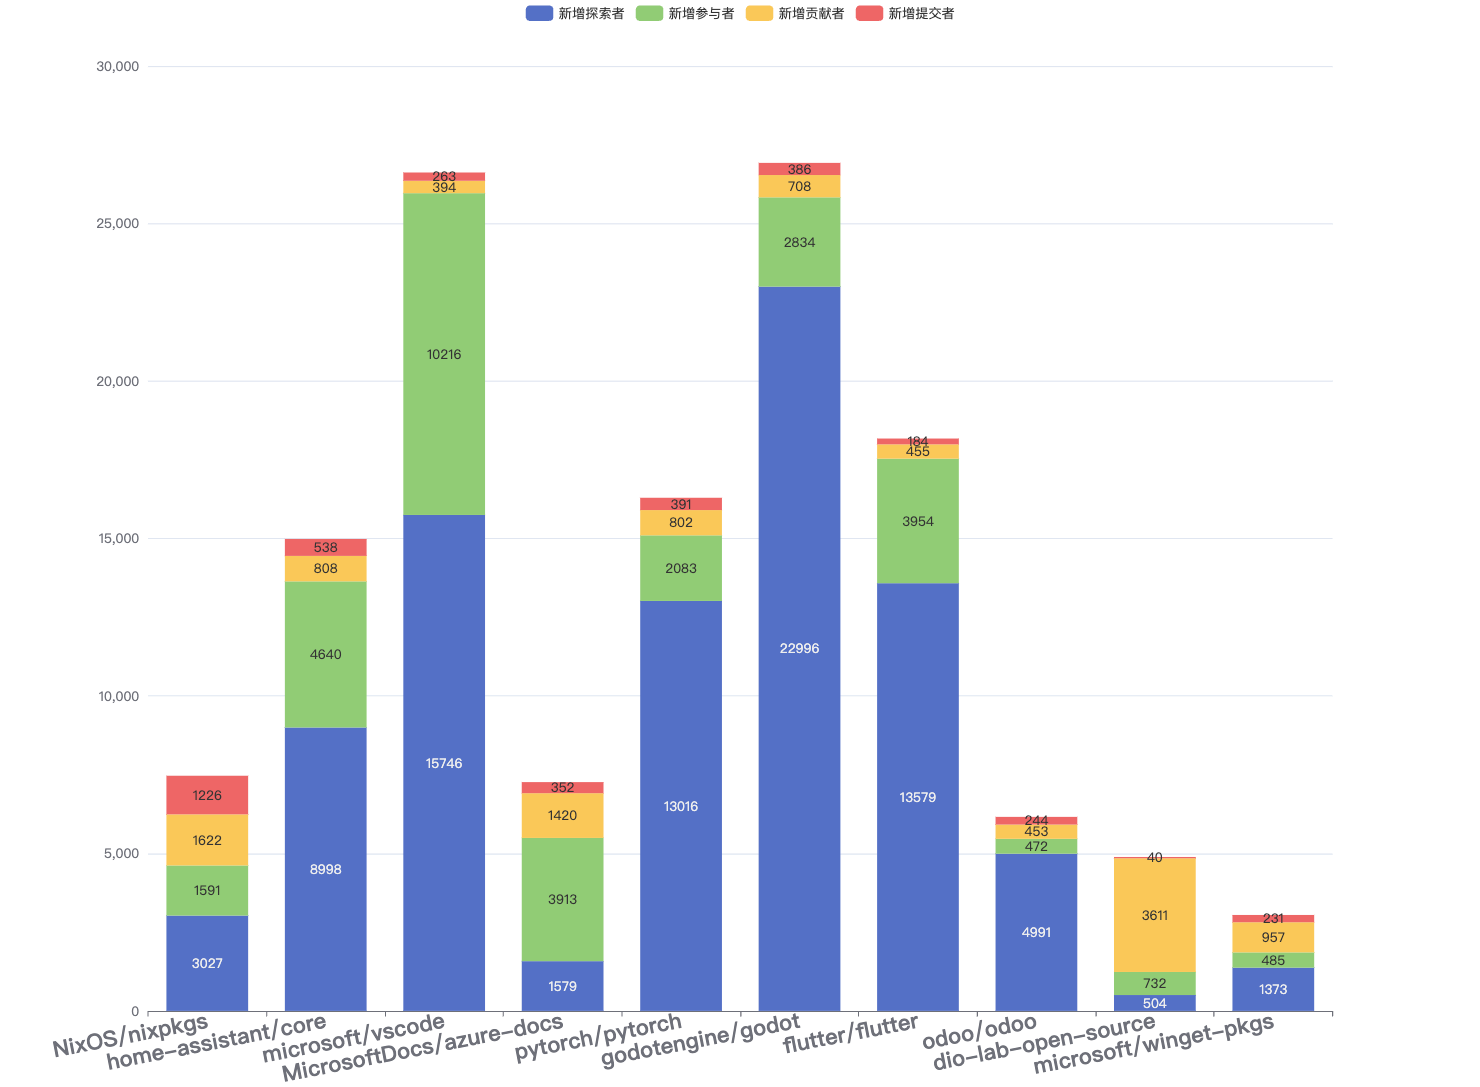
7.3.2 New additions to roles in 2023
Role additions are counted as valid additions to role X if a user who was not in role X (e.g., a contributor or submitter role) before 2023 becomes in that role in 2023.
For example, if A submits a PR to Project B in 2021 (but never participates in the Code Review process), and A reviews the PR in Project B in 2023, A is the new committer.
The details of the roles added are shown in the graph below and the table below.
| Repository name | New Committer | New Contributor | New Participant | New Explorer |
|---|---|---|---|---|
| NixOS/Nixpkg | 1226 | 1622 | 1591 | 3027 |
| Home-assistanceant/core | 538 | 808 | 4640 | 8998 |
| microsoft/vscode | 263 | 394 | 10216 | 15746 |
| MicrosoftDocs/azure-docs | 352 | 1420 | 3913 | 1579 |
| pytorch/pytorch | 391 | 802 | 2083 | 13016 |
| godotenine/godot | 386 | 708 | 2834 | 22996 |
| flutter/futter | 184 | 455 | 3954 | 13579 |
| odooo/odoo | 244 | 453 | 472 | 4991 |
| digitalinnovationone/dio-lab-open-source | 40 | 3611 | 732 | 504 |
| microsoft/winget-pkgs | 231 | 957 | 485 | 1373 |
The results showed:
- The repository godotengine/godot received the highest number of stars, 22,996, with half added in September 2023 due to game developers seeking open-source alternatives to Unity's new charging strategy. Meanwhile, digitalinnovationone/dio-lab-open-source and Microsoft/winget-pkgs received the fewest new stars, 504 and 1,373, respectively;
- The repository with the highest number of new participants was microsoft/vscode with 10,216; digitalinnovationone/dio-lab-open-source had the fewest new Issues with 732;
- The repository with the highest number of new contributors was NixOS/nixpkgs with 1,622;
- The repository with the highest number of new committers was also NixOS/nixpkgs with 1,226.
7.3.3 Perspectives on Developer Evolution
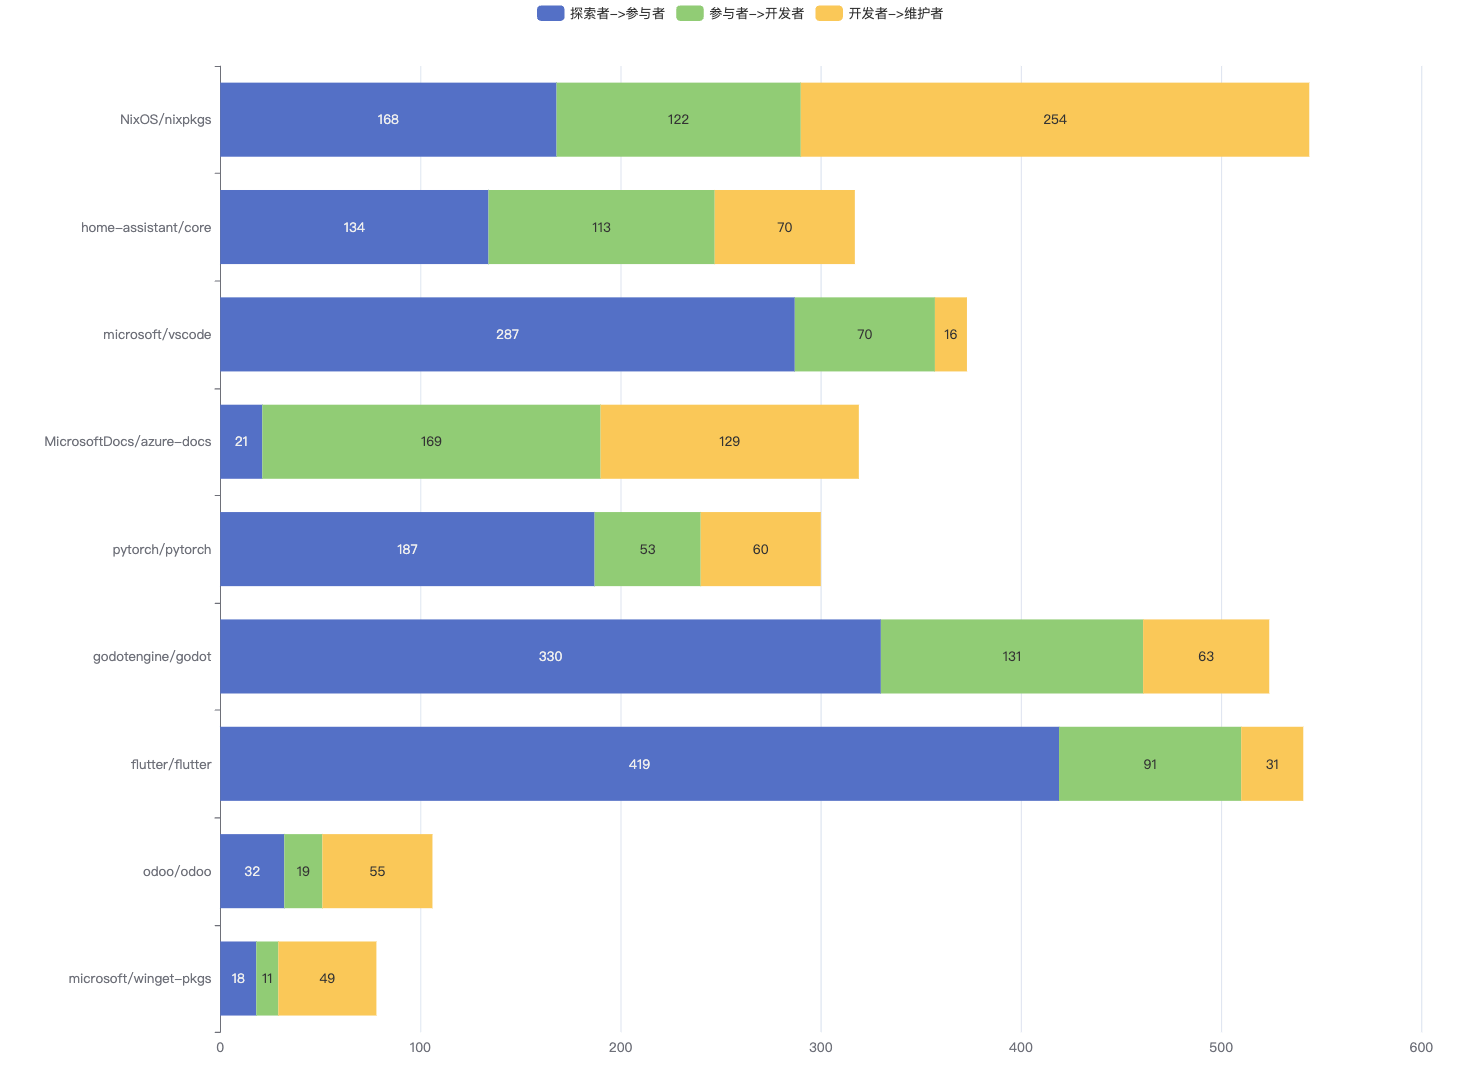
The developer evolution process is defined as the number of roles in an open-source community that moves to other roles. This report only measures the number of developers who have moved from one role to a more profound one. For example, a user who participated until 2023 will change from a participant to a contributor in 2023 when they make their first PR.
| Repository name | Contributor -> Committer | Participant -> Contributor | Explorer -> Participant |
|---|---|---|---|
| NixOS/Nixpkg | 254 | 122 | 168 |
| Home-assistanceant/core | 70 | 113 | 134 |
| microsoft/vscode | 16 | 70 | 287 |
| MicrosoftDocs/azure-docs | 129 | 169 | 21 |
| pytorch/pytorch | 60 | 53 | 187 |
| godotenine/godot | 63 | 131 | 330 |
| flutter/futter | 31 | 91 | 419 |
| odooo/odoo | 55 | 19 | 32 |
| digitalinnovationone/dio-lab-open-source | 0 | 0 | 0 |
| microsoft/winget-pkgs | 49 | 11 | 18 |
The results showed:
- Across communities, we can observe the typical funnel model of an evolutionary path from explorers to participants to contributors and committers. In godotengine/godot, for example, 330 contributors successfully evolved to committers, 131 participants became contributors, while 63 explorers evolved to participants. This trend was also observed in other communities and is consistent with the general evolution of community members from initial exploration to deeper involvement.
- In some communities, such as NixOS/nixpkgs, we observed many contributors evolving into committers. In this community, 254 contributors successfully evolved into committers, which may represent a relatively high demand for code review. This may encourage more contributors to become deeply involved in maintenance, which may help improve the quality and stability of the community's code.
- In some communities, such as flutter/flutter and godotengine/godot, we observed a relatively high number of successful conversions of explorers into participants. In flutter/flutter, 419 explorers evolved into participants, while in godotengine/godot, 330 explorers turned into participants.
- The digitalinnovationone/dio-lab-open-source project has no data since it was created in 2023.
7.4 Robot account analysis
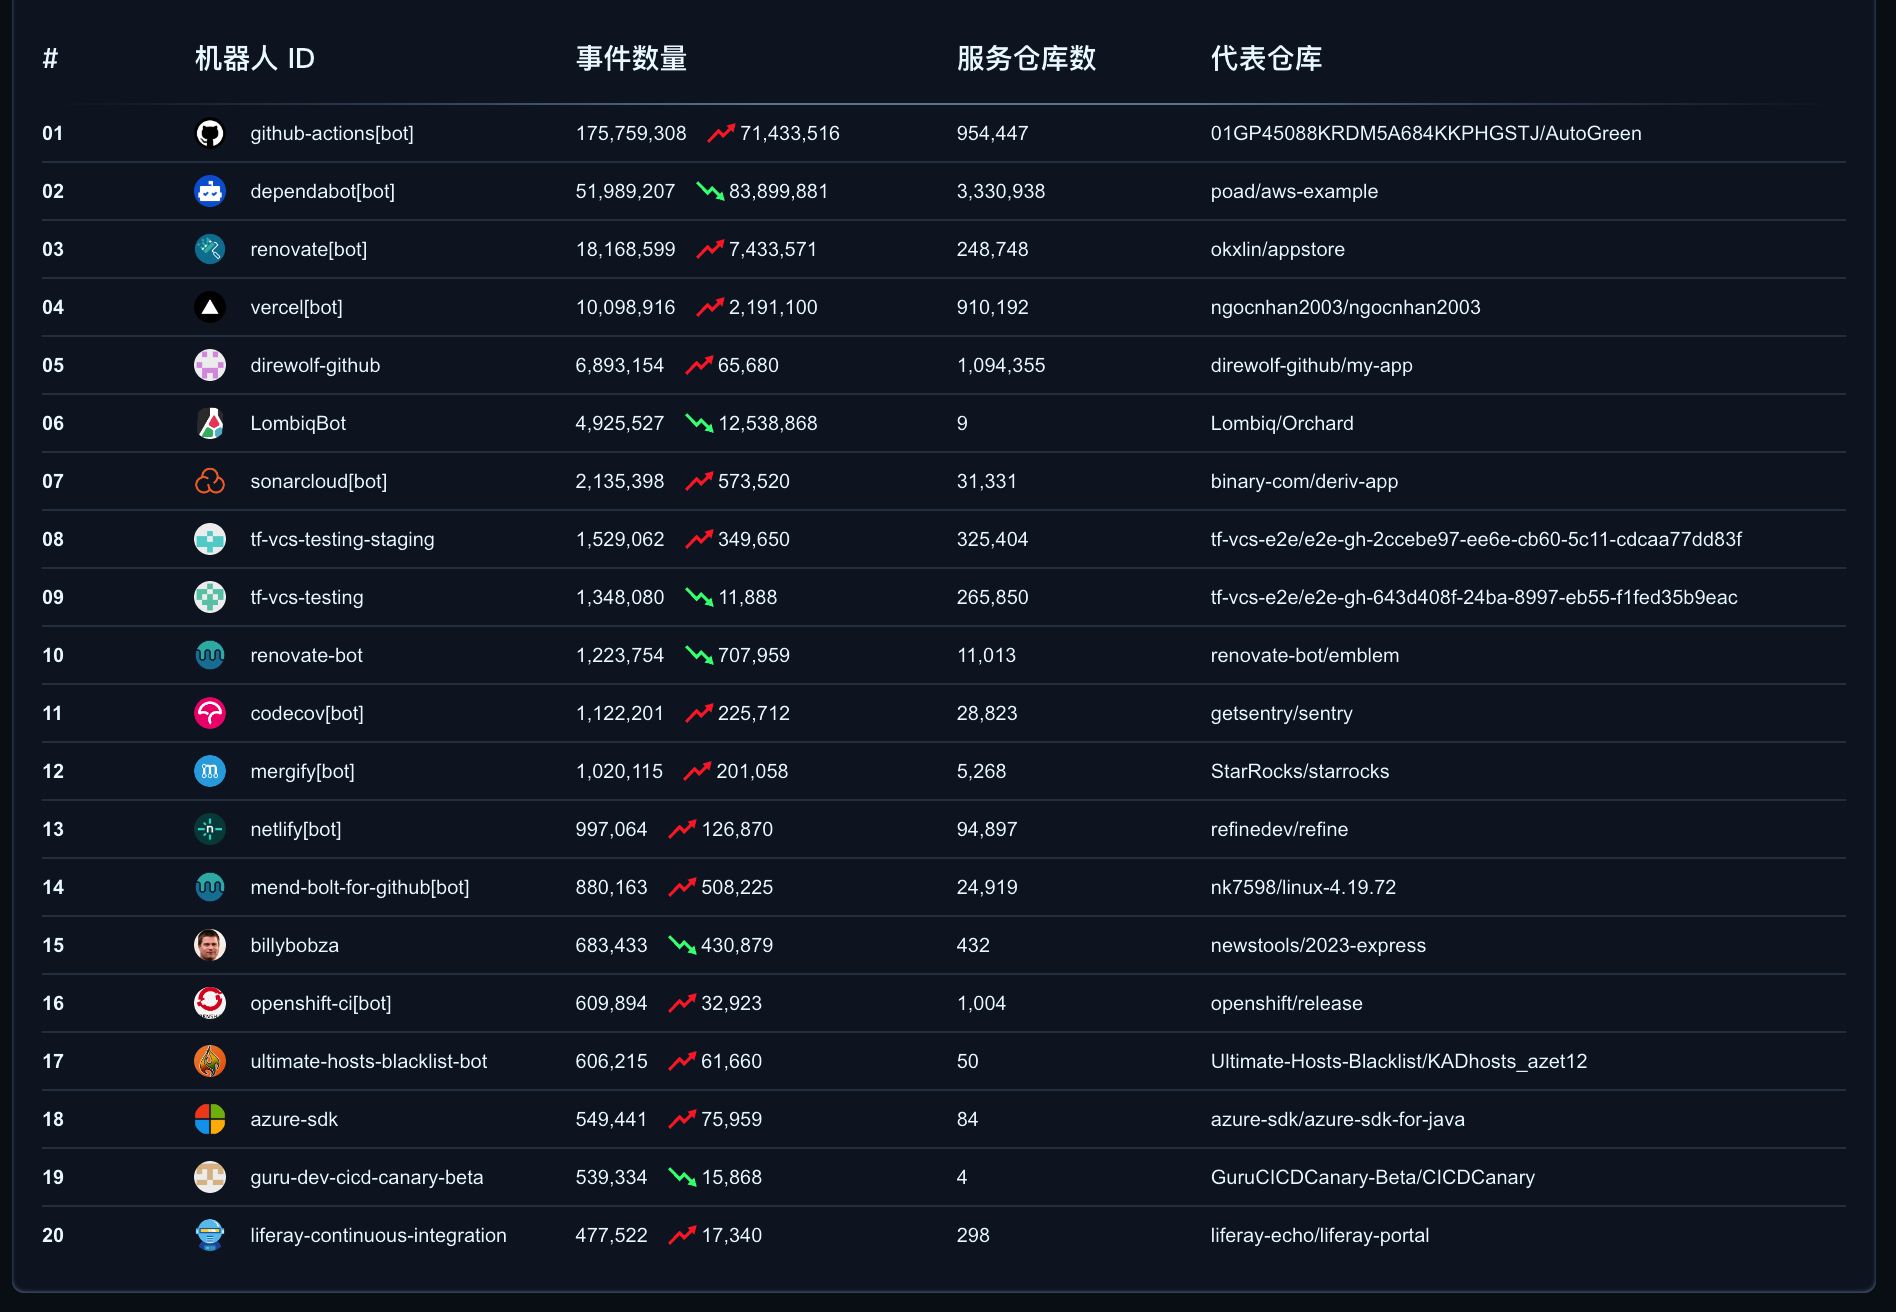
Robotic (bot) automation is a significant contributor to open-source collaboration platforms. This section analyzes nearly 600 million repository events across 7.7 million open-source repositories and over 1,200 bot accounts for 2023.
7.4.1 Analysis of active data of robots
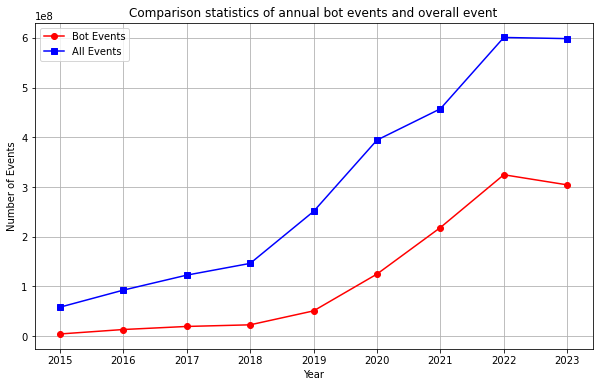
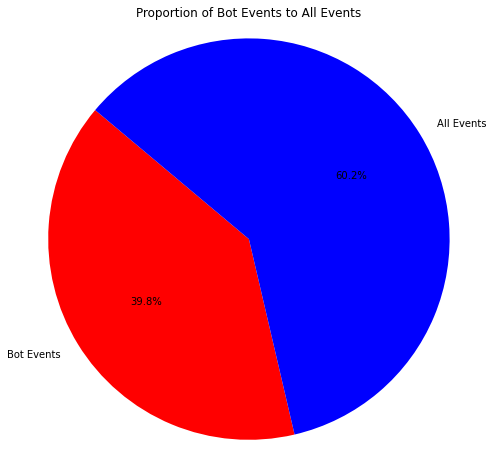
Analyzing the robotics activity data from 2015 to 2023, some of the observations are as follows:
Since 2019, the number of bot events has increased significantly, rising from 4,217,635 to 304,257,084. This surge in bot account activity on GitHub can be attributed to the widespread adoption and advancement of GitHub's automation, continuous integration, and continuous deployment (CI/CD) tools between 2019 and 2021.
Despite the small number of bot accounts, each bot serves multiple repositories, demonstrating efficiency and broad reach.
7.4.2 Analysis of event types for robots
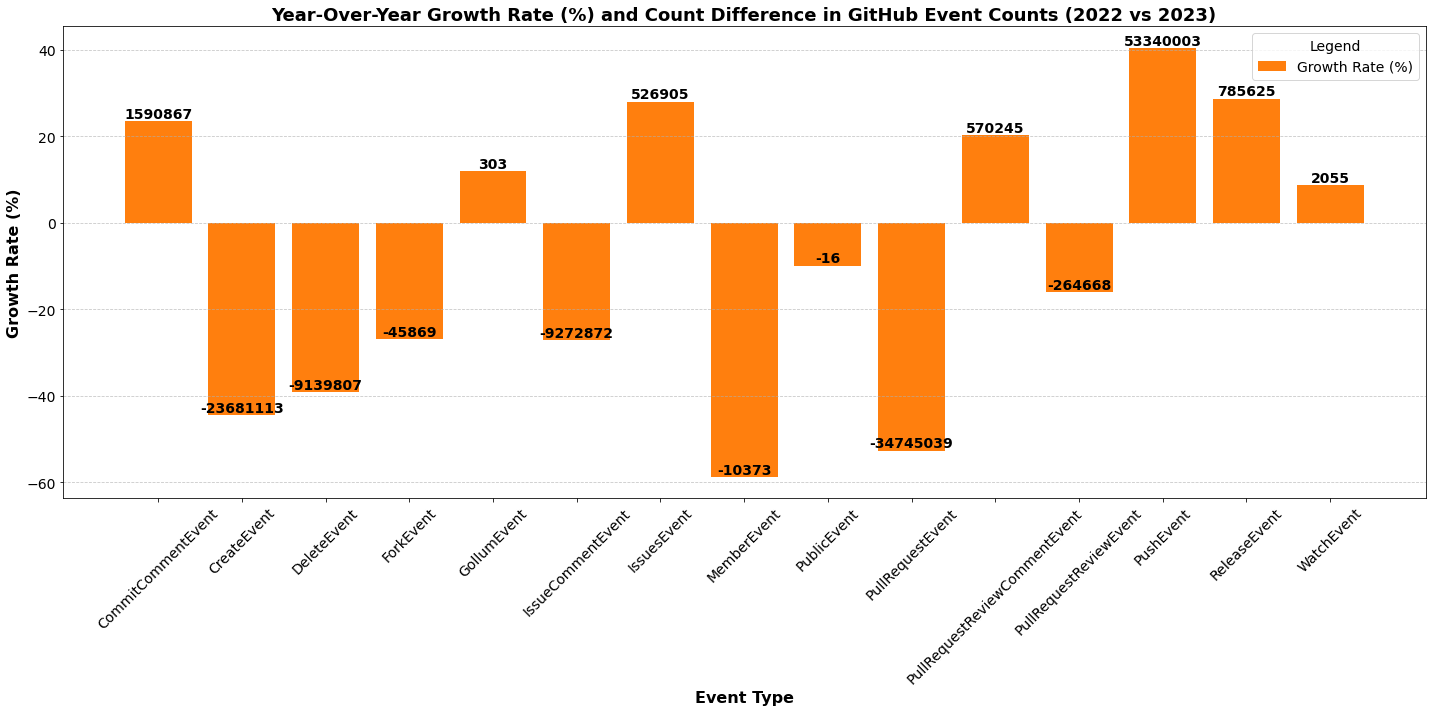
This graph shows the change in the number of GitHub events by type and their growth rate between 2022 and 2023. By comparing the data from these two years, we can gain insight into the trend of bot account usage in the development process:
- Dominance of Code Push: PushEvent dominates bot account activity, with a significant rise in volume especially in 2023, suggesting that bot accounts play an important role in code maintenance and updates;
- Changes in project creation activity: CreateEvent is very active in 2022, but declines in 2023, which may indicate a decline in bot account activity in creating new projects;
- Importance of code review and collaboration: PullRequestEvent and IssueCommentEvent numbers were higher in both years, showing the active participation of bot accounts in code reviews and issue discussions;
- Changes in activity types: DeleteEvent decreases in 2023 compared to 2022, while ReleaseEvent increases, reflecting the different focus of robotic accounts in project lifecycle management;
- Increase in annotation-related events: CommitCommentEvent and PullRequestReviewCommentEvent increased in 2023, indicating that bot accounts are becoming more active in the code review process with discussions and feedback;
- Specific uses of bot accounts: less common event types such as GollumEvent, MemberEvent, PublicEvent, and WatchEvent are relatively low in number, suggesting that bot accounts are primarily used for specific automation tasks and are less involved in social interactions.
7.4.3 Distribution of working hours for robot accounts
Similar to the developer working hours distribution, we also analyzed the data on the working hours of bot accounts.
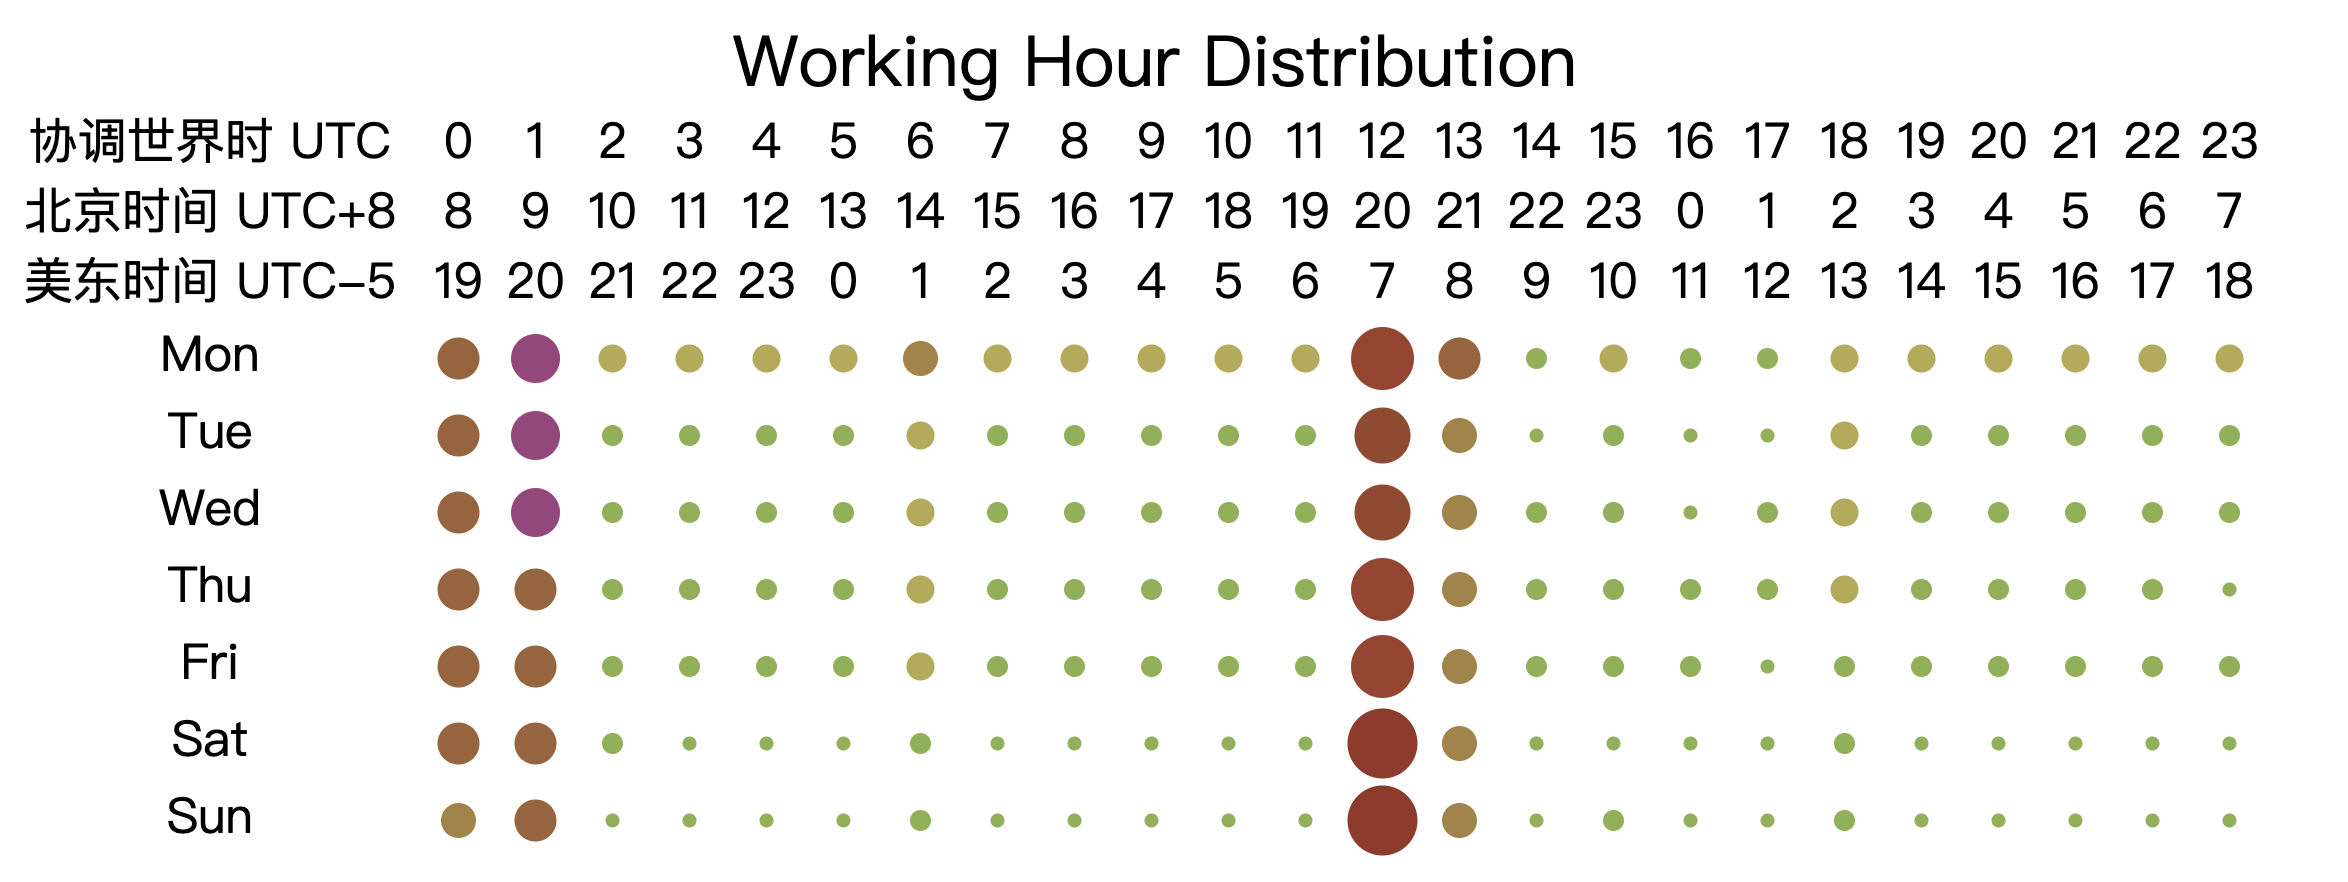
- The working hour distribution of the robot account is mainly centered on 0am to 1am and 12pm to 13pm;
- Based on the global developer time zones it can be surmised that most automated processes are more active in the early morning and midday hours;
- Robot work active time is less relevant to workdays and non-workdays, most automated collaborative tasks are scheduled, and fewer are related to responding to a contributor's event.
7.4.4 GitHub's top list of incidents for collaborative bots
8. Case Studies
8.1 openEuler Community Case Study
In 2023, the OpenDigger community integrated Gitee data for the first time, allowing Gitee projects to participate in OpenRank calculations. The openEuler community surpassed PaddlePaddle in the same year, achieving an OpenRank value of 16,728. This made it the second largest open source community in China, after openHarmony.
In 2023, the openEuler community attracted 3,941 developers to collaborate on Issues or PRs, with 1,934 contributors successfully contributing and merging at least one PR to the openEuler community's repository.
It's worth noting that the openEuler community started a document bug hunt in early 2023. They also integrated an interactive page contribution mechanism with Gitee on the community's official document website. This feature enables developers to correct any errors they find while reading the documents directly on the official website. With just a single click, they can launch Gitee lightweight pull requests (PRs), without having to jump to the Gitee platform or perform Git operations.
The data change from this innovative mechanism is impressive. In 2023, the openeuler/docs repository incorporated 7,764 PRs, 74% of which were submitted directly through the official web page. The launch of this mechanism also significantly increased the average number of active contributors per month (from 30 to 80), and the average number of PRs merged per month (from 116 to 722).
One noteworthy project is openeuler/mugen, which is a highly active testing framework project within the openEuler community. In 2023, 138 developers participated in discussions and contributed to the project, with 95 successfully joining PR. The project has the third-highest OpenRank within the openEuler community, after the openeuler/docs documentation repository and the openeuler/kernel kernel repository. This excellent testing framework enables developers to quickly write and test cases to verify the correctness and validity of their contributions, significantly reducing the cost of subsequent contributions.
To summarize, the openEuler community has achieved a high OpenRank value thanks to its effective contribution mechanism and testing framework. The community has designed an interactive system that allows for easy documentation contribution with minimal costs. Moreover, contributors can quickly verify the accuracy of their code through a reliable testing framework. These developer experience optimizations are excellent examples for other open-source communities to follow and implement.
8.2 List of top repositories contributed by Chinese developers
We analyzed how Chinese developers contributed to the top 30 repositories in the OpenRank ranking list for 2023 using data from almost 10 million GitHub developer accounts, including nearly 200,000 from China:

Most of the projects are represented in the master OpenRank list, the more interesting ones include:
NixOS/Nixpkgs:It's also a top international project, a package management tool for a new operating system, and while most of the updates are package information updates, it also means that the ecosystem of that operating system itself is thriving.
Intel-analytics/BigDL:a runtime repository was created to run LLM on the Intel XPU in 2017. However, it became nearly obsolete by the end of 2021. Surprisingly, it made a comeback with the rise of LLM in 2022 and now maintains an active size of around 50 people per month.
Screenshot above from HyperCRX
siyuan-note/siyuan:Siyuan Notes, a privacy-first domestic open source knowledge management tool, supports bidirectional knowledge block-level references and maintains an active community size of one hundred people per month. Supports subscription commercialisation at a very affordable price.
baidu/amis:is an open-source low-code page generation framework developed by Baidu. In recent years, low-code projects have gained immense popularity, such as Ali's open-source LowcodeEngine, Harmony ecosystem family's DevEco Studio, etc. These projects have provided great convenience for developers to rapidly develop applications using low-code.
Cocos/cocos-engine:domestic game engine leader, with the rise of the concept of meta-verse, godot and other game engines become the world's important top open source projects, and domestic game engine cocos/cocos-engine also has excellent performance in China.
MaaAssistantArknights/MaaAssistantArknights This is a fascinating project aimed at automating daily quests for the game Tomorrow's Ark using a script assistant. The automation can be achieved through a mobile phone simulator. The project is community-maintained, open source, free, and supports all desktop platforms. It has received over 10,000 stars and has more than 300 active contributors every month, which is fantastic.

 2023 COSR