 2024 COSR
OSS Data Analytics
Overview
The 2024 China Open-Source Annual Report is centered on comprehensive and in-depth data insights, presenting the flourishing development of China’s open-source ecosystem across nine key chapters.
- Chapter 1: Macro Insights – Examines China’s unique position and influence in the global open-source ecosystem through key metrics such as major events, active repositories, active users, and programming languages.
- Chapter 2: OpenRank Rankings – Provides authoritative and systematic OpenRank metrics, ranking open-source projects, enterprises, foundations, developers, and collaboration bots across China and globally, establishing a key benchmark for measuring open-source contributions.
- Chapters 3 & 4: Enterprise & Foundation Insights – Leverages dynamic evolution charts and trend analysis to offer a deep dive into the strategic layout and development trajectories of enterprises and foundations in the open-source domain, both in China and worldwide.
- Chapter 5: Technology Insights – Focuses on Top 10 rankings and project trends in various fields, capturing cutting-edge technological advancements and innovation trends.
- Chapter 6: Open-Source Project Insights – Explores the diversity of project types, domains, and topics, showcasing the vibrancy and innovative potential of the open-source ecosystem.
- Chapter 7: Developer Insights – Analyzes developer demographics, work patterns, regional distribution, and the use of automation tools, offering a comprehensive profile of the developer community.
- Chapter 8: Commercial Open-Source Insights – Investigates the development landscape of commercial open-source enterprises and projects in China and globally, uncovering their growth paths and success factors.
- Chapter 9: University Open-Source Insights – Highlights student participation in open-source through OSPP (Open Source Promotion Plan) and OpenRank community algorithms, revealing emerging trends in open-source talent cultivation.
Overall, this data-driven report, with its rich analytical perspectives and multidimensional insights, paints a comprehensive picture of China’s open-source landscape in 2024, offering valuable references and strategic insights for the industry.
Metrics Introduction
Influence/Contribution (OpenRank)
The OpenRank metric, developed by X-lab Open Laboratory, is built upon the developer-project collaboration network and features multi-dimensional evaluation capabilities. For projects, OpenRank focuses on influence to comprehensively assess their overall development status and community engagement;For developers, it emphasizes contribution as a key indicator, accurately reflecting their collaborative value and activity level within the open-source ecosystem. Additionally, OpenRank can aggregate evaluation targets at higher levels—such as enterprises, organizations, and foundations—revealing their strategic positioning and pivotal role in the open-source collaboration network. Currently, OpenRank has gained broad recognition in both industry and academia, and has been incorporated into several authoritative standards and practices, including: The Open Source Governance Standards by the China National Institute of Standardization, The Open Source Governance Whitepaper by the China Academy of Information and Communications Technology (CAICT), The Global Open Source Dashboard by the OpenAtom Foundation, and The Governance Toolkit for enterprise open-source offices. As a result, OpenRank has become an authoritative benchmark for measuring the health of the open-source ecosystem and its collaborative value.
OpenRank References:
[2] Shengyu Zhao: How to Evaluate an Open Source Project (III) — Value Flow Network, 2021 (in Chinese)
[3] China Electronics Standardization Institute, Ministry of Industry and Information Technology: Information Technology — Open Source Governance — Part 3: Community Governance and Operation [T/CESA 1270.3-2023], Information Technology — Open Source Governance — Part 5: Open Source Contributor Evaluation Model [T/CESA 1270.5-2023], 2023 (in Chinese)
Activity
Activity is one of the core metrics developed by X-lab, designed to quantitatively evaluate the level of activeness of projects or developers. Developer activity is calculated through a weighted assessment of their key behaviors in the open-source ecosystem (such as submitting Issues, creating PRs, conducting code Reviews, etc.), accurately reflecting their engagement and contribution intensity. Project activity, on the other hand, is derived from the aggregated activity of all developers within a project and standardized to provide a comprehensive measure of the project’s overall activity and community participation level. This metric offers a scientific and quantifiable basis for assessing the health of the open-source ecosystem.
Activity References:
[2] Shengyu Zhao: How to Evaluate an Open Source Project (I) — Activity, 2021 (in Chinese)
1. Overall Macro Insights
1.1 Base Event
Basic events are the core data source of open source ecological analysis, referring to event log data generated by developer activity behavior on global open source collaboration platforms (such as GitHub, Gitee, etc.). Through statistical analysis of these events, we can have a macro-in-one insight into the development trend of the global open source ecosystem. This report covers data from two major platforms, GitHub and Gitee.
1.1.1 GitHub Holistic Event Trends
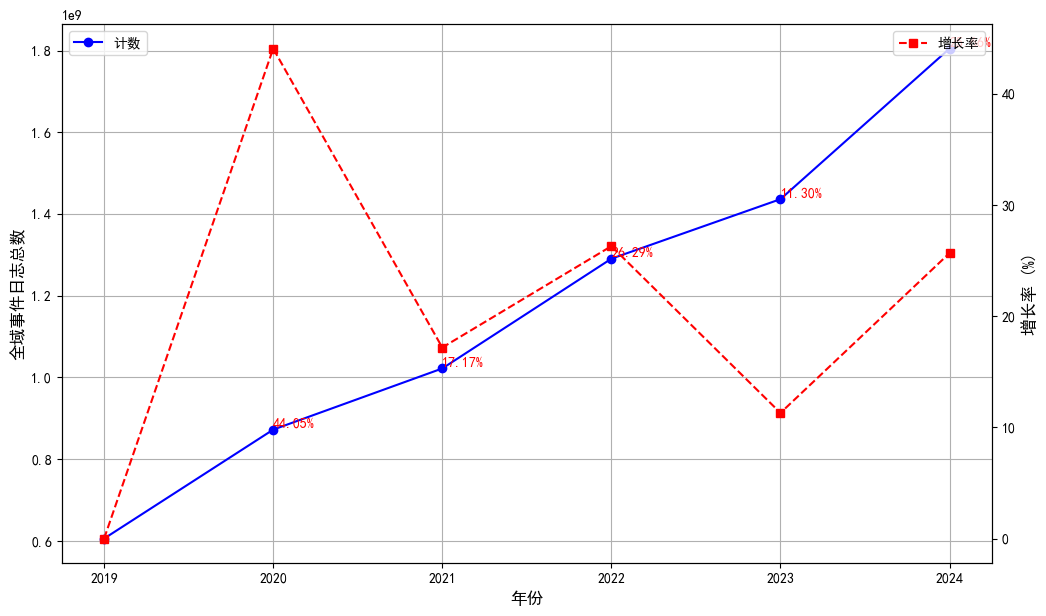
In 2024, the total number of GitHub's global event logs reached 1.75 billion, an increase of about 10% on the same period last year. Although the growth rate slowed down from the high-speed growth period from 2018 to 2023, the 10% growth rate still indicates the key position of open source in global digital transformation. The main factors driving this growth include:
- Popularity of AI tools such as GitHub Copilot: Since the beginning of 2023, the widespread use of AI-assisted programming tools has attracted more developers, especially developers in the Southern Hemisphere.
- Growth of developers: The increase in the number of developers around the world directly drives the rise in event logs.
Figure 1.1 shows the growth trend of GitHub's annual event count, highlighting the continued activity of the open source ecosystem.
1.1.2 Trend Comparison of GitHub and Gitee Event Counts
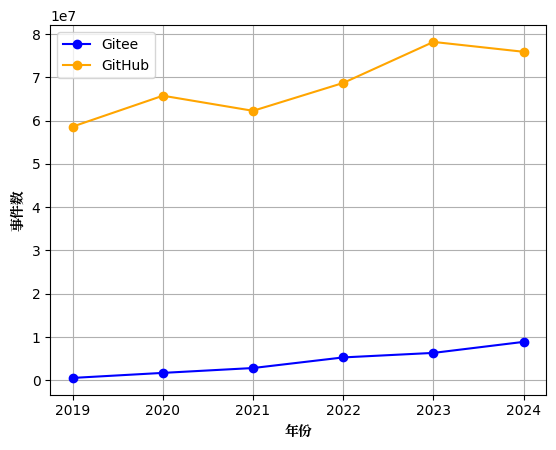
For comparison, we selected the top 30,000 active repositories on each platform of GitHub and Gitee, and focused on eight types of events closely related to open source participation (such as CommitCommentEvent, PullRequestEvent, etc.). The analysis results show:
- GitHub: The number of events continues to grow, but the volatility is large, reflecting the diversity and activity of its global platform.
- Gitee: The number of events has steadily increased, showing the steady development and standardization trend of domestic open source communities.
Although the number of events on GitHub is still much higher than Gitee, Gitee's stable growth shows that domestic developers' enthusiasm and contribution to open source are constantly increasing. Figure 1.2 shows the comparison of event trends between the two major platforms.
1.1.3 Segmented Event Type Analysis
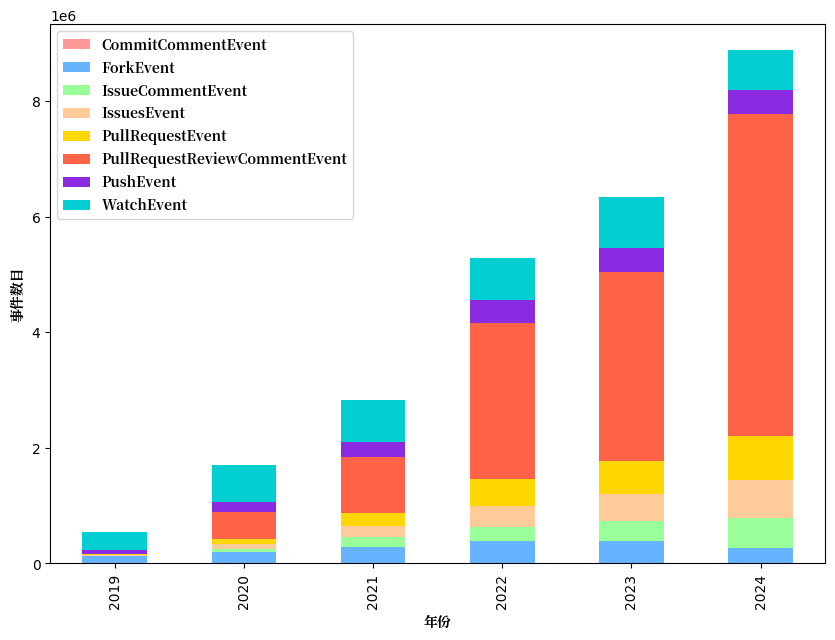
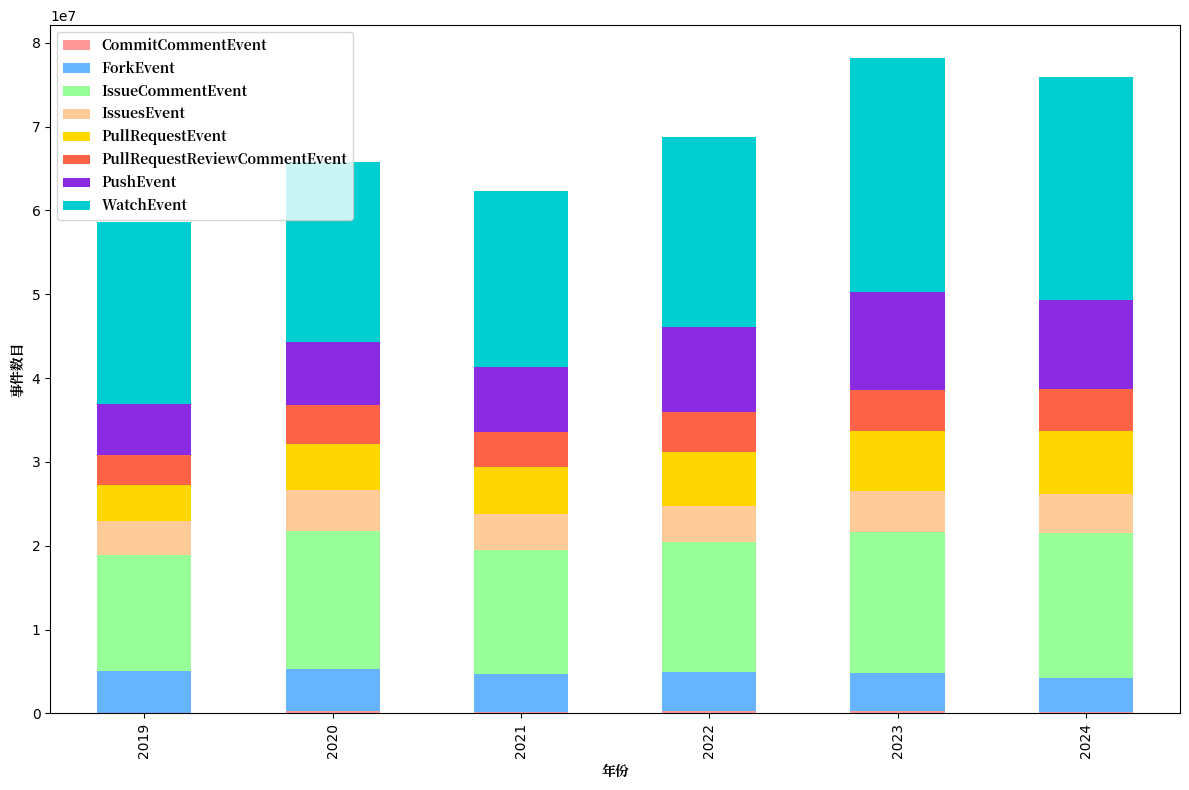
Further analyze the distribution of event types (Figure 1.3 and Figure 1.4):
- GitHub:Watch events (i.e. Star behavior) account for the highest proportion, reflecting users' attention and recognition of the project. Pull Request and Issue Comment events follow, indicating the activity of code collaboration and problem discussion.
- Gitee:Pull Request Review Comment events account for the highest proportion, mainly due to the automated audit mechanism of the platform CI characteristics. This trend reflects the transformation of domestic developers from "follower" to "contributor" roles.
1.2 Active Repositories
1.2.1 GitHub Active Repository Trends
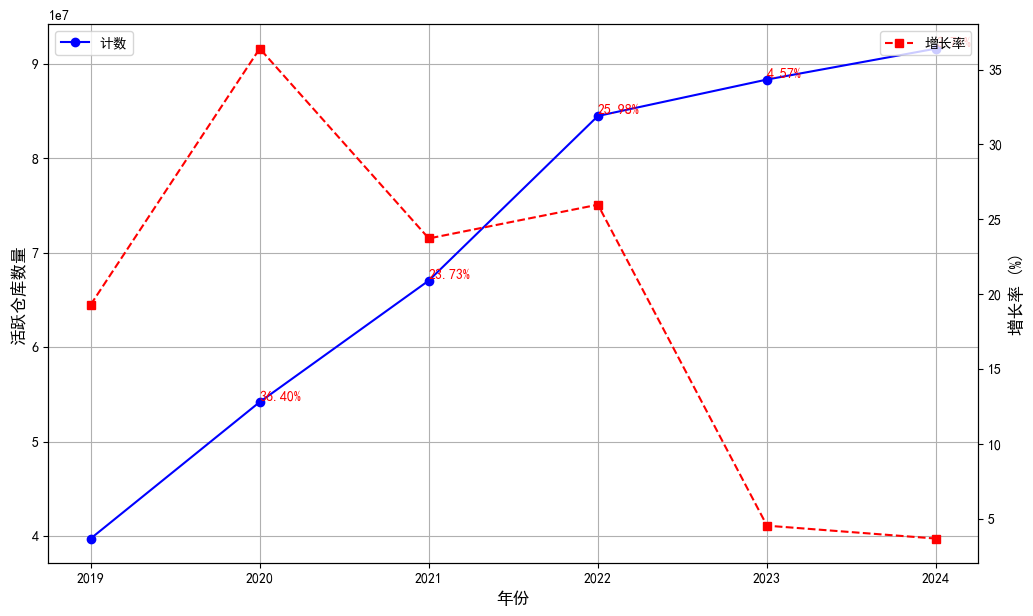
The number of active GitHub warehouses continues to grow, but the growth rate slows down year by year (Figure 1.5). Remote work and digital transformation during the epidemic in 2020 have driven a surge in the number of warehouses, while the slowdown in growth after 2022 is related to the maturity of the market and the development of competitive platforms (such as Gitee and GitLab).
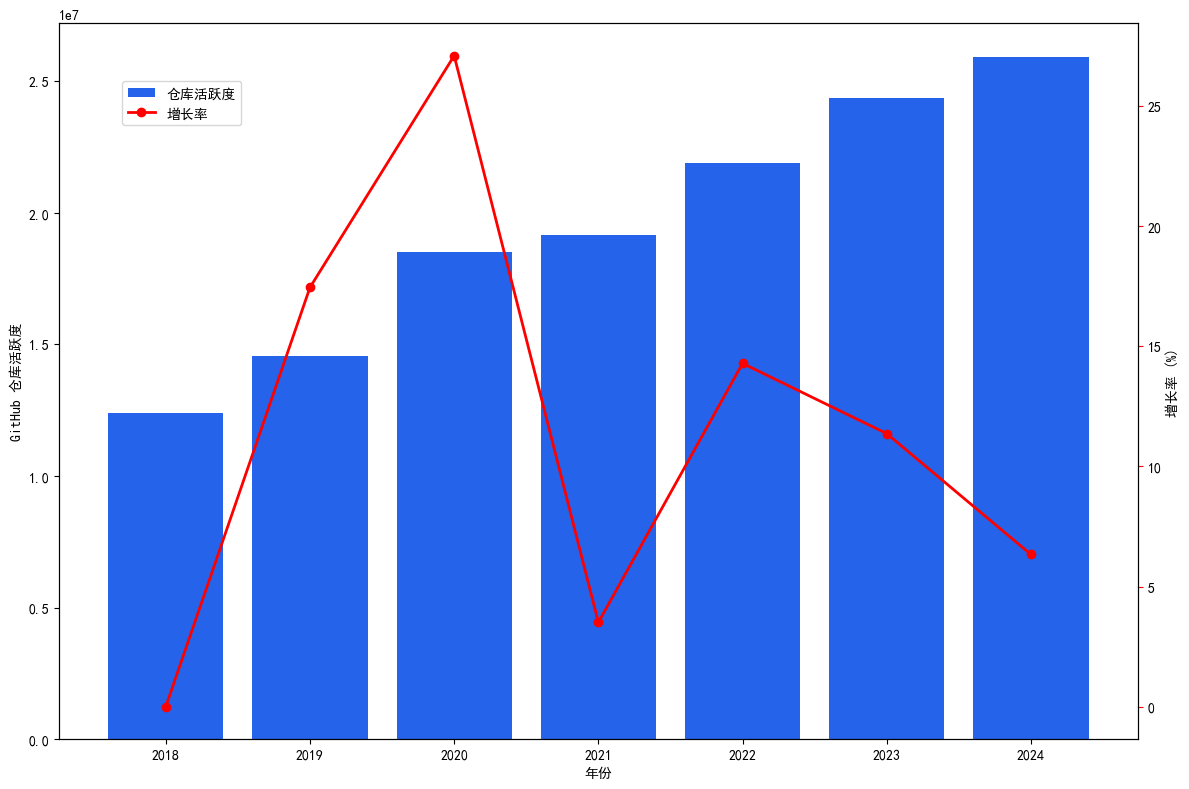
Figure 1.6 shows the general trend in GitHub repository activity, which is near an all-time high in 2024.
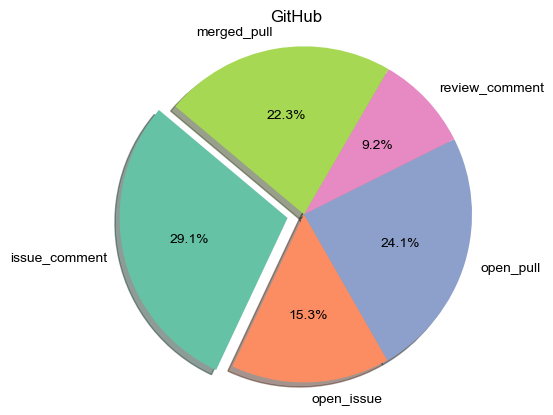
Issue-related events (such as Issue Comment) and Pull Request events (such as PR creation and merge) are the main drivers of GitHub repository activity (Figure 1.7). Specifically:
- Issue comment events account for 29.1%, which is the largest component of active events, indicating that users are highly active in problem solving and improvement discussions.
- Pull Request events (including PR creation and merger) account for 46.4% of the total active events, highlighting GitHub’s core role in code collaboration and contribution.
Figure 1.7 shows the detailed composition of GitHub warehouse activity, further confirming the key position of Issue and PR events in promoting the development of open source projects.
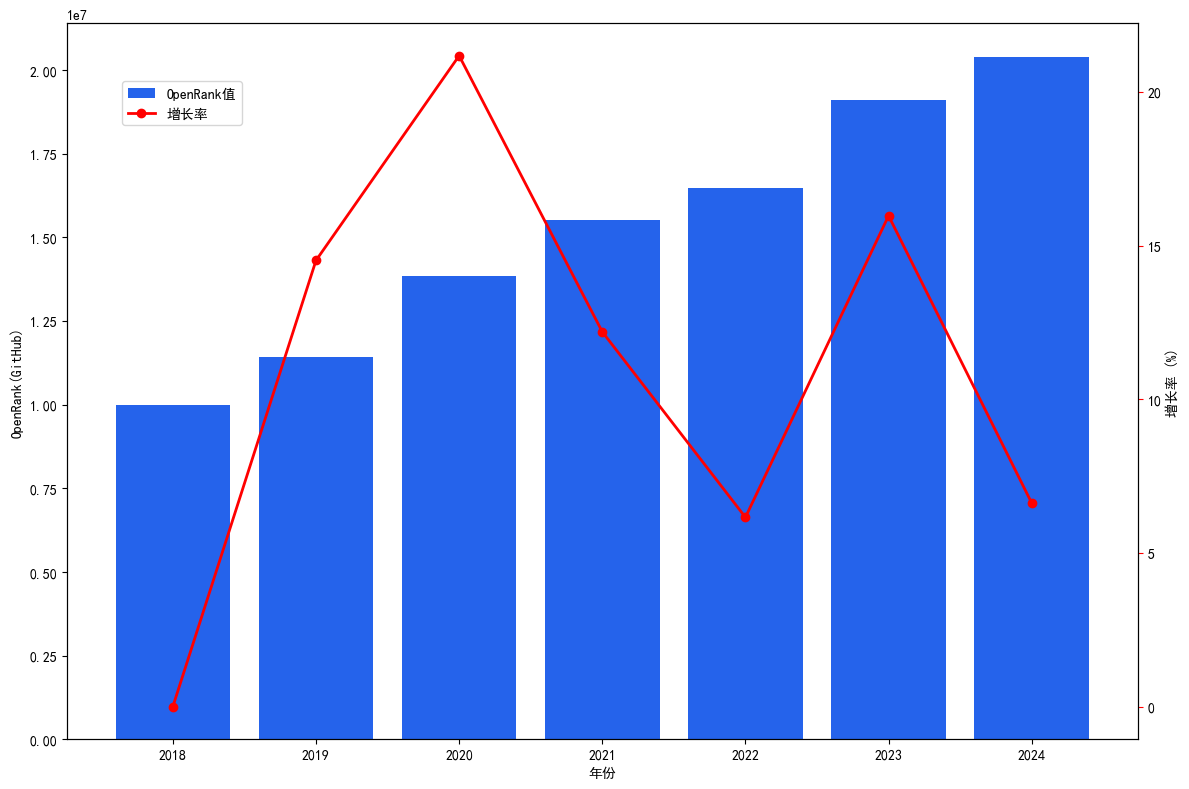
The OpenRank value of GitHub repository experienced a period of rapid growth from 2018 to 2020, and the growth rate reached its peak in 2020, reflecting the dual explosion of GitHub user expansion and open source project activity during this period. From 2021 to 2022, the growth rate gradually slowed down and entered a period of slowness. However, since 2023, the growth rate has rebounded. Although there has been a slight decline in 2024, the overall growth has remained stable, indicating the continued vitality and attractiveness of GitHub as the world's leading open source platform.
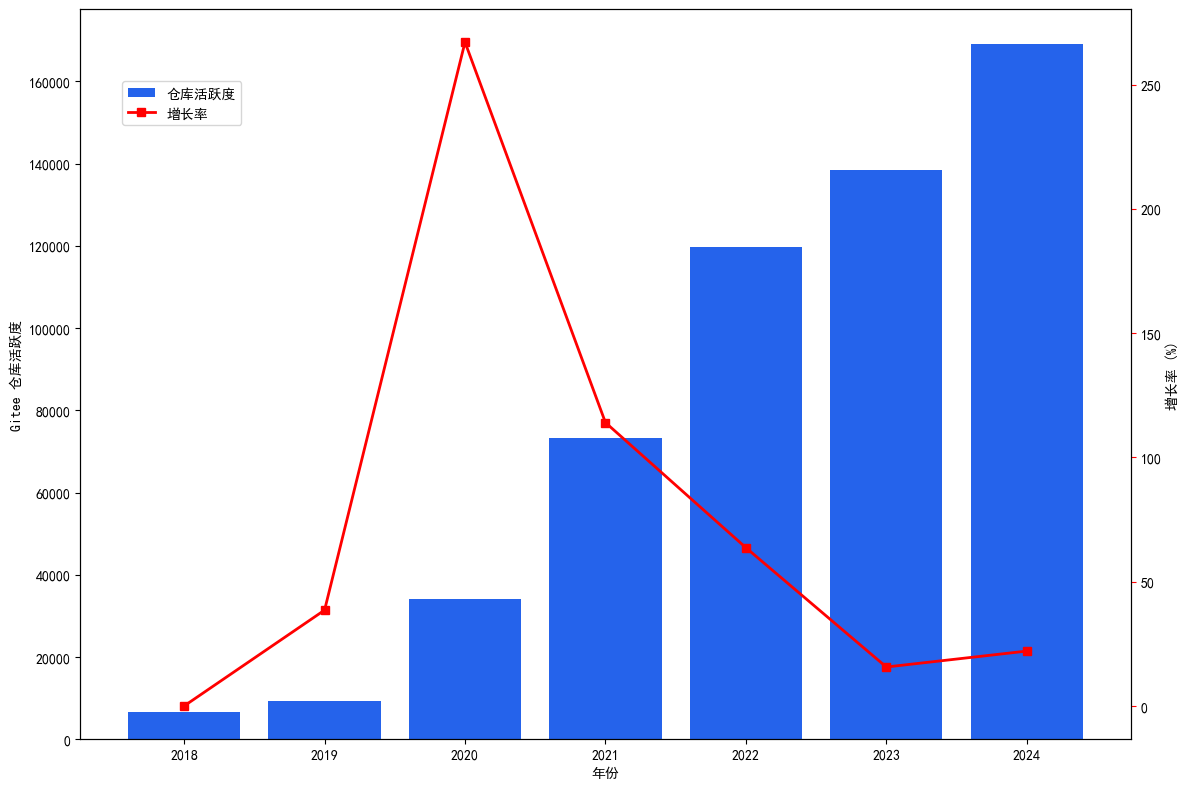
1.2.2 Gitee Active Repository Trends
Repository activity on Gitee grew rapidly from 2018 to 2020, reaching its peak in 2020, primarily benefiting from domestic open-source policy support and the establishment of the OpenAtom Open Source Foundation. After 2021, growth slowed down, but still reached a new peak in 2024 (Figure 1.9).
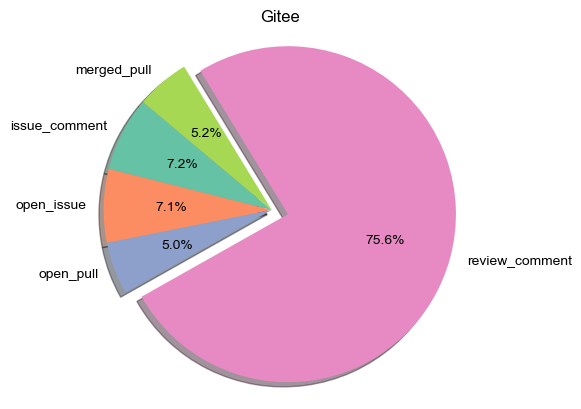
On the Gitee platform, Review Comment events dominate absolutely, accounting for 75.6% of total active events, far higher than other event types (such as Open Issue, Issue Comment, Merged Pull, etc., which account for about 7%; Open Pull events account for only 5%). This distribution indicates that Gitee developers focus more on the code review stage, while being slightly less active in code submission and issue discussion compared to GitHub, reflecting the platform users' high attention to code quality and the gradual maturation of standardized processes (Figure 1.10).
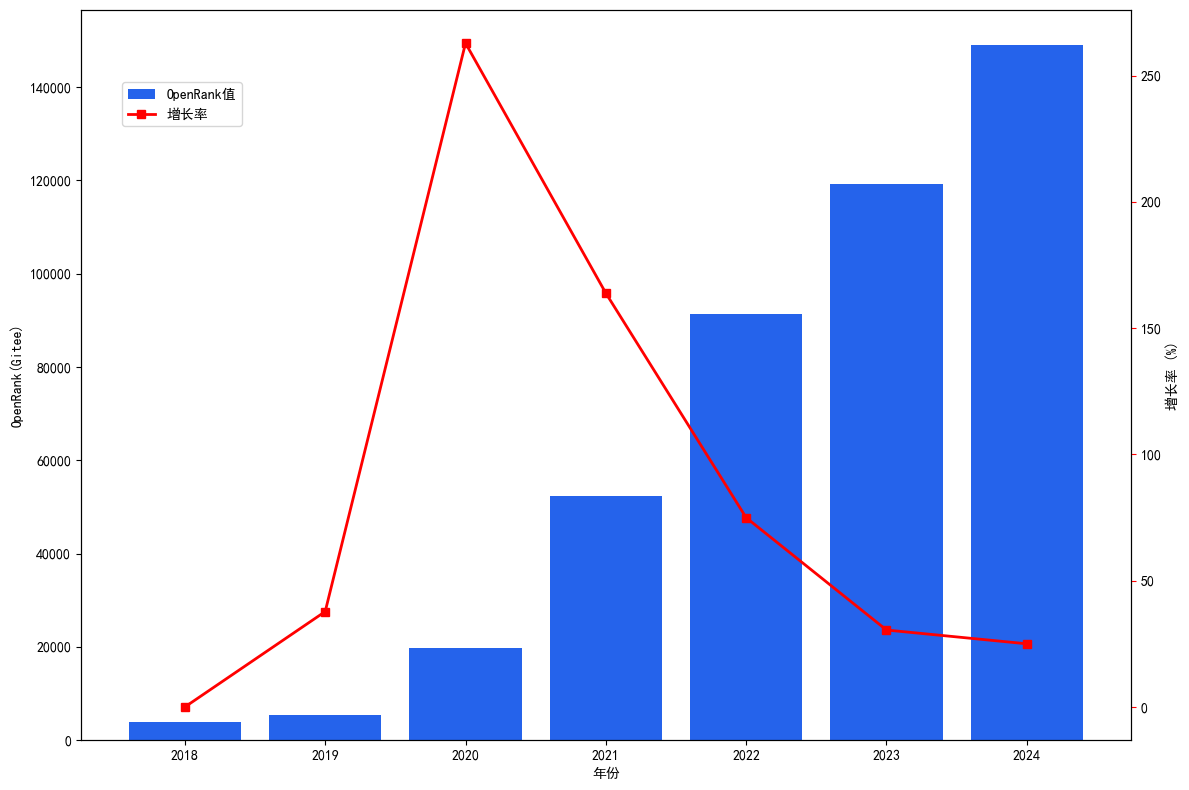
Gitee's OpenRank value achieved significant growth from 2018 to 2024, especially with a substantial increase between 2019-2020, mainly benefiting from domestic open-source ecosystem policy support and developers' active participation in the localized platform. Although the growth rate slowed down after 2021, Gitee's comprehensive activity still maintains a steady upward trend, confirming its continuously rising status among domestic open-source platforms, as well as sustained growth in community contributions and activity.
1.3 Active Developers
1.3.1 GitHub Overall Active User Trends
The analysis in 2024 continues previous research methodologies, based on richer and more refined data sources. This study covers a sample of 12 million active developers on GitHub, of which approximately 2.55 million developers provided accurate geographic location information, representing 2% of GitHub's total registered users (approximately 120 million). Although the sample represents only a small portion of all users, the improved data quality provides a more representative perspective for analyzing global developer geographic distribution and regional collaboration patterns.
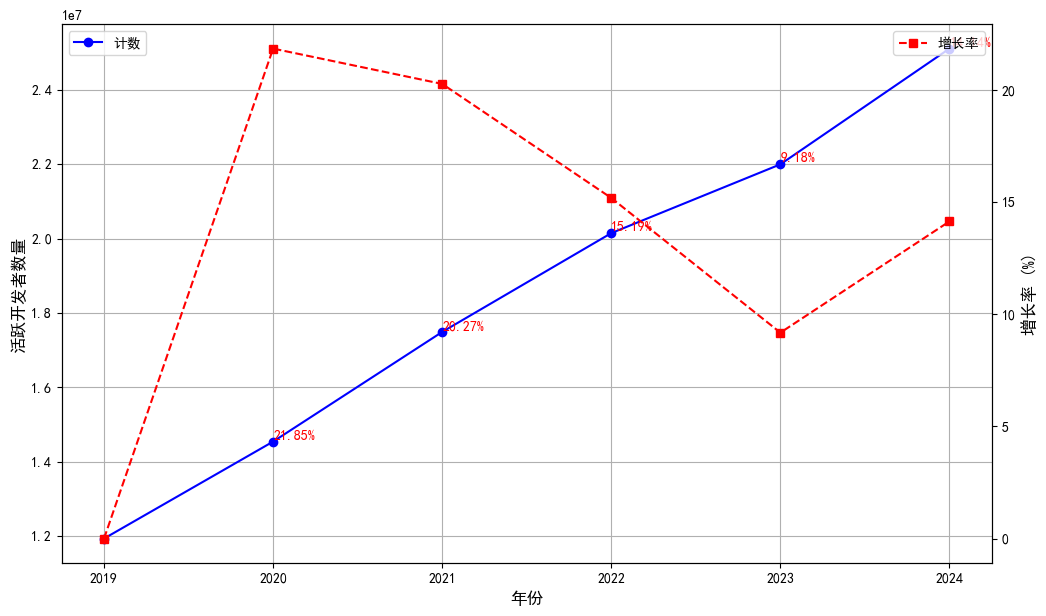
Figure 1.12 shows the growth trend of annual active developers on GitHub. The number of active developers has generally increased from 14.54 million in 2020 to 25.11 million in 2024. Specifically:
- 2019-2021: Rapid growth, mainly benefiting from the pandemic-driven transition to remote work and accelerated global digital transformation.
- 2022-2023: Growth rate slowed, possibly related to market maturation and base effect.
- 2024: Growth rate rebounded to 14.1%, with approximately 3.11 million new developers, reflecting the driving force of new technology waves (such as AI, Web3, etc.) on the developer ecosystem.
Compared to repository growth, developer growth is more stable, indicating that GitHub's user base continues to expand. Even during periods of slowed growth, a large number of new developers join each year. The rebound in 2024 further demonstrates GitHub's strong attraction as the world's leading open-source platform.
1.3.2 Geographical Distribution of Developers
1. Global Developer Geographic Distribution
According to statistics, the geographic distribution of global developers shows highly concentrated characteristics, with the top 10 countries accounting for 60% of the total global developers, as shown in the table below:
| Rank | Country | Total Number | Percentage | Developer Activity |
|---|---|---|---|---|
| 1 | United States | 435,202 | 17.11% | 4,301,051.55 |
| 2 | India | 252,054 | 9.91% | 1,099,659.73 |
| 3 | China | 184,085 | 7.23% | 1,097,116.82 |
| 4 | Brazil | 174,811 | 6.87% | 683,186.08 |
| 5 | Germany | 126,397 | 4.96% | 1,492,317.89 |
| 6 | United Kingdom | 103,061 | 4.05% | 1,140,839.73 |
| 7 | Canada | 82,627 | 3.24% | 821,240.65 |
| 8 | France | 78,288 | 3.07% | 833,038.24 |
| 9 | Russia | 60,735 | 2.38% | 310,555.47 |
| 10 | South Korea | 44,006 | 1.73% | 375,550.82 |
Key Observations:
- The United States leads by a wide margin with 435,000 developers (17.11%), and its activity level (4,301,051.55) also ranks first globally, demonstrating its absolute dominant position in the open-source ecosystem.
- India (9.91%) and China (7.23%) follow closely. Although China has fewer developers than India, the activity levels are almost equal, indicating high participation and contribution density of Chinese developers in open-source projects.
- Germany stands out - despite ranking fifth in developer numbers, its activity level (1,492,317.89) ranks second, indicating higher overall depth of participation among its developers.
- Although Brazil and Russia have relatively large numbers of developers, their per capita activity is relatively low, suggesting room for improvement in the quality of participation in the open-source ecosystem.
2. Chinese Developer Geographic Distribution
Further analysis of Chinese developers' distribution shows that the total number of Chinese developers is 9,404,966, with the Beijing-Shanghai-Guangzhou-Shenzhen region occupying the major share, demonstrating the strong attraction of economically developed regions to open-source technology.
| Rank | Province | Total Number | National Percentage | Actual Total (10,000) |
|---|---|---|---|---|
| 1 | Beijing | 38,323 | 22.04% | 207.20 |
| 2 | Shanghai | 28,393 | 16.43% | 154.86 |
| 3 | Guangdong | 24,959 | 14.49% | 136.28 |
| 4 | Taiwan | 15,894 | 9.53% | 89.62 |
| 5 | Zhejiang | 15,816 | 8.13% | 76.52 |
| 6 | Jiangsu | 9,369 | 4.90% | 46.10 |
| 7 | Sichuan | 8,186 | 4.69% | 44.03 |
| 8 | Hong Kong | 6,625 | 3.13% | 29.44 |
| 9 | Hubei | 5,732 | 2.95% | 27.75 |
| 10 | Shaanxi | 3,669 | 1.88% | 17.68 |
Key Observations:
- Beijing-Shanghai-Guangzhou dominance: Beijing (22.04%), Shanghai (16.43%), and Guangdong (14.49%) rank as the top three, collectively accounting for over 50%, reflecting the prominent position of these economic and technological centers in the open-source ecosystem. Beijing leads with 38,323 developers (2.072 million people), demonstrating its core advantages in technological innovation and talent concentration.
- Taiwan and Hong Kong: Taiwan (9.53%) and Hong Kong (3.13%) occupy important positions in the open-source ecosystem, with Taiwan attracting a large number of developers through its high-tech industry and open policy environment.
- Yangtze River Delta and Pearl River Delta advantage: The Yangtze River Delta (Shanghai, Zhejiang, Jiangsu) and Pearl River Delta (Guangdong) regions have more than 150,000 developers in total, showing the strong innovation capacity of economically developed regions in eastern coastal areas.
- Rise of central and western regions: Although Sichuan (4.69%), Hubei (2.95%), and Shaanxi (1.88%) have fewer developers than eastern regions, their overall growth is significant, indicating the gradual improvement and increasing attractiveness of the technological innovation ecosystem in central and western regions.
Summary and Perspectives:
- Global perspective: China's position in the global open-source ecosystem is increasingly important, with developer activity and contribution density approaching that of India, showing the rapid maturation of the open-source ecosystem. Countries like Germany and the UK have higher per capita activity levels, offering valuable lessons for China regarding deep participation models.
- Domestic distribution: Beijing, Shanghai, Guangzhou, Shenzhen, and coastal areas remain the core gathering places for Chinese open-source developers, but the technological ecosystems in central and western regions are rising, providing new momentum for the balanced development of China's future open-source ecosystem.
- Development recommendations:
- Strengthen support and resource allocation to developers in central and western regions to promote balanced regional development.
- Learn from the experiences of countries with high participation like Germany to improve developers' community participation and contribution depth.
- Cultivate more highly active, high-contributing developers through policy incentives and technical support to further strengthen China's competitiveness in the global open-source ecosystem.
1.4 Programming Language
1.4.1 2024 Developer Programming Language Rankings
The popularity of programming languages has always been a focus of developer attention. Below is the ranking of the most popular programming languages among developers in 2024:
| Rank | Programming Language | Number of Developers Using This Language | Number of Repositories Using This Language |
|---|---|---|---|
| 1 | JavaScript | 591,223 | 654,037 |
| 2 | Python | 540,751 | 499,644 |
| 3 | TypeScript | 439,954 | 462,496 |
| 4 | HTML | 424,901 | 401,084 |
| 5 | Java | 281,403 | 328,123 |
| 6 | C++ | 143,135 | 106,444 |
| 7 | CSS | 137,566 | 114,166 |
| 8 | C# | 131,549 | 163,796 |
| 9 | Go | 125,521 | 121,209 |
| 10 | Jupyter Notebook | 119,874 | 79,415 |
| 11 | PHP | 100,984 | 108,019 |
| 12 | Shell | 93,726 | 76,276 |
| 13 | C | 84,253 | 60,389 |
| 14 | Rust | 68,199 | 62,969 |
| 15 | Kotlin | 53,503 | 48,013 |
Key Observations:
- JavaScript continues to firmly hold the top position with 590,000 developers and 650,000 repositories. Its wide range of application scenarios and mature ecosystem are key factors in maintaining its lead.
- Python follows closely with 540,000 developers, benefiting from its widespread use in data science, artificial intelligence, and general programming.
- TypeScript ranks third, with the number of developers (439,900) exceeding HTML (424,900), showing its continuously rising status in frontend development.
- HTML and Java rank fourth and fifth, with 424,900 and 281,400 developers respectively. However, starting from the 6th-ranked C++, the number of developers decreases by nearly half, demonstrating a significant concentration effect among top programming languages.
- Languages ranked 6th to 15th (such as C++, Rust, Kotlin), though having smaller user bases, still have significant influence in specific domains (such as system development, mobile development, etc.).
Overall, the application domains of mainstream programming languages have basically solidified, with little change in rankings by number of users in recent years, indicating that developers' choices for these languages have high stability.
1.4.2 Developer Programming Language Usage Trends 2019-2024
Below is the statistical analysis of developer programming language usage trends from 2019 to 2024:
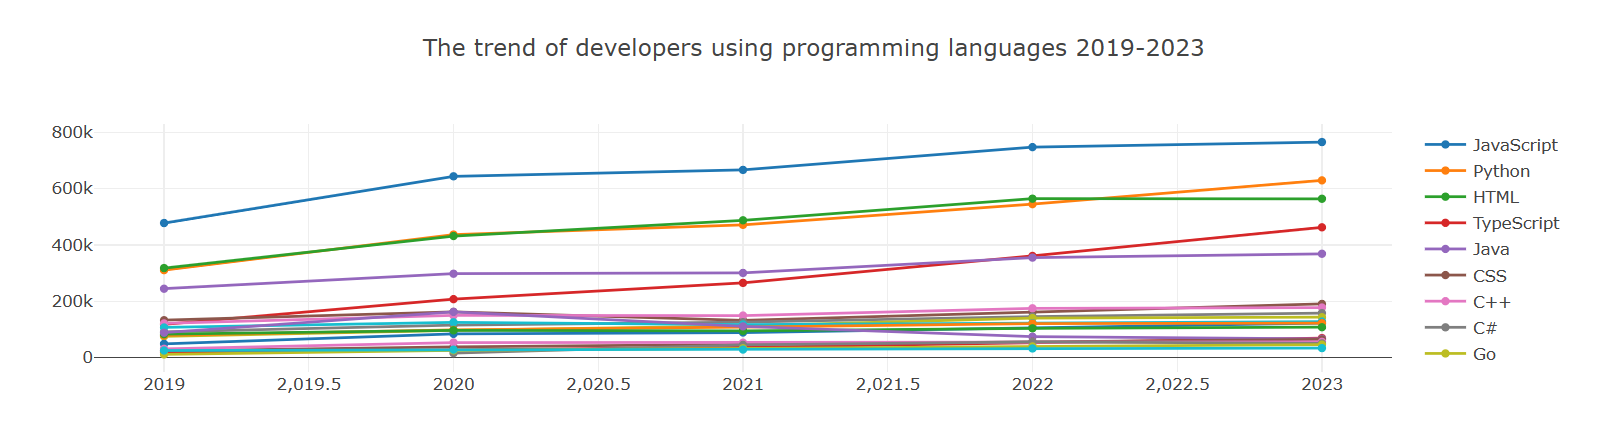
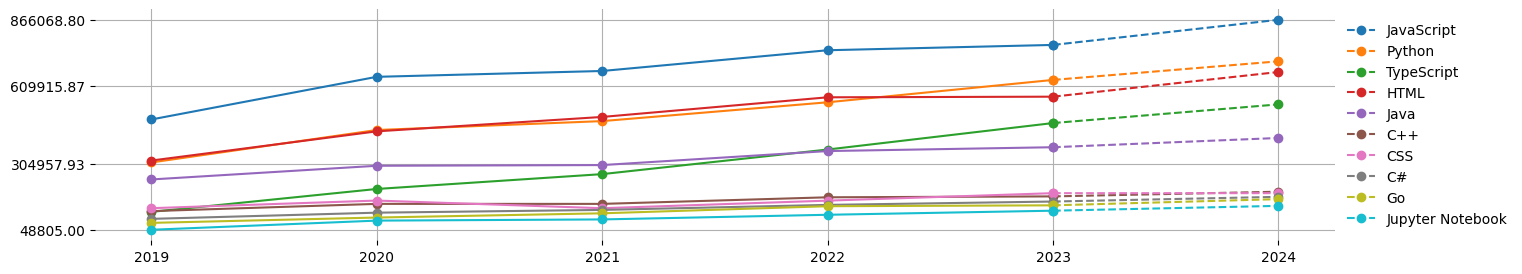
Data Notes: Due to the data source no longer providing repository metadata, the relevant data for October, November, and December 2024 is missing. Therefore, combining data from 2019-2023, a prediction model was used to estimate the data for 2024, with the dashed lines representing the prediction results.
Key Observations:
- JavaScript, Python, HTML, TypeScript, and Java are currently the main programming languages and have maintained leading positions for a long time.
- Rapid growth of HTML language: Predictions show that the growth rate of HTML will accelerate in 2024, significantly narrowing the gap with Python. This trend may be related to developers' emphasis on project aesthetics and convenience. HTML will continue to maintain an important position in frontend development and content display in the future.
- Continuous leap of TypeScript: Over the past 5 years, the number of TypeScript users has grown rapidly. By 2021, it had already created a clear gap with the programming languages ranked below it, becoming one of the core choices for developers. The 2024 prediction data shows that its developer usage will rank fourth. TypeScript's success is due to its introduction of static type checking based on JavaScript, strong community support, and adaptability to large projects.
- Steady growth of JavaScript and Python: Both consistently rank in the top two, with relatively stable growth curves, indicating their irreplaceability in general development.
1.5 Summary & Trending Insights
- The head effect is significant: JavaScript and Python have been firmly in the top two for a long time, and the rapid rise of TypeScript further consolidates its position in front-end development. At the same time, the growth of HTML also reflects developers' demand for more intuitive and easy-to-use technologies.
- Domain-driven trend: Although languages such as C++ and Rust have a small user base, their influence in specific fields such as system programming and high-performance computing cannot be ignored, and may continue to be key technologies in vertical fields in the future.
- Community and ecology have a clear role: TypeScript's success once again proves the importance of communities and ecosystems in programming language promotion. The combination of the technical advantages of the language itself, combined with a strong support system, can significantly drive its user growth.
- Development Suggestions:
- In view of the development trends of emerging programming languages (such as Rust and Kotlin), we actively improve supporting tools and ecology to attract more developers.
- Encourage developers to try more HTML and TypeScript in projects to improve front-end development efficiency and display effect.
- Support the deepening application of vertical programming languages (such as C++ and Go) in the industry and promote the implementation of innovative technologies.
2. OpenRank Rankings
In the open source field, rankings are not only an important tool to measure the influence and activity of projects, but also a window to showcase the global open source ecosystem dynamics. The 2024 China Open Source Annual Report passed the OpenRank rankings, presenting the activity and influence of key players in the open source community from a unique perspective, including projects, regions, enterprises, foundations and emerging projects. The report integrates the data of two major domestic and foreign platforms, GitHub and Gitee, covering China's open source ecosystem, and providing a global analysis. Through these rankings, we hope to further promote the popularization of open source culture and the application of open source technology, while encouraging enterprises and individuals to participate more actively in open source projects.
2.1 Ranking of Global Projects
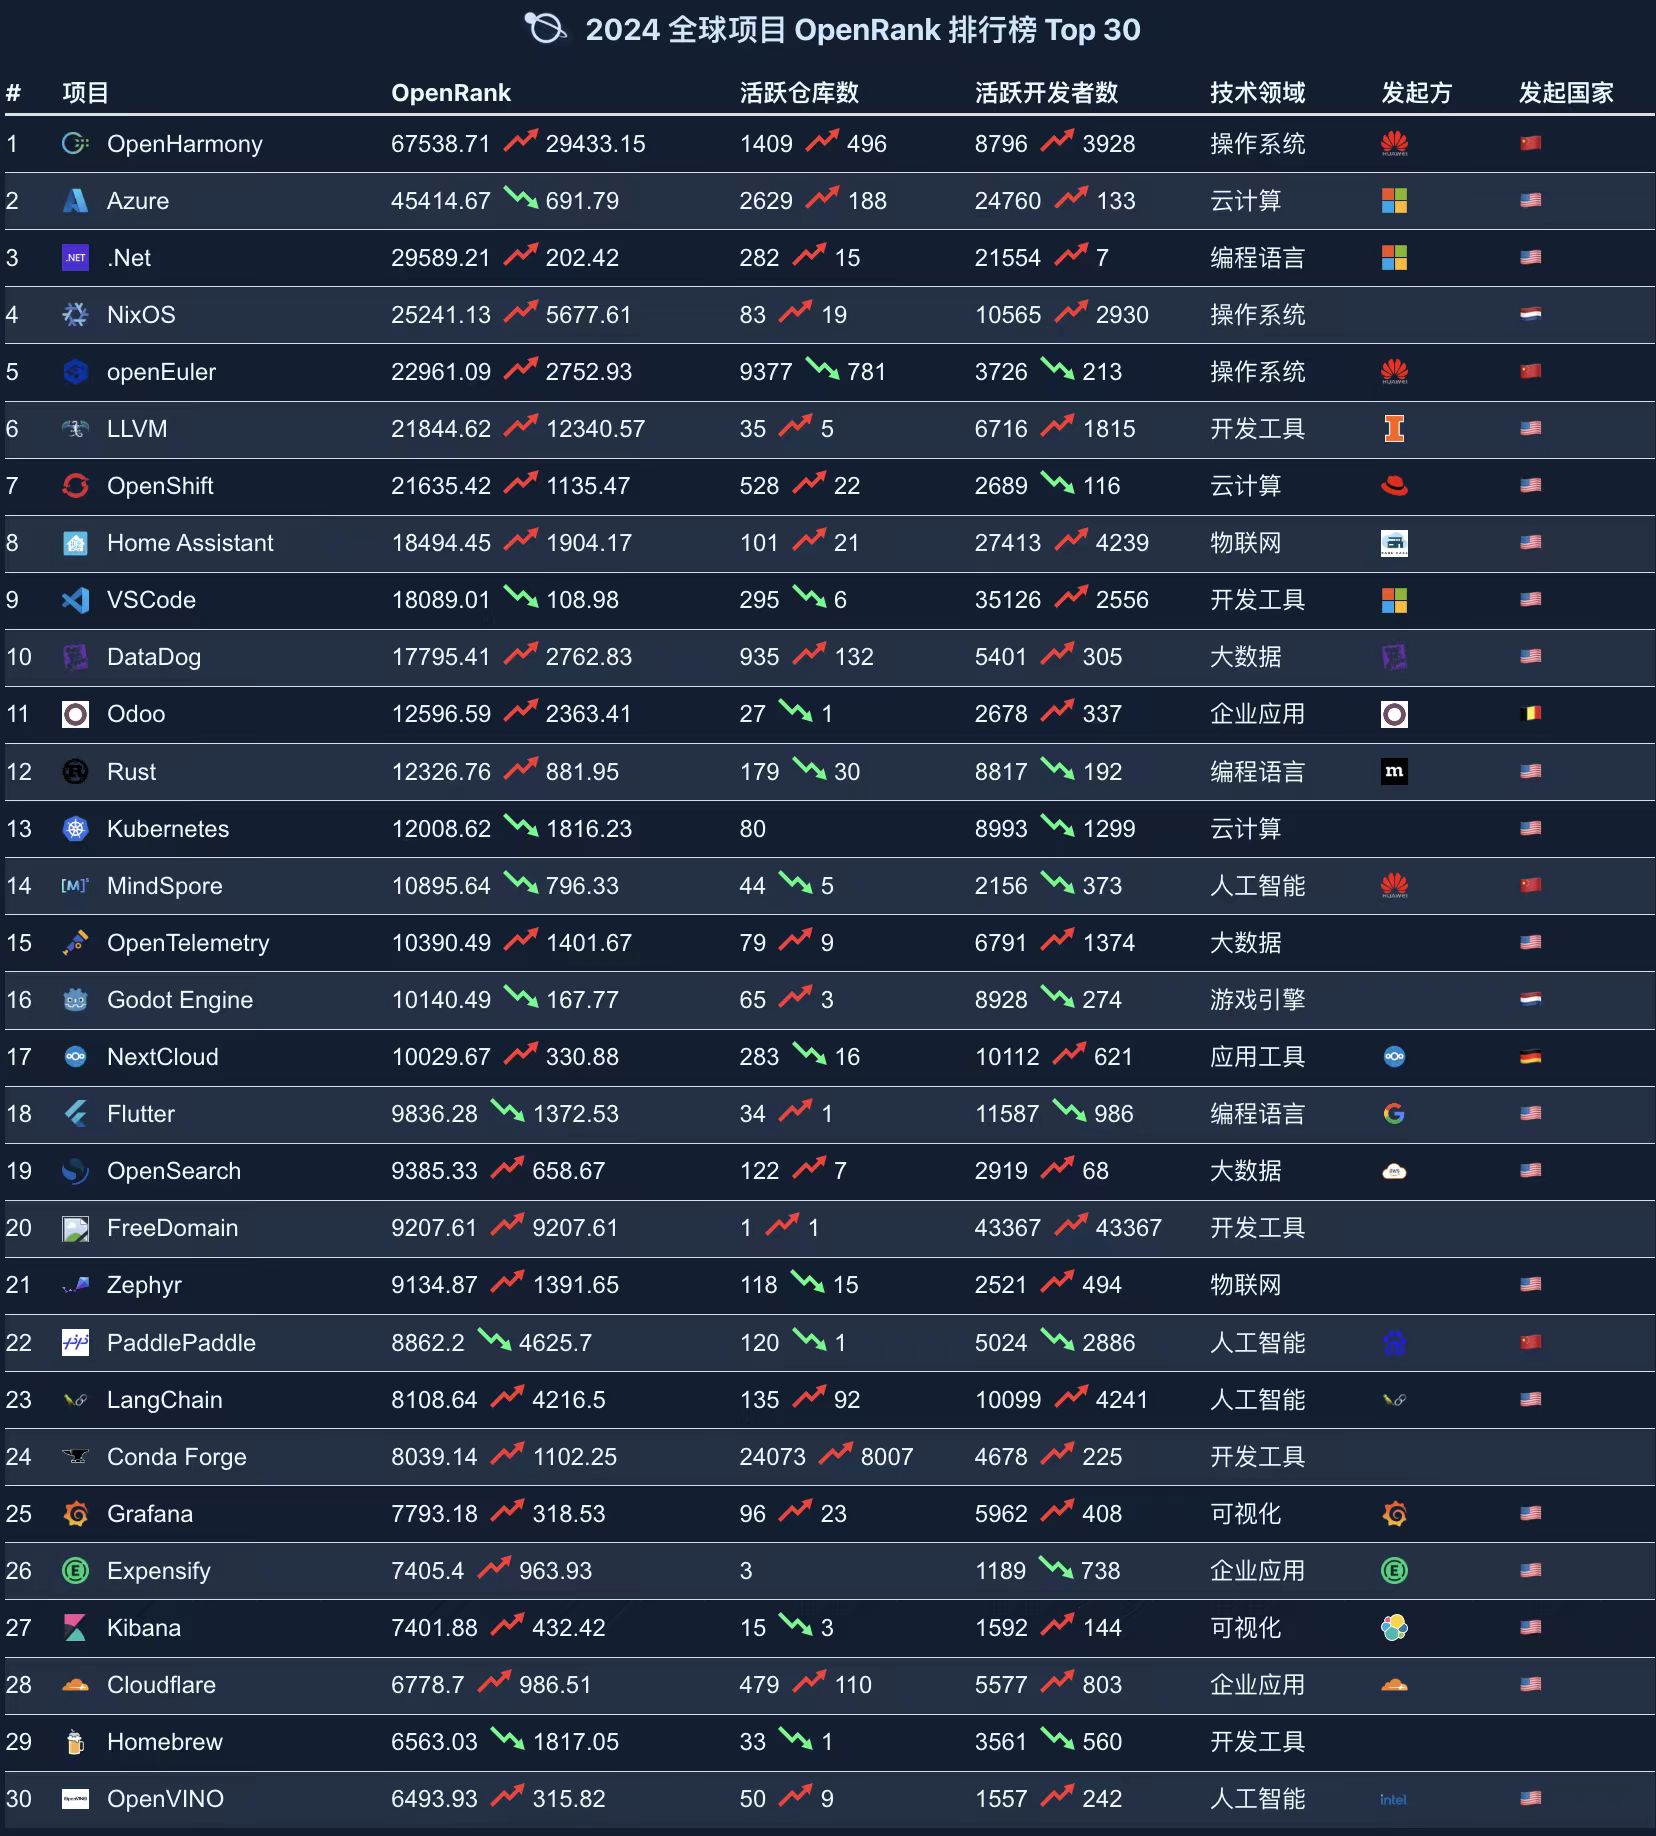
According to the 2024 Global Project OpenRank Rankings Top 30, the Chinese open-source project OpenHarmony ranks first with an OpenRank value of 67538.71, demonstrating its exceptional activity and global influence in the open-source community. Azure and .Net rank second and third respectively. Notably, the OpenRank scores of OpenHarmony and LLVM have grown significantly over the past year, indicating their enormous growth potential and community influence in specific technology domains or technology stacks.
Rankings Overview:
- Covers multiple domains, including Operating Systems, Cloud Computing, Programming Languages, Internet of Things, Big Data, Artificial Intelligence, Game Engines, and Visualization Tools.
- Demonstrates the breadth and diversity of open-source projects, while reflecting the key focus areas and trending directions in the technology field.
2.2 Ranking of China Projects
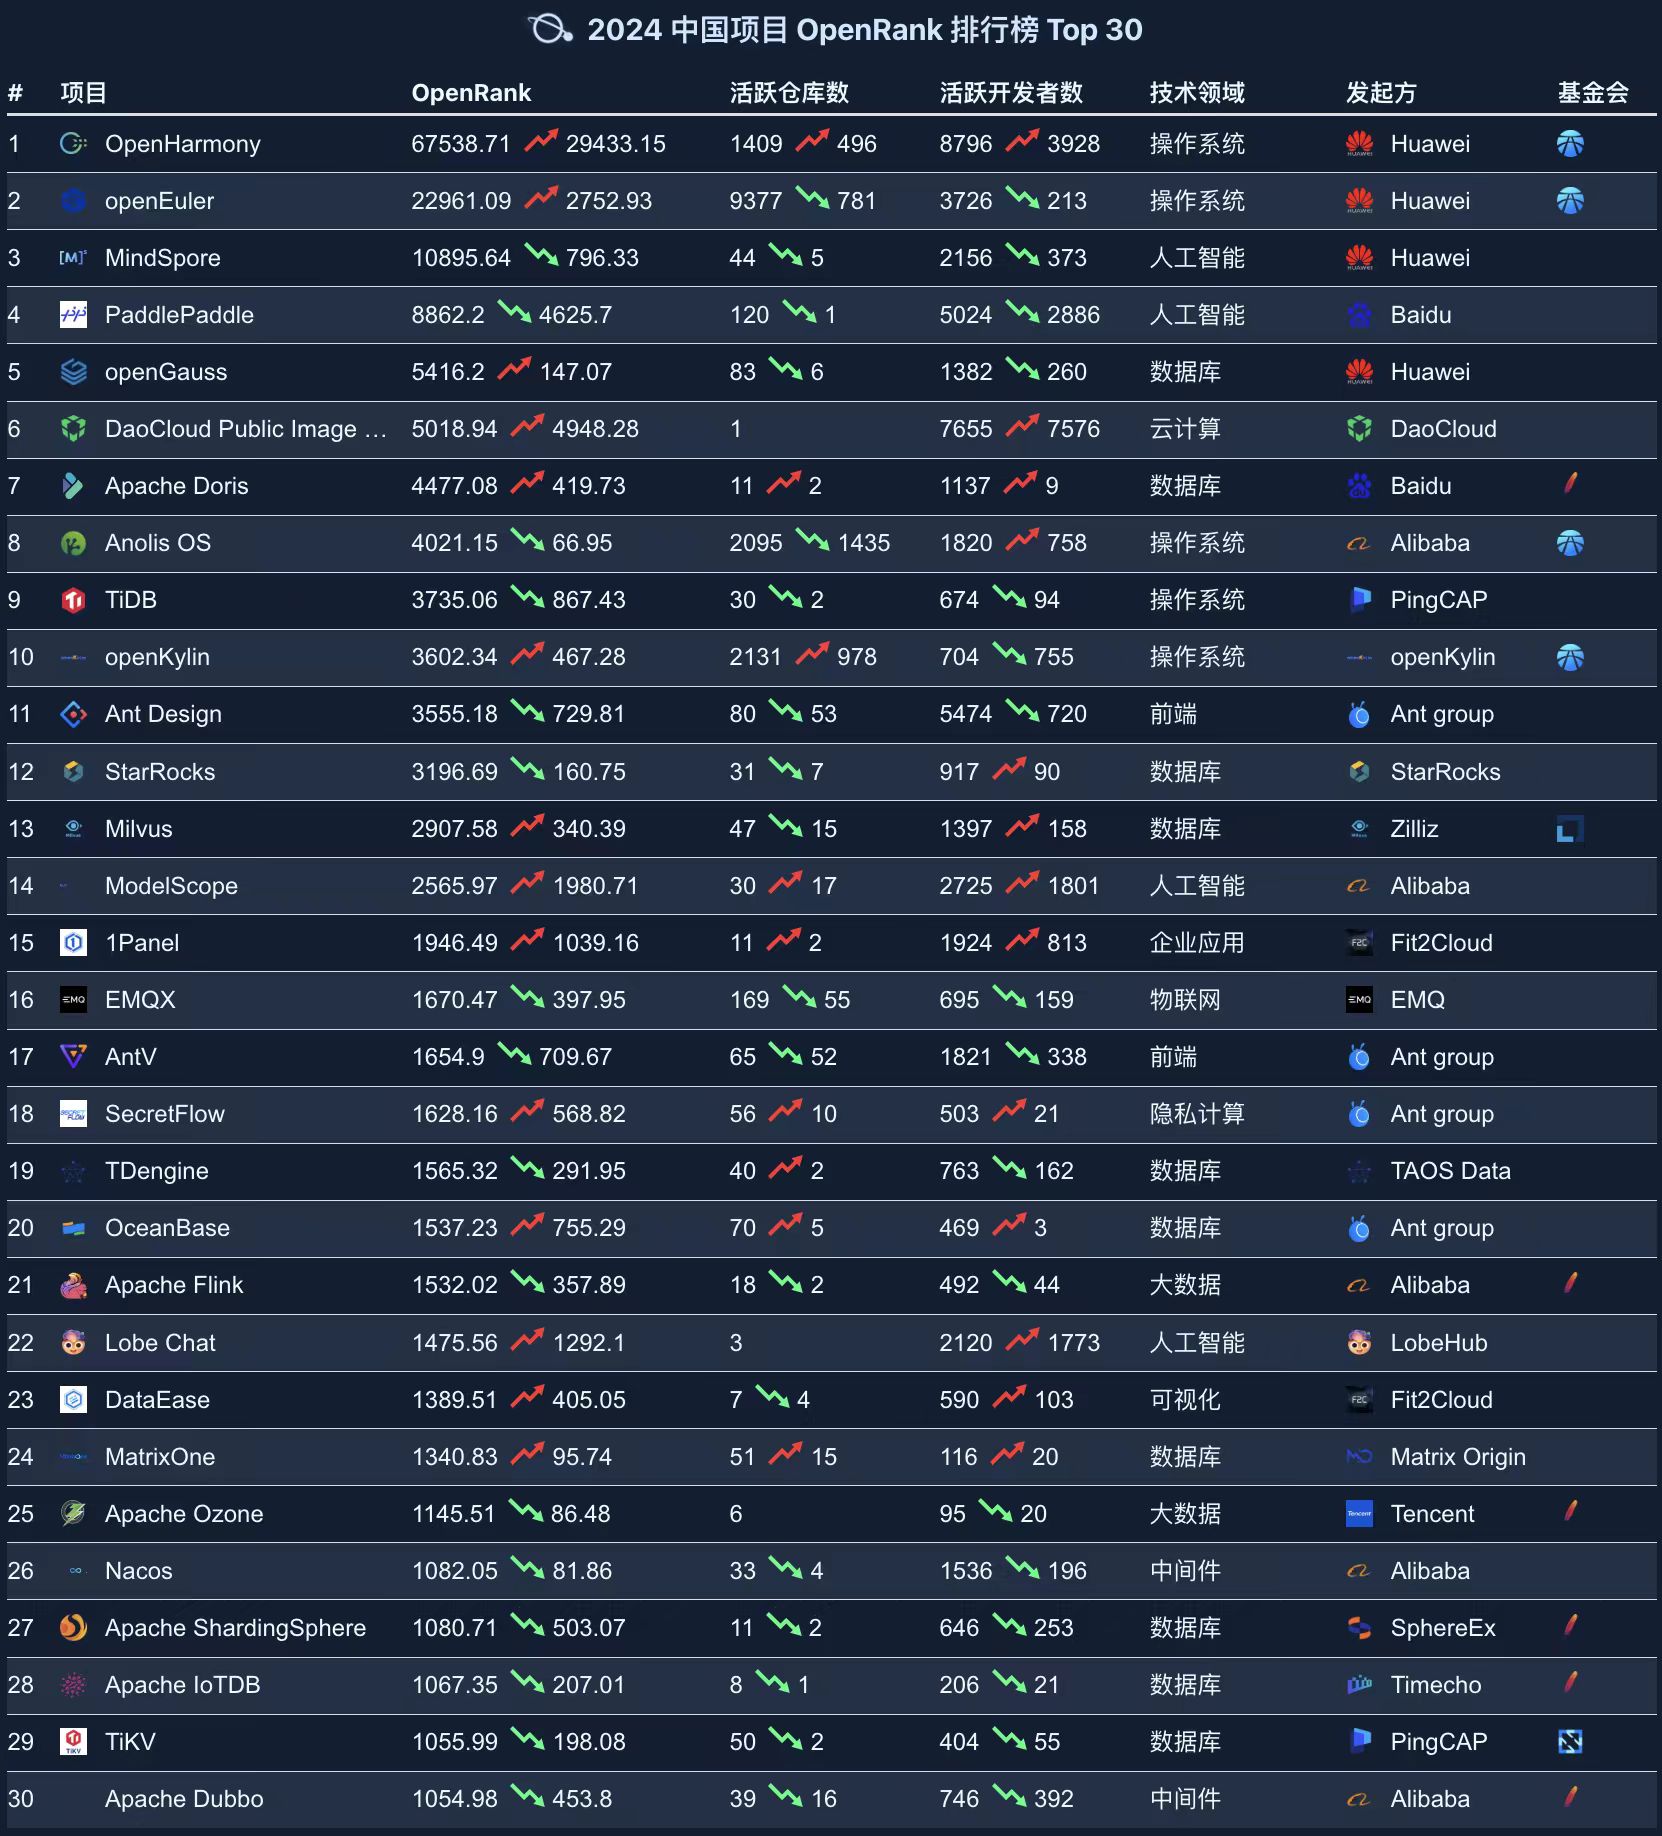
The 2024 China Project OpenRank Rankings cover multiple technology domains, including Operating Systems (such as OpenHarmony), Artificial Intelligence (such as MindSpore), Databases (such as openGauss, TiDB), and Big Data Processing (such as Apache Flink). This indicates that the diversity and technical strength of Chinese open-source projects continue to grow.
Key Observations:
- Huawei occupies multiple positions in the rankings (such as OpenHarmony, openEuler), demonstrating its leading position and outstanding contribution in the Chinese open-source community.
- Artificial intelligence projects show impressive performance: MindSpore and PaddlePaddle rank third and fourth respectively, reflecting China's rapid development in the AI field.
- Rise of privacy computing projects: SecretFlow makes the list as a representative in the privacy computing field, indicating that emerging technology domains are gaining widespread attention.
2.3 Ranking of Global Compies
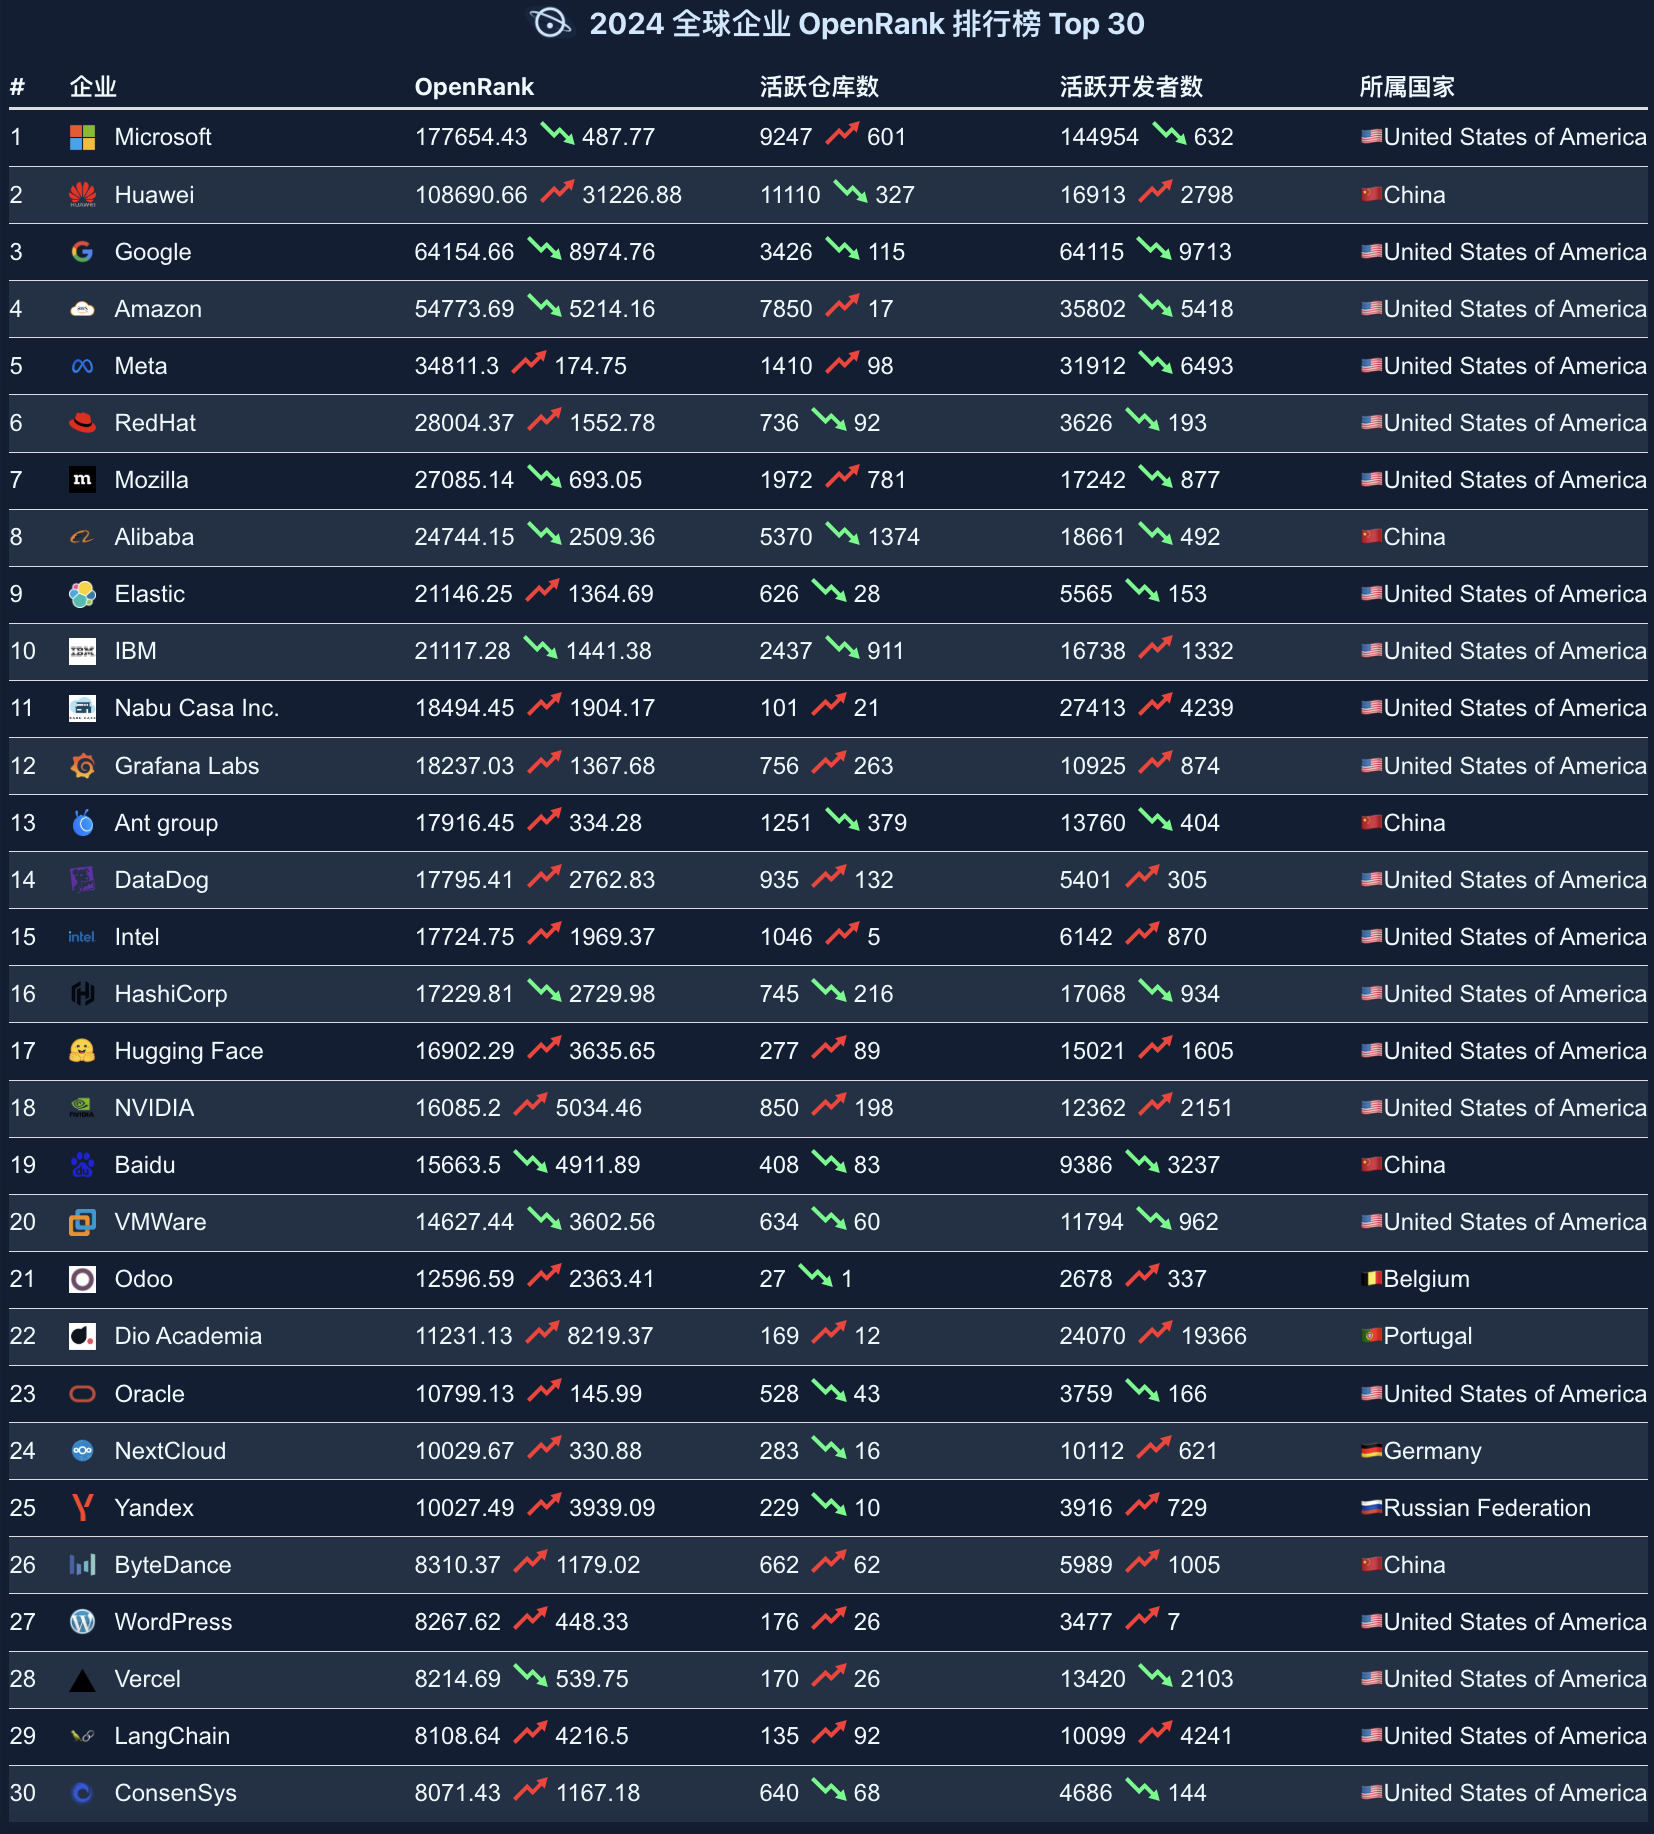
The Global Enterprise OpenRank Rankings showcase the international and global characteristics of open-source projects, with American enterprises maintaining an absolute dominant position. Tech giants such as Microsoft, Google, and Amazon lead by a significant margin in OpenRank scores, demonstrating their leadership in the global open-source field.
Highlights:
- Rise of Chinese enterprises: Huawei and Alibaba rank second and eighth respectively, reflecting the continuously strengthening influence of Chinese enterprises in the global open-source ecosystem.
- Emergence of new enterprises: Emerging companies such as HashiCorp, Hugging Face, Vercel, and LangChain have also entered the rankings, indicating that innovation vitality in the open-source field continues to be released.
2.4 Chinese Enterprise Rankings
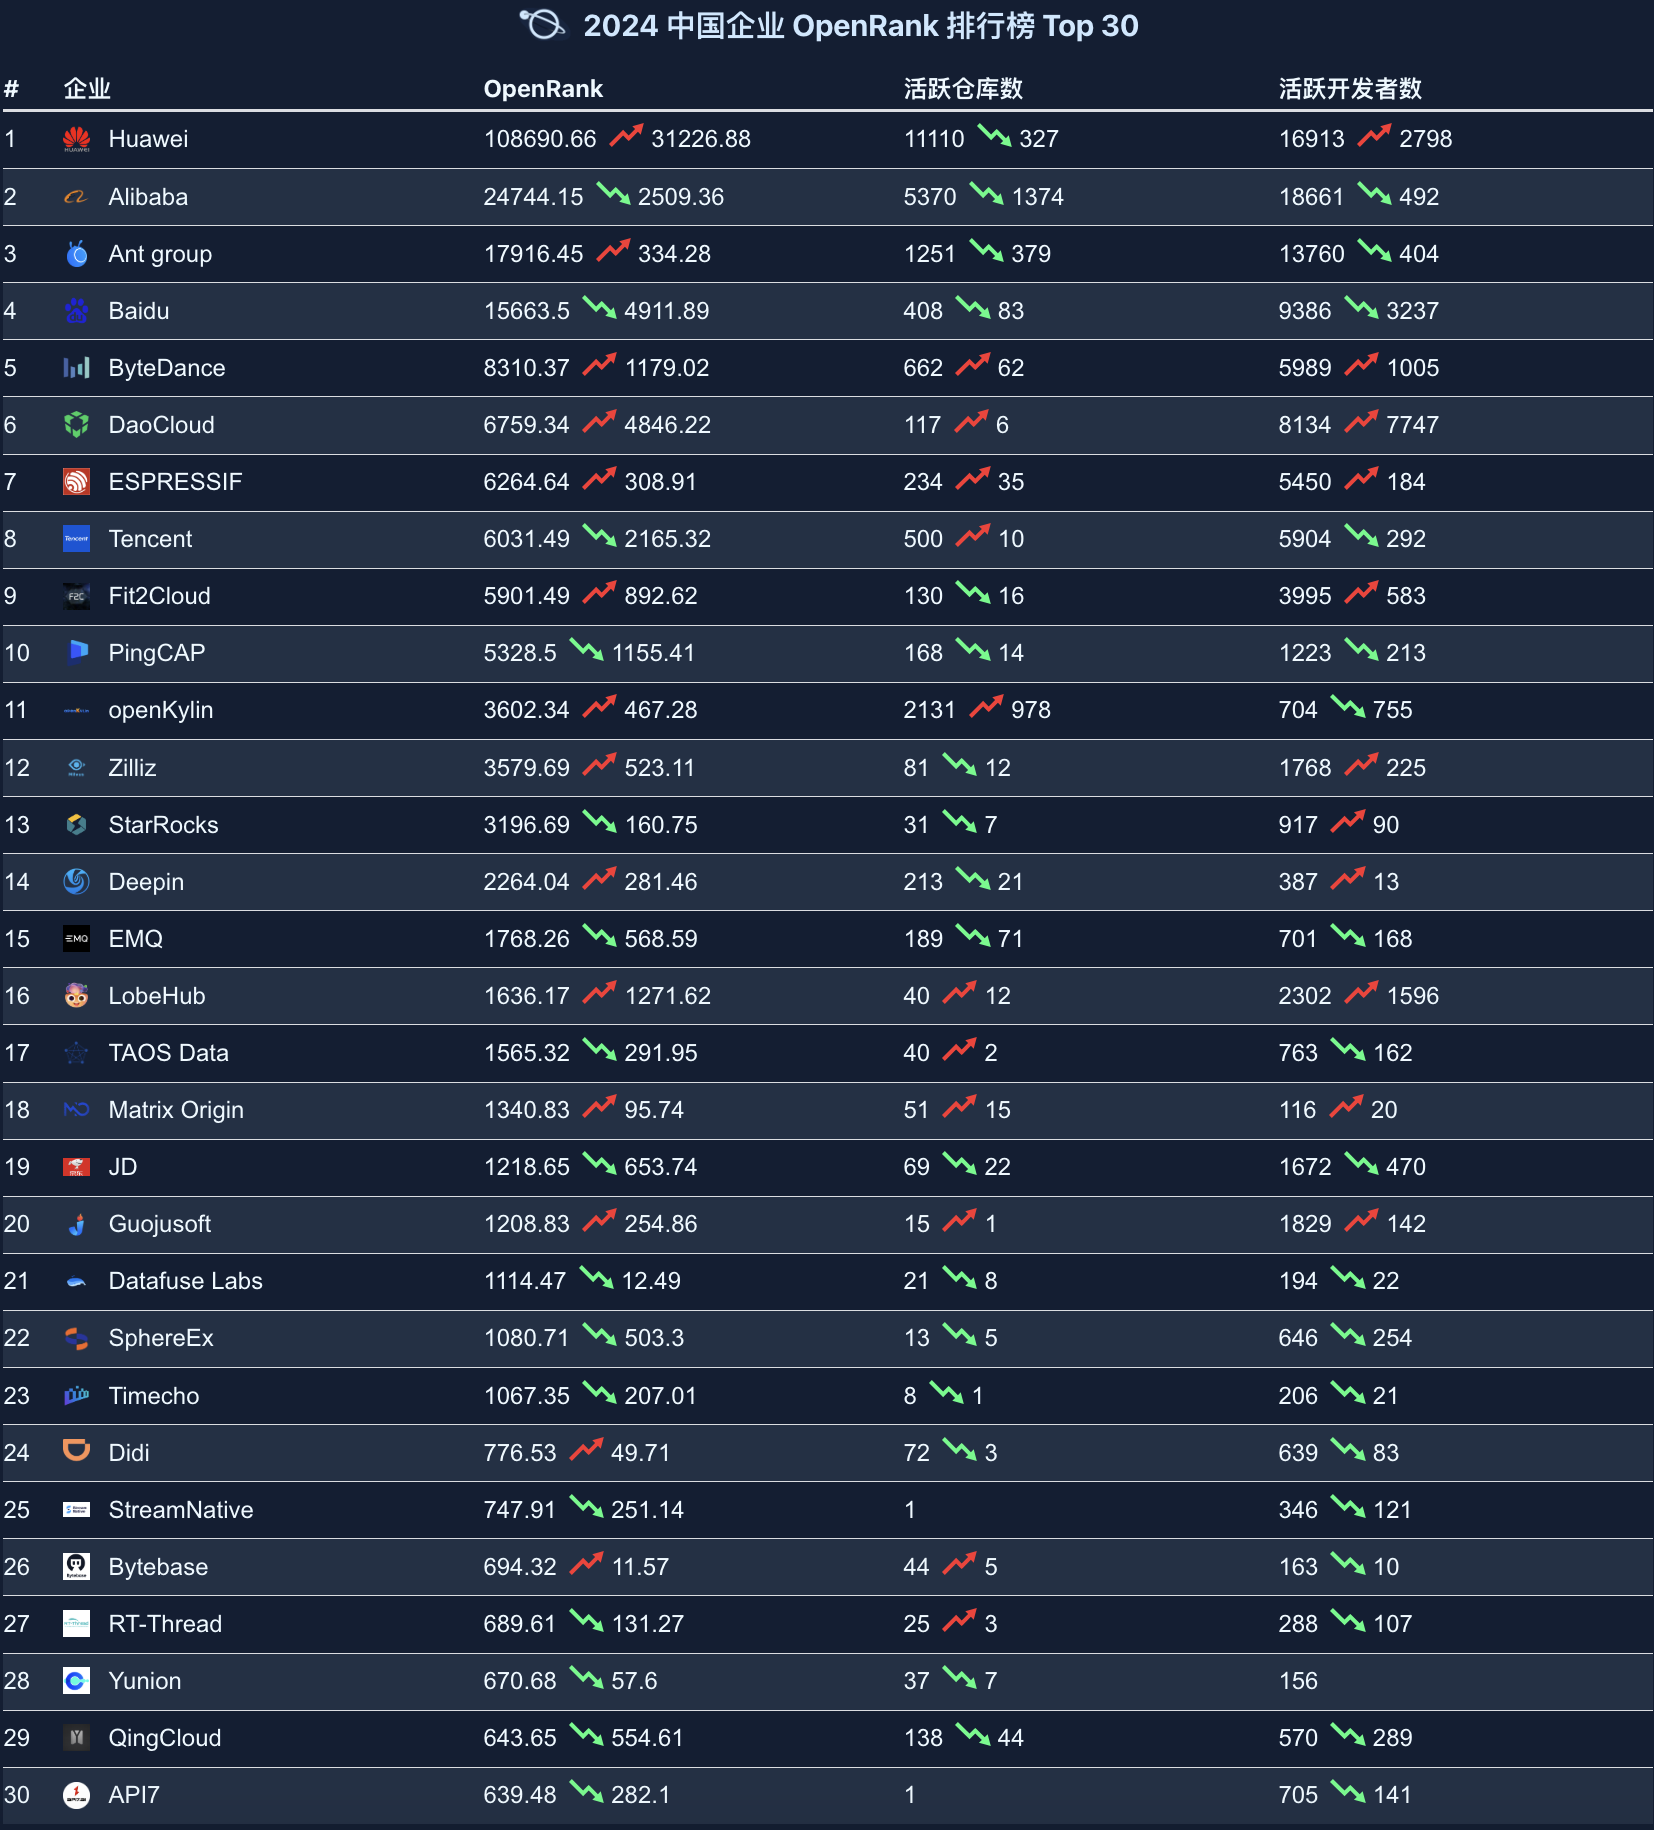
The 2024 Chinese Enterprise OpenRank Rankings are dominated by large enterprises, demonstrating the important role of Chinese companies in driving the development of the open-source ecosystem.
Key Observations:
- Huawei, Alibaba, Ant Group, Baidu, and other companies top the list, showcasing their positions as core driving forces in the open-source ecosystem.
- Companies like Tencent, Baidu, and Alibaba not only perform remarkably domestically but also have significant influence in global open-source projects.
2.5 Ranking of Open Source Foundations
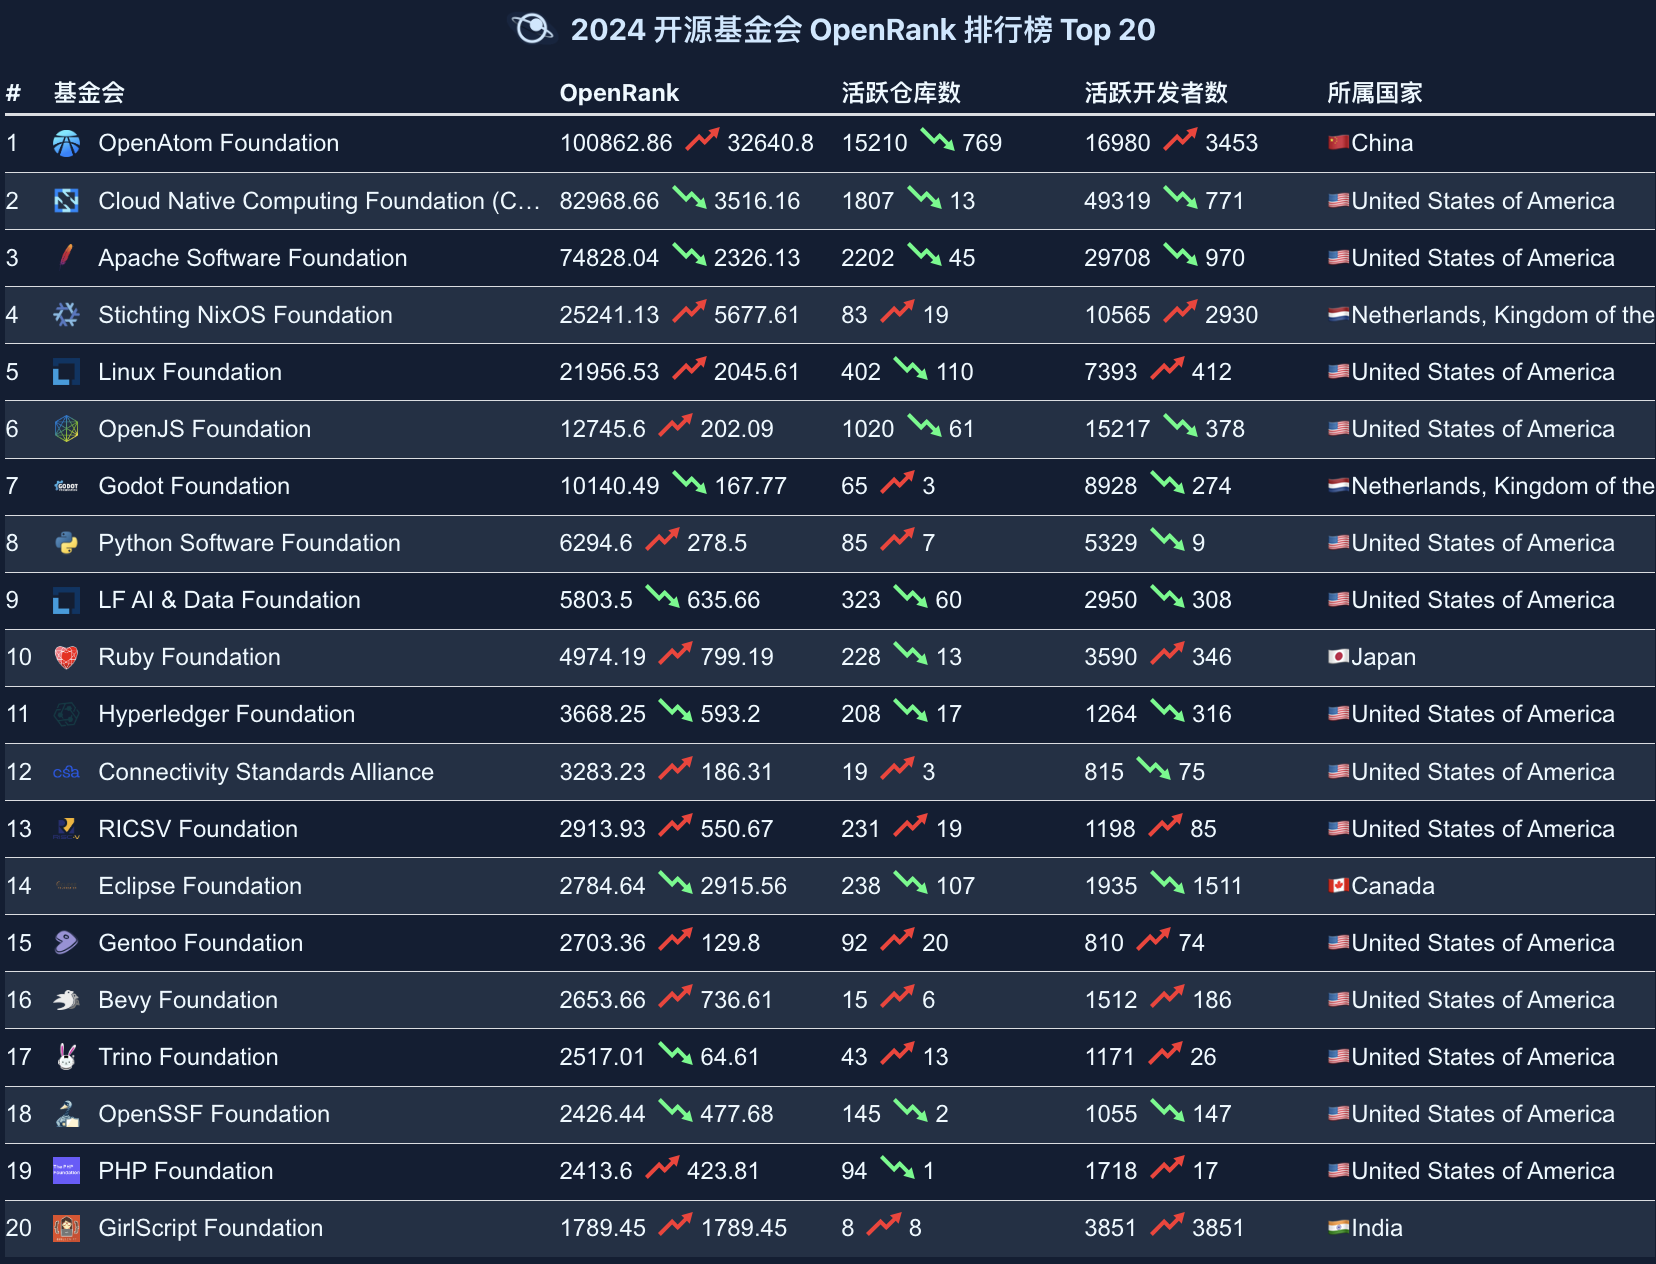
In the 2024 Open Source Foundation OpenRank Rankings, the OpenAtom Foundation ranks first, indicating that China has achieved important accomplishments in promoting large open-source projects.
Highlights:
- Several high-ranking American foundations (such as the Cloud Native Computing Foundation, Apache Software Foundation, and Linux Foundation) continue to maintain strong influence.
- The Netherlands' Stichting NixOS Foundation and Godot Foundation rank fourth and seventh respectively, demonstrating European participation and contribution in open-source projects.
2.6 Global Developer Rankings by Region
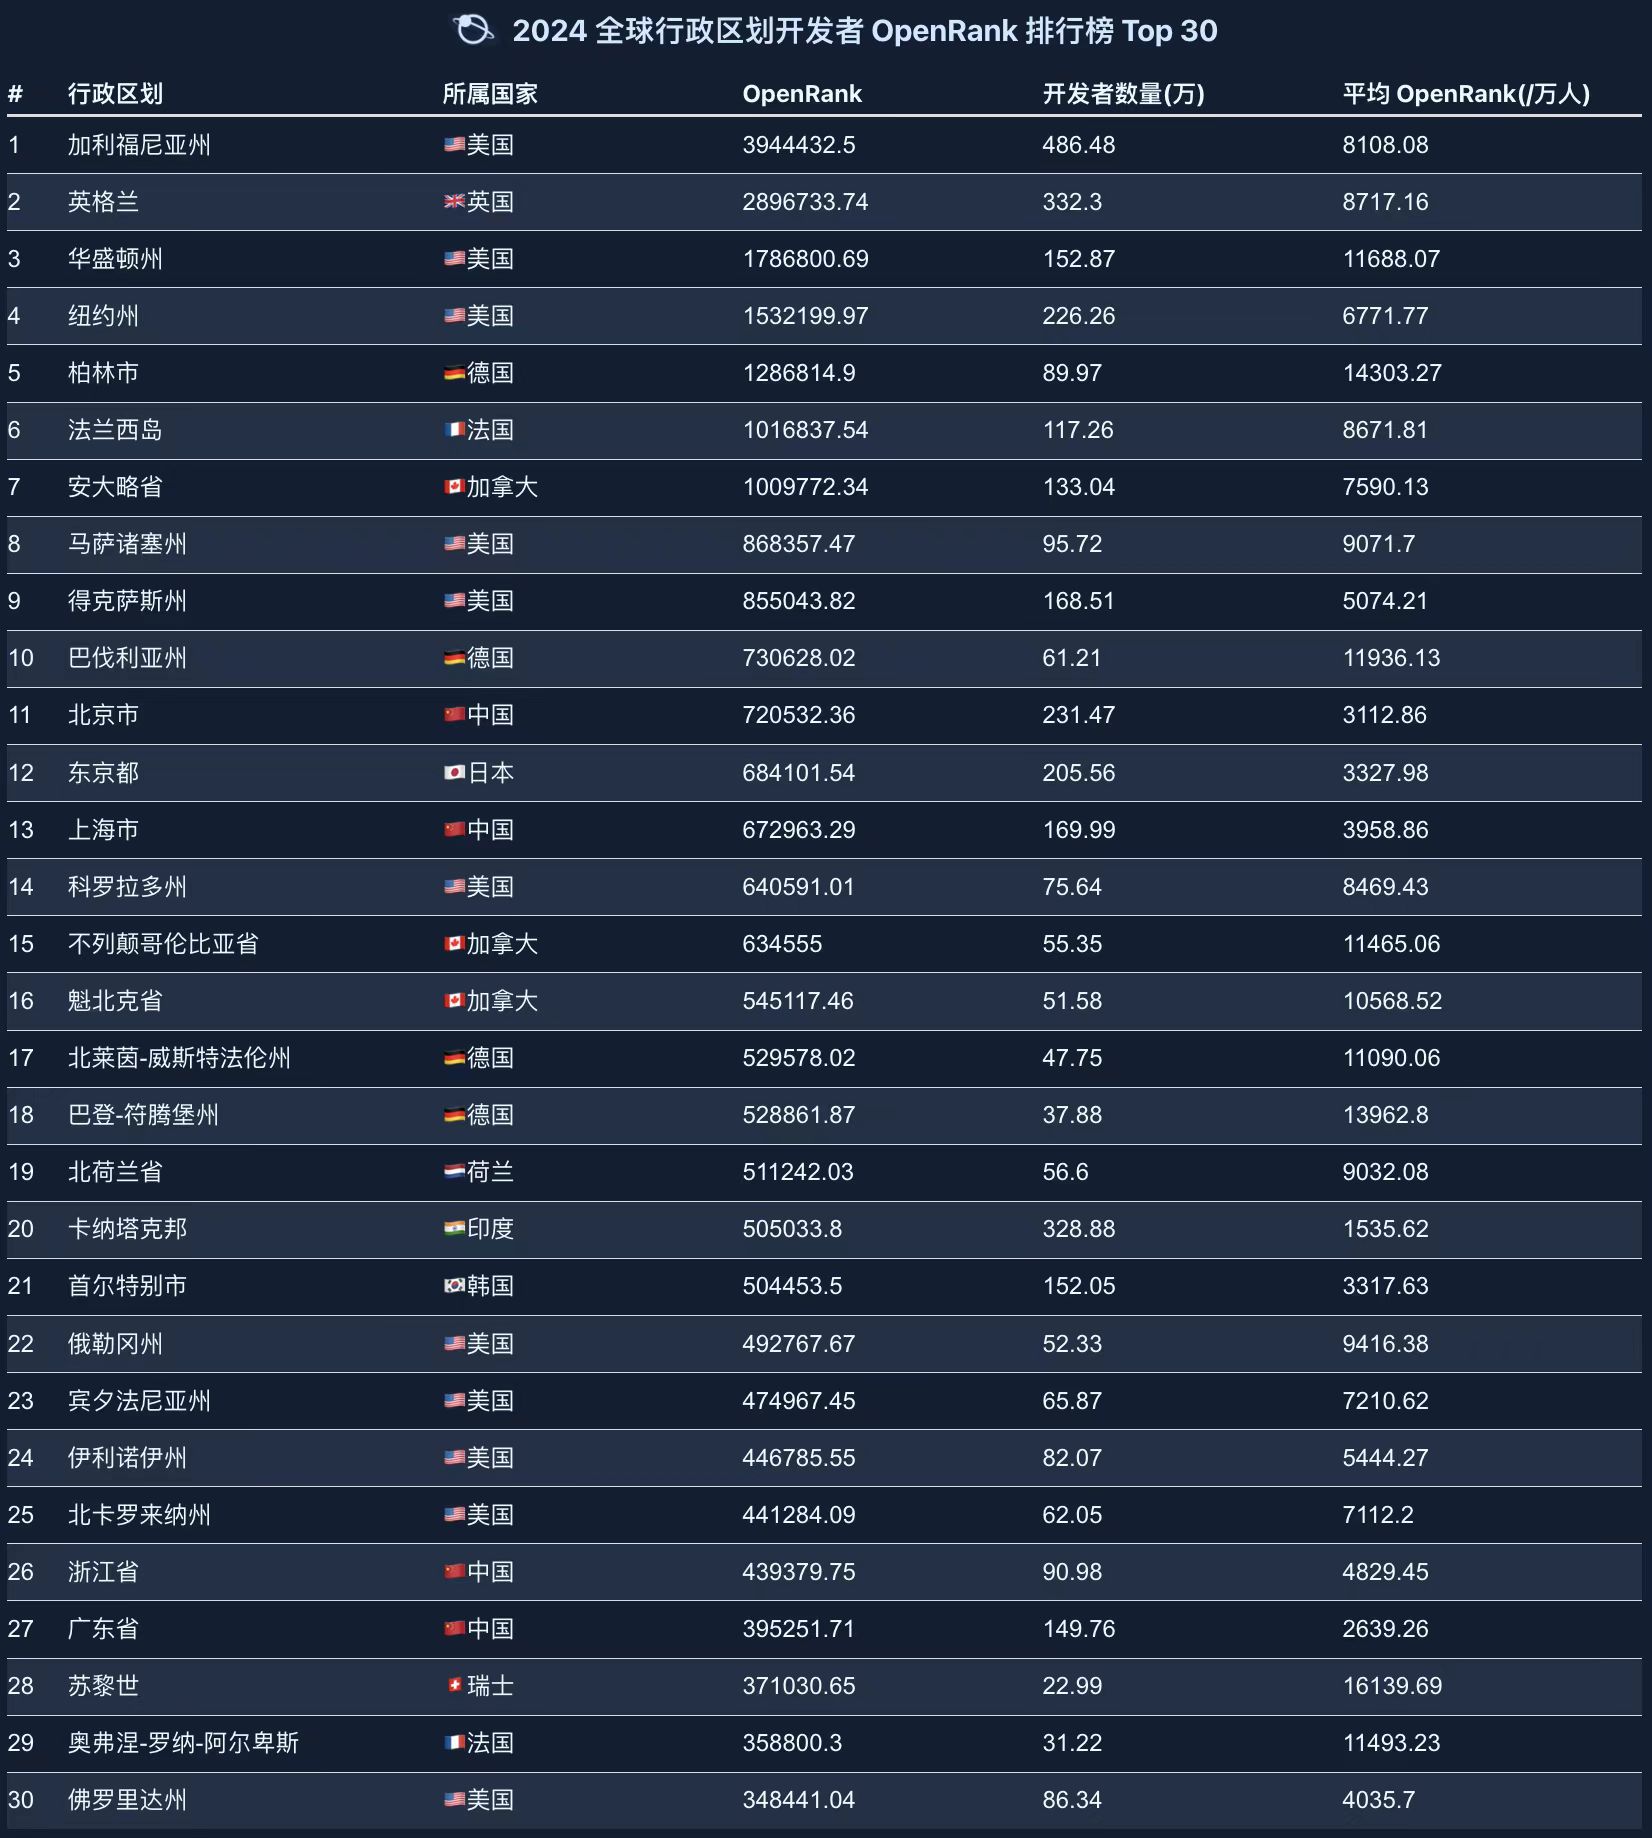
The Global Administrative Division Rankings show that economically developed regions have higher levels of open-source development activity. Key Observations:
- United States dominance: Regions such as California (Silicon Valley), Washington State (headquarters of Microsoft and Amazon), and New York State are centers of global open-source activity.
- Cities in China such as Beijing and Shanghai also perform strongly, further consolidating their positions in the global open-source ecosystem.
2.7 China Developer Ranking by Region
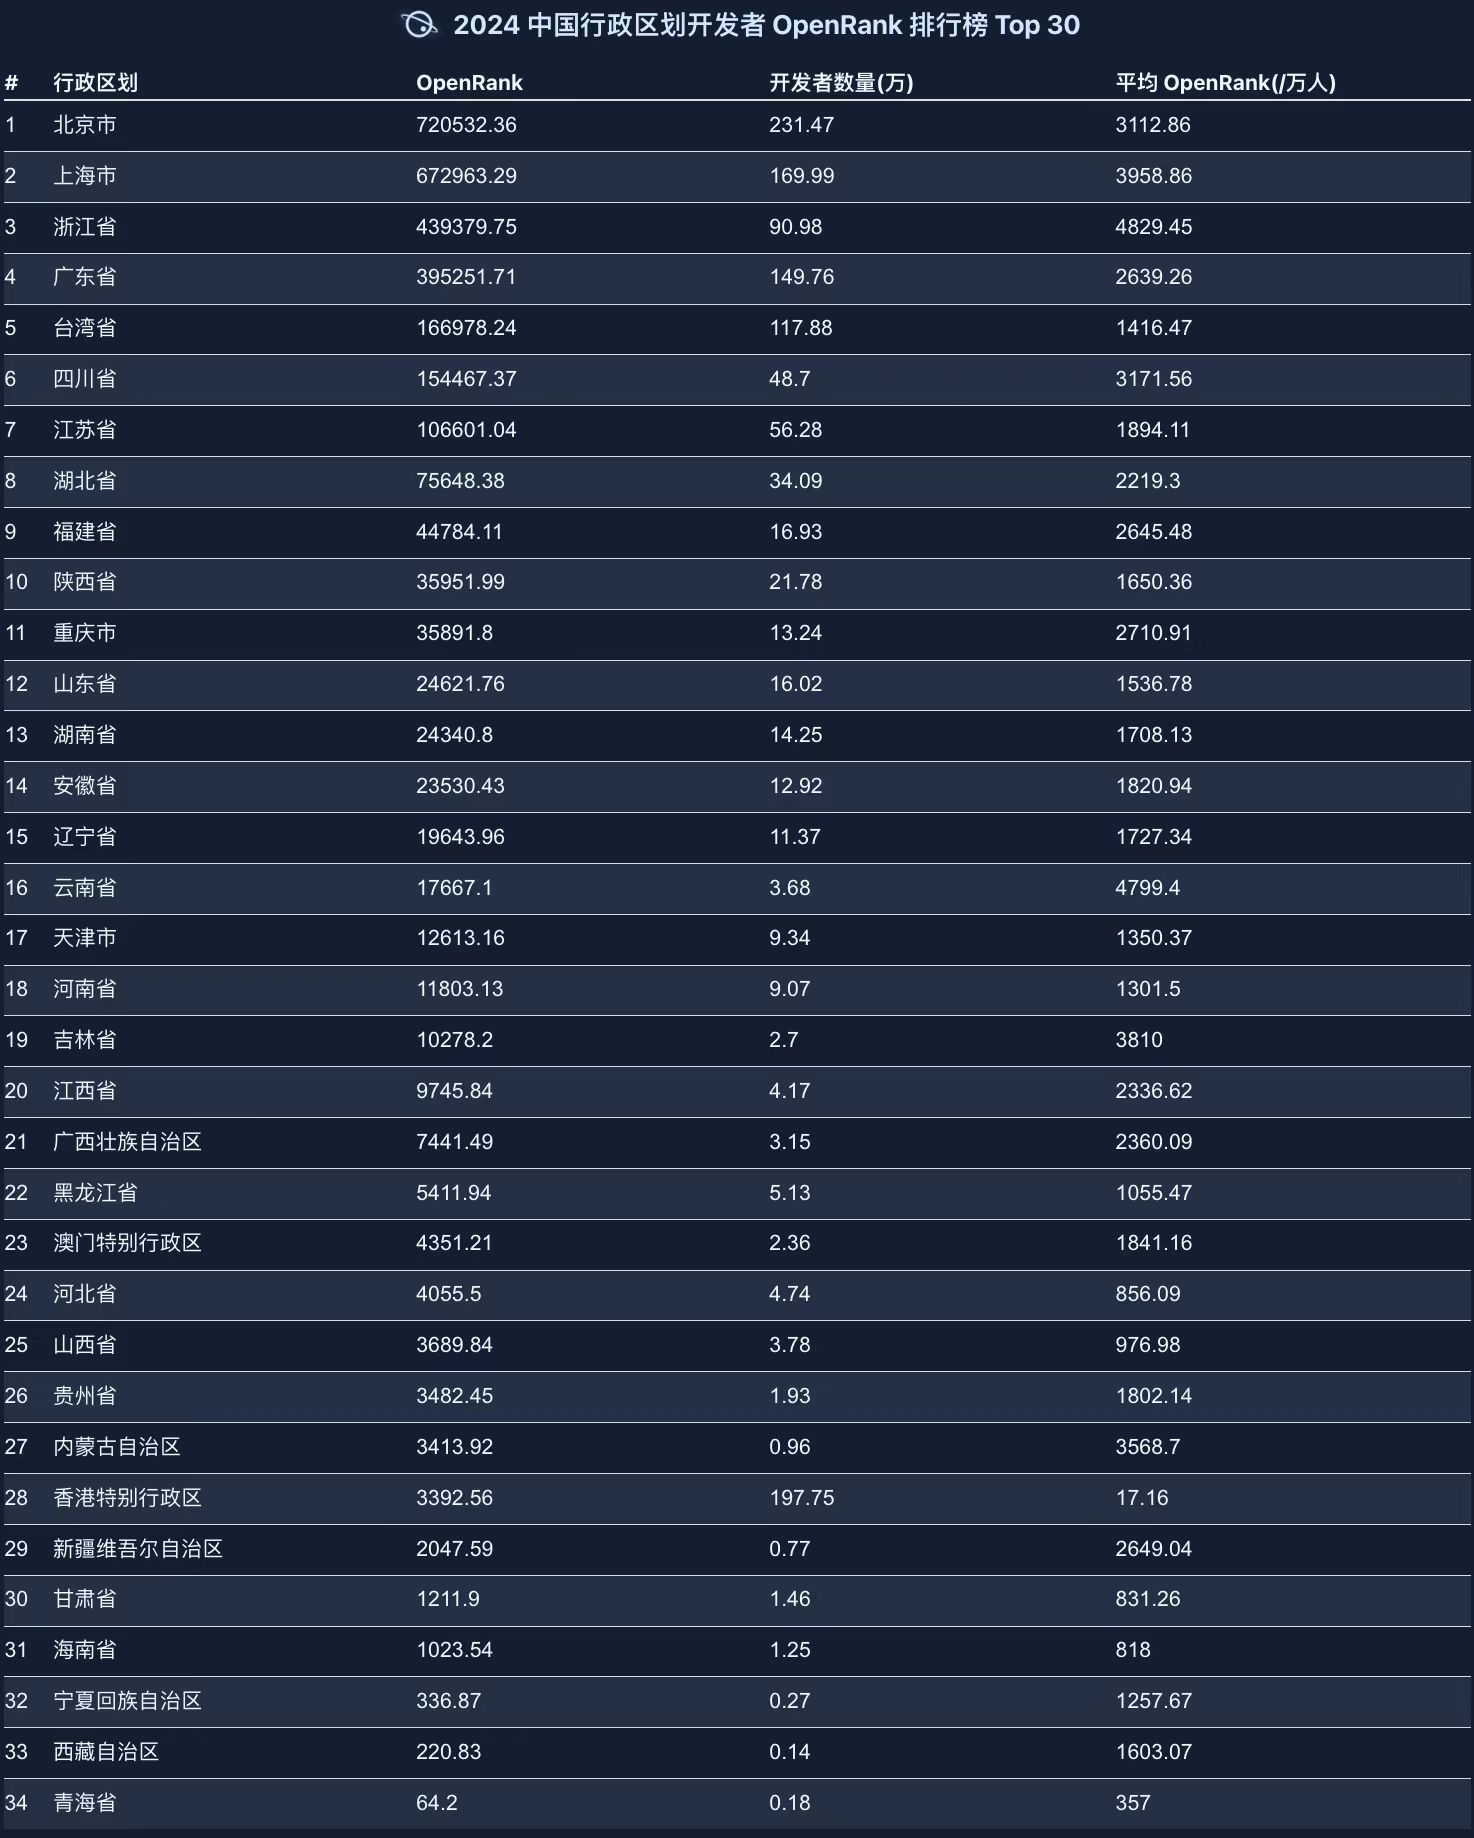
The Chinese Administrative Division Rankings show that first-tier cities like Beijing and Shanghai continue to dominate in open-source development, while coastal cities and some western regions also demonstrate significant development potential.
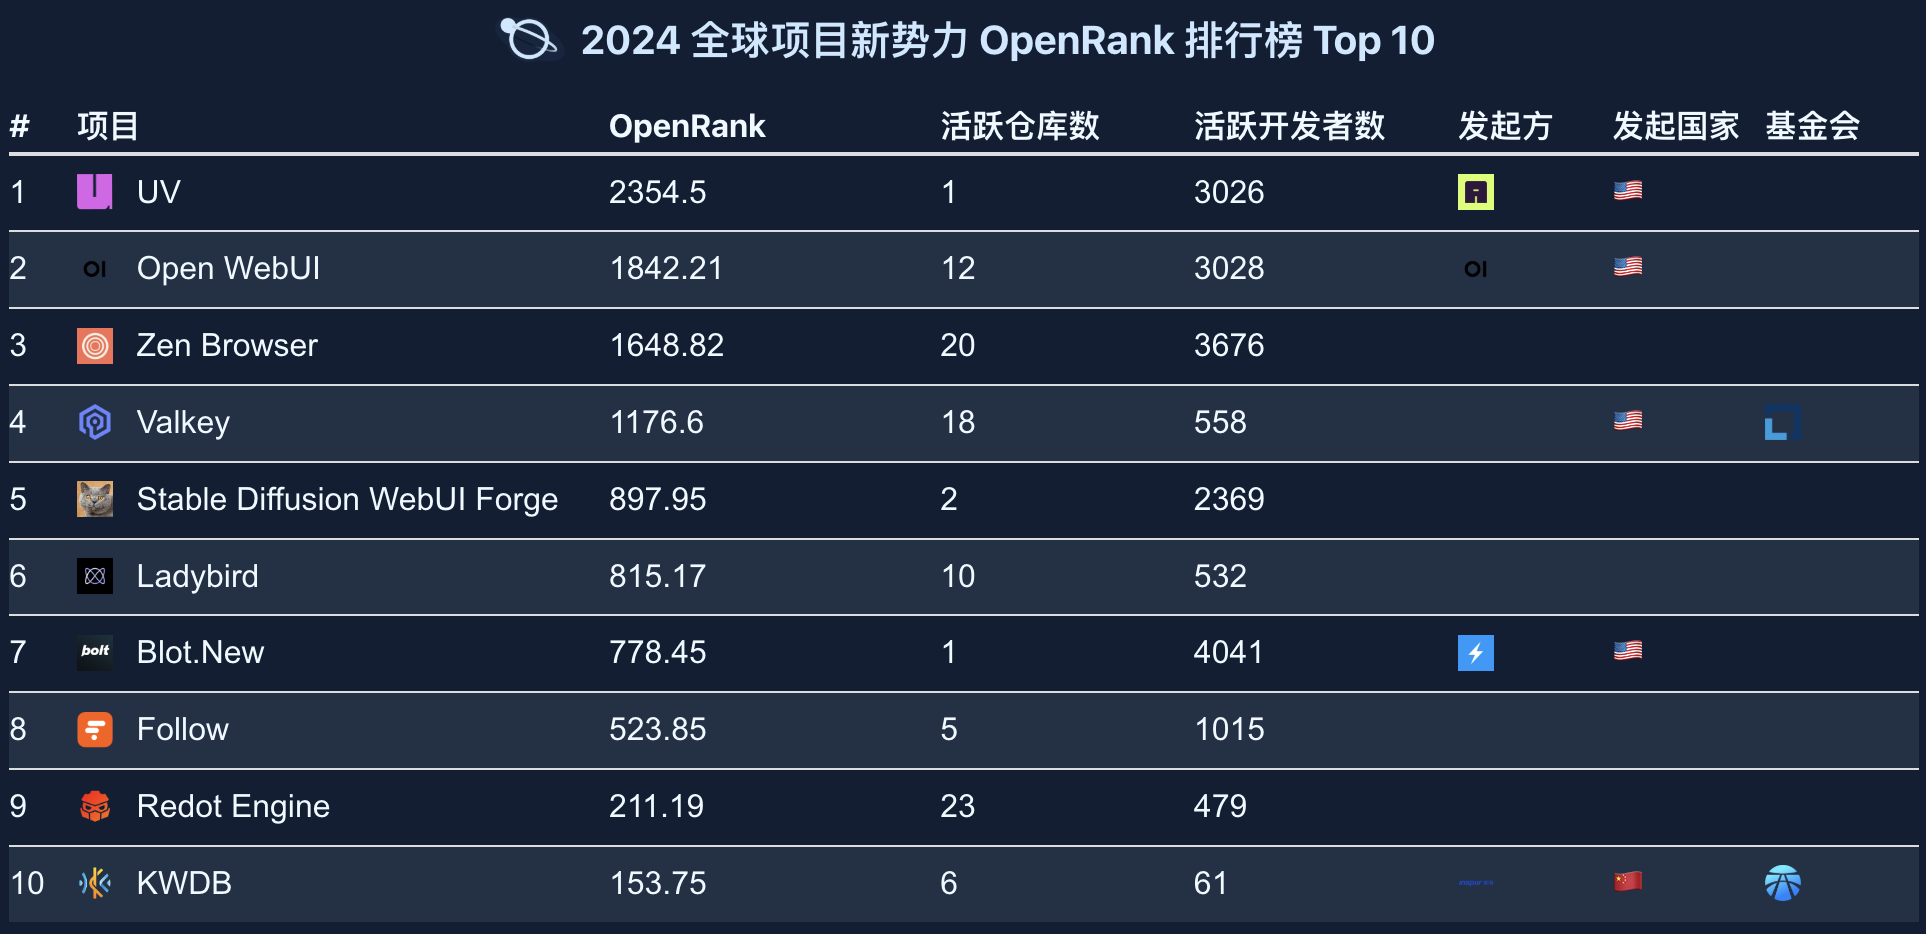
2.8 Global Ranking of Fastest Emerging Projects
The Global Emerging Force Project Rankings reflect highly active core projects and development teams, representing future technology trends and innovation directions.
Highlights:
- The UV project ranks first; as a Python package management tool, it has a very high number of active developers and tight collaboration.
- The Valkey project (fourth place): Forked from Redis, it is a high-performance key-value data storage project currently hosted by the Linux Foundation and supported by giants including AWS, Google Cloud, and Alibaba.
- Redot Engine (ninth place): A community-driven open-source game development engine, forked from the Godot engine, using the MIT license.
- The KWDB project (tenth place): As the only Chinese emerging force project on the list, KWDB is China's first open-source distributed multi-modal database, incubated by the OpenAtom Foundation, reflecting China's technological innovation and open-source contribution in the database field.
2.9 Summary and Trend Insights:
- Rise of China's open-source ecosystem: The global leading position of projects like OpenHarmony and the outstanding performance of companies like Huawei demonstrate China's rapid rise in the open-source field.
- Globalization and diversity: The rankings cover multiple technology domains and regions, fully reflecting the internationalization and technological breadth of the open-source ecosystem.
- Emerging technology drivers: Emerging fields such as privacy computing, distributed databases, and community-driven game engines are becoming hotspots in global open-source technology.
- Development recommendations:
- Support the incubation and development of emerging projects, especially the international promotion of Chinese projects.
- Strengthen support for open-source foundations and communities, promoting cooperation and innovation in the global open-source ecosystem.
- Guide more developers to participate in open-source projects, enhancing technological influence and global competitiveness.
3. Enterprise Insights
The role and performance of enterprises in the open source ecosystem are increasingly becoming a key dimension for measuring their technological innovation capabilities and industry influence. From global technology competition to localized industry applications, open source has become an important engine driving enterprise digital transformation and technological breakthroughs. With the continuous expansion of the open source ecosystem, the activity, contribution and influence of enterprises in the open source field have gradually become an important indicator for evaluating their comprehensive strength.
This section will analyze the evolution trends of OpenRank in global and Chinese companies over the past decade, and combine the activity level and OpenRank rankings in 2024 to deeply explore the performance of enterprises in the open source field and their role in promoting the industry ecosystem. Especially for DaoCloud, a dark horse among Chinese companies this year, will fully demonstrate its rapid rise and strategic layout in the field of cloud-native technology through data visualization, analysis of core project ecological collaboration networks and community collaboration networks, providing new references and inspirations for the industry.
3.1 Global Enterprise OpenRank Evolution Over the Past 10 Years
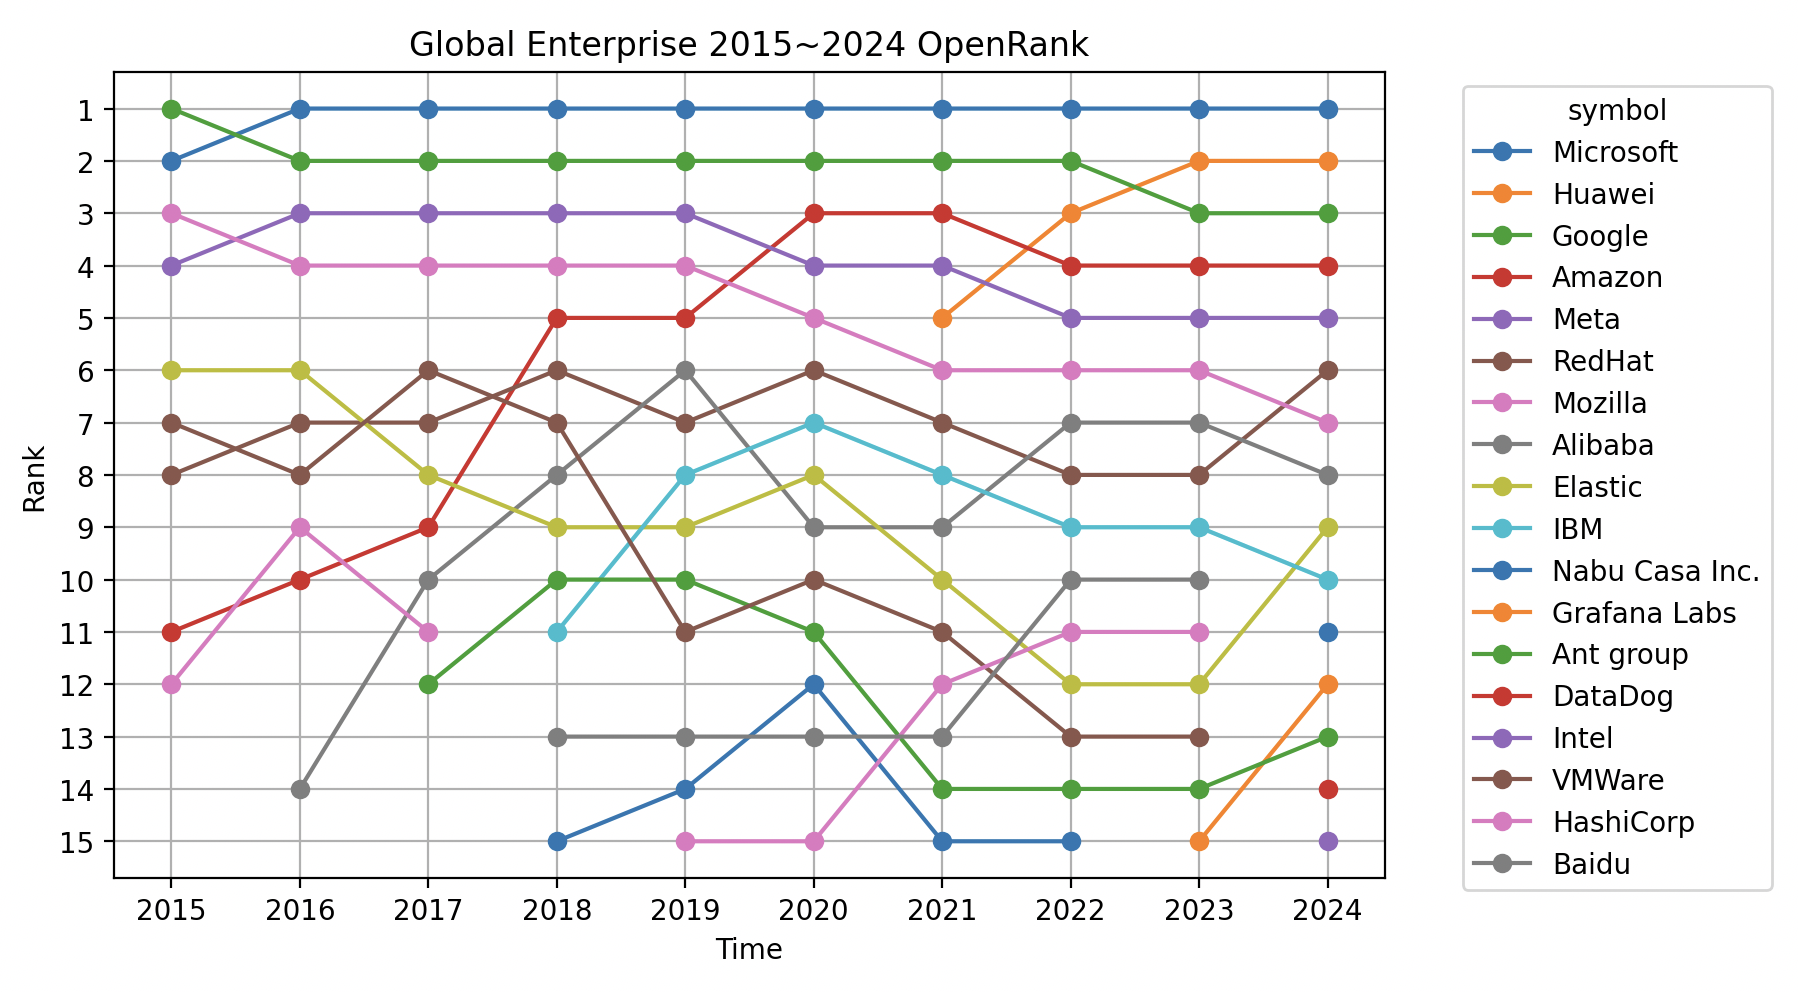
Observations on the influence of global enterprises in the open-source field:
- Microsoft: Since starting its open-source strategy in 2008, Microsoft reached the top of global open-source influence in 2016, and no one has shaken its position since.
- Huawei: After facing US sanctions in 2019, Huawei made open-source a key strategic direction. Its open-source influence has continued to soar, successfully surpassing Google and Amazon in 2023, achieving a major breakthrough.
- Alibaba: The leader of domestic open-source in China before 2021, currently holding a steady position at global eighth place.
- Ant Group: Outstanding performance in the past three years, entering the global top 15 for the first time in 2023, now ranking 13th, showing strong momentum in open-source development.
- Baidu: As the fourth largest giant in domestic open-source, due to the rapidly changing open-source landscape in China, it currently ranks 12th globally.
- Nabu Casa Inc: The global dark horse of 2023, entering the global Top 15 for the first time, currently ranked 11th, it is the world's largest open-source home automation platform.
- Intel: Entered the global Top 15 for the first time this year, ranking 15th, showing its gradual positioning and efforts in the open-source field.
- DataDog: Another newcomer to the Top 15, ranking 14th, this is a leading company providing cloud application monitoring and data analytics services, demonstrating its potential in the open-source field.
3.2 Chinese Enterprise OpenRank Evolution Over the Past 10 Years
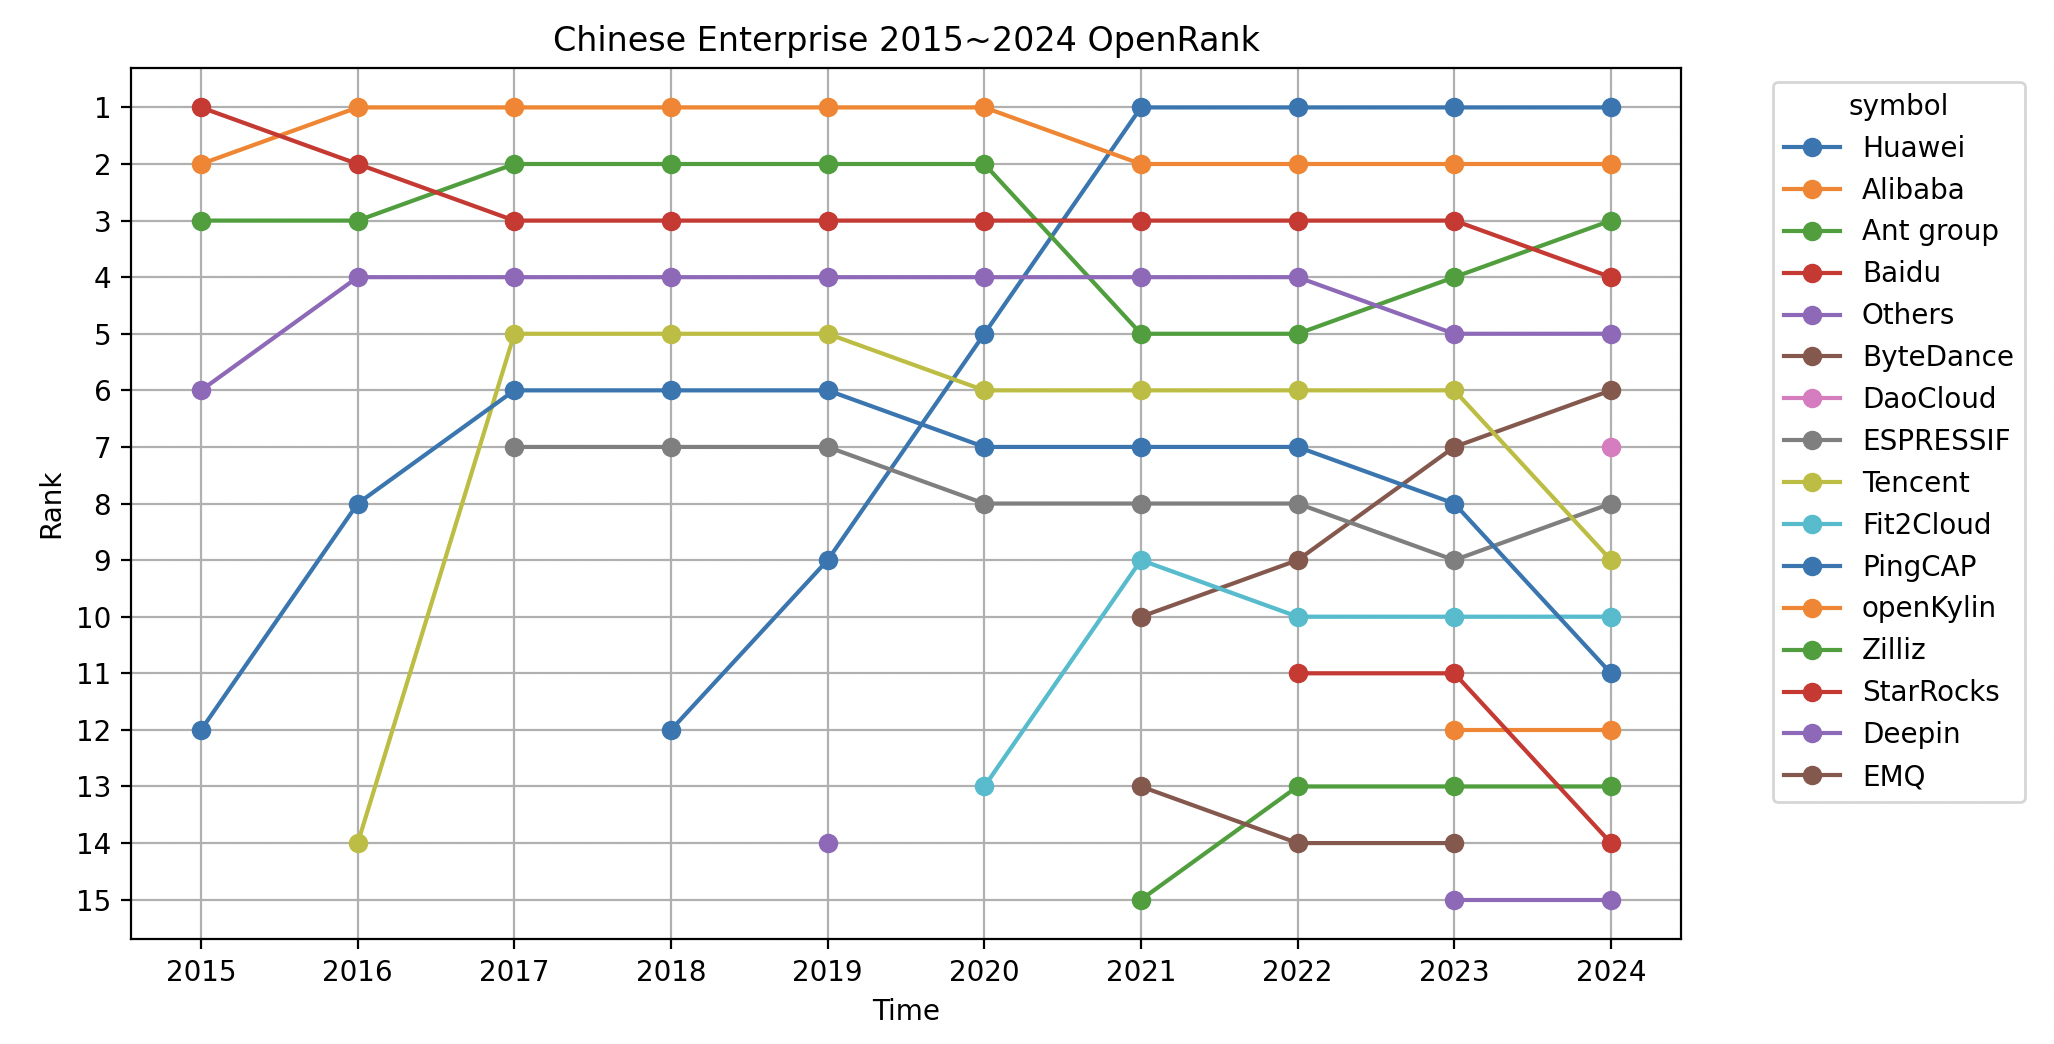
This figure clearly shows the strategic layout and changing trends of domestic enterprises in open-source:
- Huawei: Starting to exert effort in 2018, it took only two years to leap to first place in domestic open-source, and climbed to second place globally in 2023, demonstrating strong execution of its open-source strategy.
- Alibaba and Ant: As veteran leaders in the domestic open-source field, the two companies have maintained stable performance and continued to maintain leading positions.
- Baidu: Affected by the fierce competition from the top three companies, its ranking has slipped to fourth place domestically, but it still maintains high industry influence.
- ByteDance: Rapid progress in the open-source field in recent years, becoming an important emerging force in the domestic open-source ecosystem.
- Espressif: A low-key but powerful semiconductor open-source champion, occupying a place in the open-source world with solid technical contributions.
- Fit2Cloud: Another low-key and pragmatic open-source enterprise, whose multiple open-source software products are favored by developers, demonstrating strong practicality and influence.
- Emerging forces: In recent years, emerging enterprises such as Fit2Cloud, PingCAP, and StarRocks have rapidly risen, active in cloud computing, big data, AI, and infrastructure fields. The rapid development of these enterprises reflects that the technological trends of the domestic open-source ecosystem are gradually tilting towards cloud-native and big data.
Overall, these trends demonstrate the diversity and competitiveness of the domestic open-source field, as well as the direction of continued efforts in key technology areas.
3.3 Global Enterprise OpenRank Changes in 2024
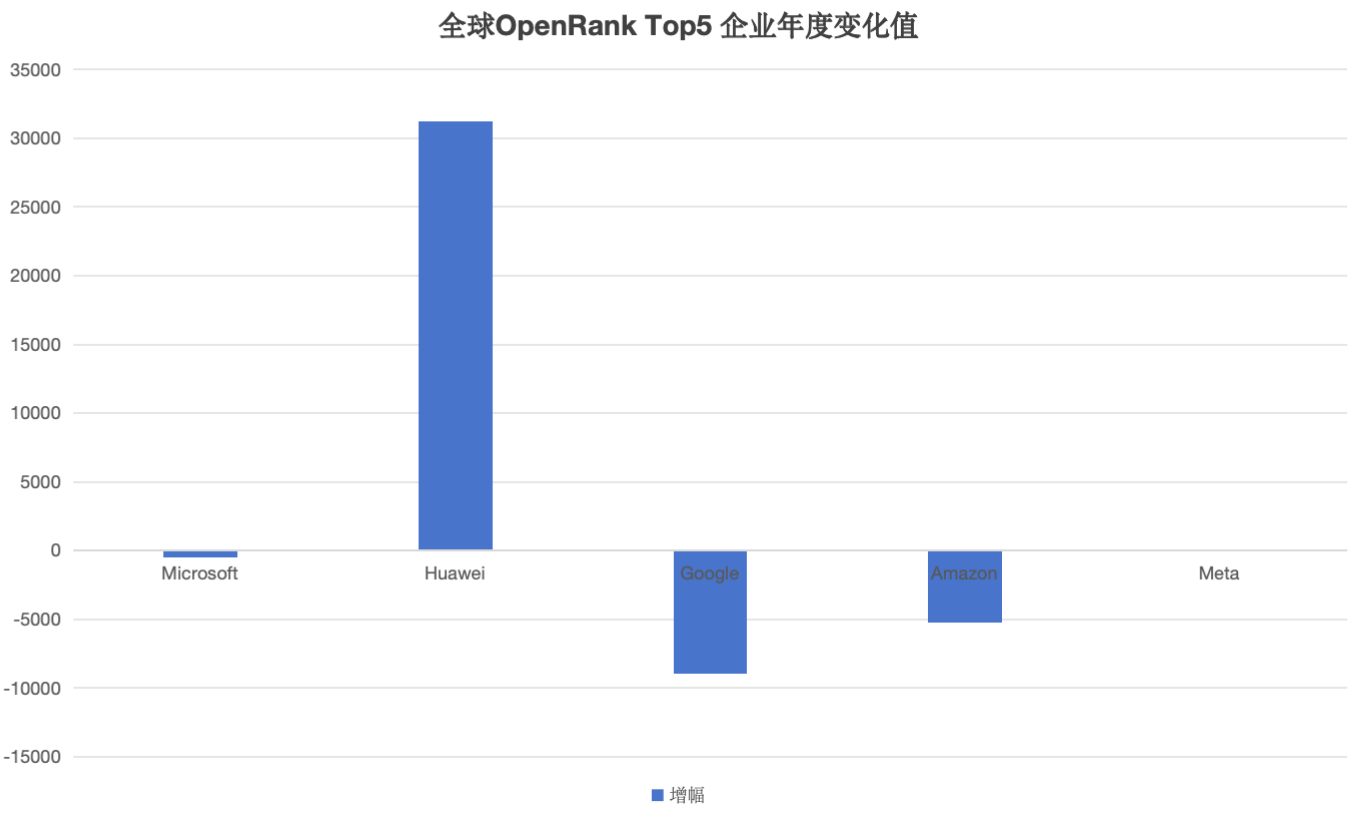
- Among the global Top 5 enterprises, Huawei and Meta are the only companies that achieved growth in 2024, with Huawei showing an extremely significant increase (+31,226.88), while Meta's growth was (+174.75).
- The OpenRank values of Microsoft, Google, and Amazon all declined, with Amazon experiencing the largest decrease (-8,974.76).
- After successfully surpassing Google and Amazon in 2023, Huawei continued to maintain strong growth momentum in 2024, with the increase again setting a new high. This not only suggests that Huawei may challenge Microsoft's global first position in the future, but also further indicates that Chinese enterprises are accelerating their layout in the global open-source community, gradually enhancing their influence in the international open-source ecosystem.
3.4 Chinese Enterprise OpenRank Changes in 2024
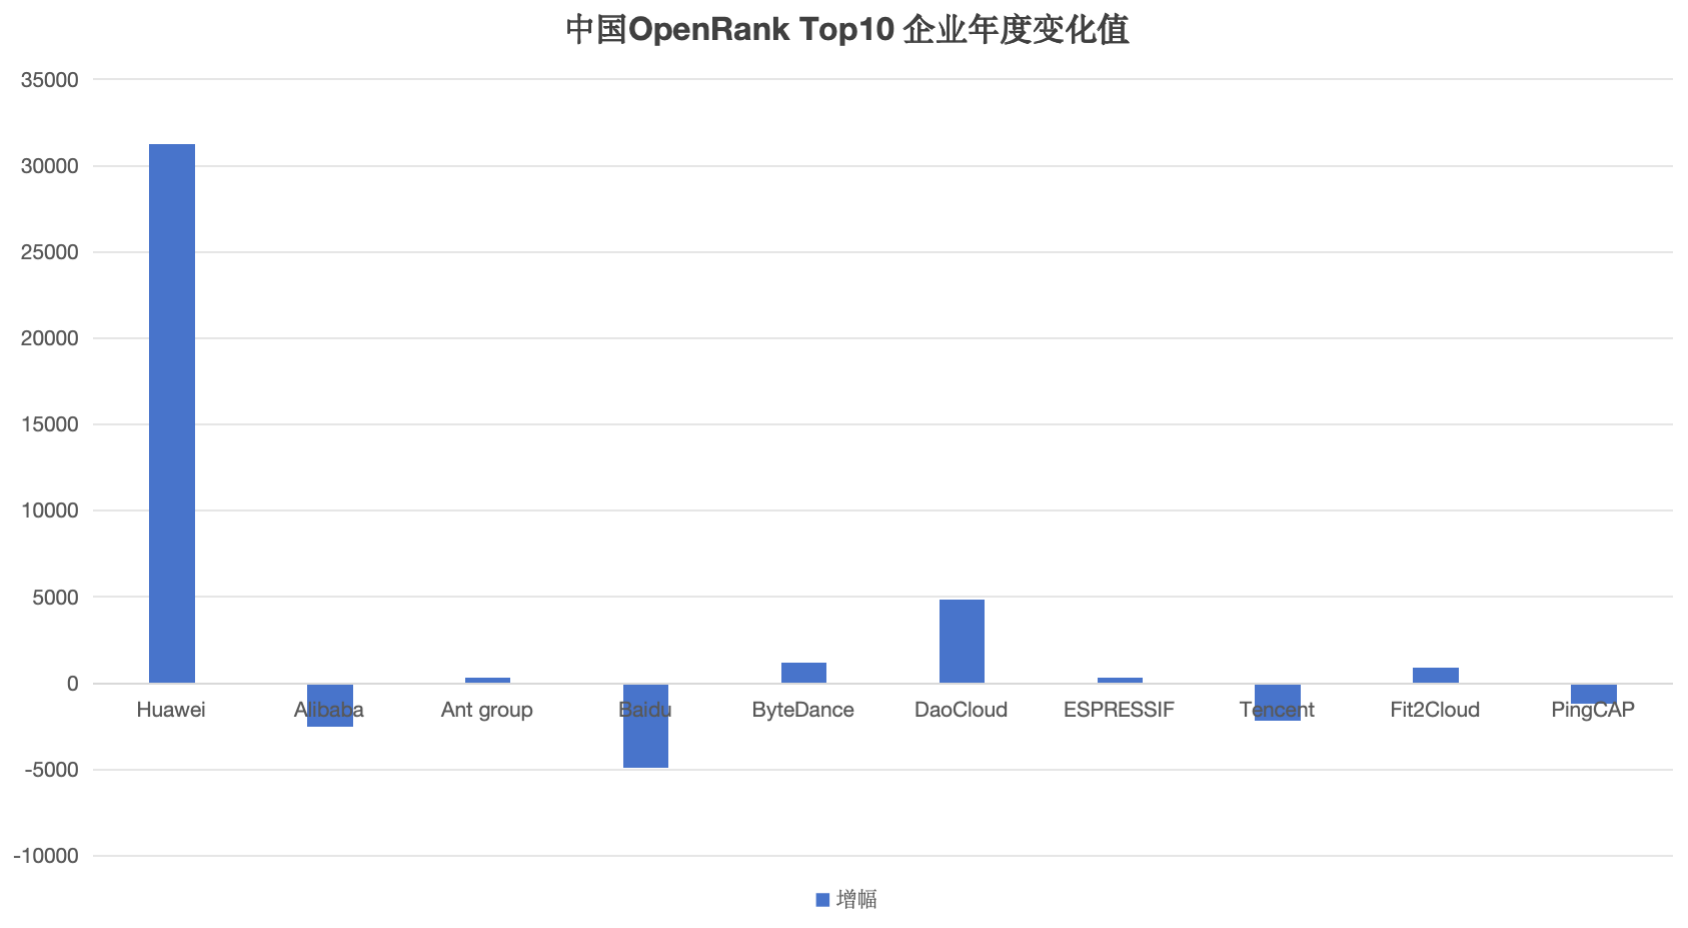
- Among the Chinese Top 10 enterprises, Huawei, Ant Group, ByteDance, DaoCloud, ESPRESSIF, and Fit2Cloud all achieved growth in 2024, with Huawei's growth being particularly significant (+31,226.88).
- DaoCloud was rated as the domestic annual growth dark horse, with a growth value of 4,846.22, and a total OpenRank value climbing to 6,759.34. Its domestic ranking jumped 9 places, successfully entering the national top 6. This performance made DaoCloud one of the most noticed enterprises in 2024, and a detailed analysis will be conducted on it later.
- Baidu experienced a significant decline in 2024, with an annual decrease as high as 4,911.89, becoming the company with the largest decline among Chinese enterprises. In the global enterprise rankings, Baidu fell 9 places, slipping to 19th globally. This performance is closely related to Baidu's judgment of open-source value and strategic layout, reflecting that its investment and influence in the open-source field have not maintained continuous growth.
3.5 An interpretation at DaoCloud, the Chinese company that rose to prominence in 2024
In the 2024 Chinese Enterprise OpenRank and activity rankings, DaoCloud successfully entered the top ten with outstanding performance. Its OpenRank ranking improved significantly by 9 positions from last year to 6th nationwide, while its activity ranking rose by 10 positions to 5th nationwide, making it the undisputed "dark horse" of the year.
Notably, in June 2024, when various university Docker mirror sites were blocked, many developers turned to DaoCloud, accelerating its rapid rise.
DaoCloud's rise is not only due to its long-term investment in the open-source field and technological innovation but also stems from its deep cultivation and promotion in the container cloud and microservice architecture domains. Meanwhile, DaoCloud actively participates in the research and development of mainstream open-source projects domestically and internationally, including the Kubernetes ecosystem, container orchestration tools, and cloud-native development frameworks. These efforts have significantly enhanced its status and influence in the open-source community.
DaoCloud's success not only demonstrates the exploration and practical achievements of Chinese technology companies in open-source technology development but also provides valuable reference paths for other small and medium-sized enterprises. Through technological innovation and community participation, DaoCloud has not only enhanced its own industry influence but also promoted the further prosperity of China's open-source ecosystem.
3.5.1 DaoCloud Enterprise Insight Dashboard
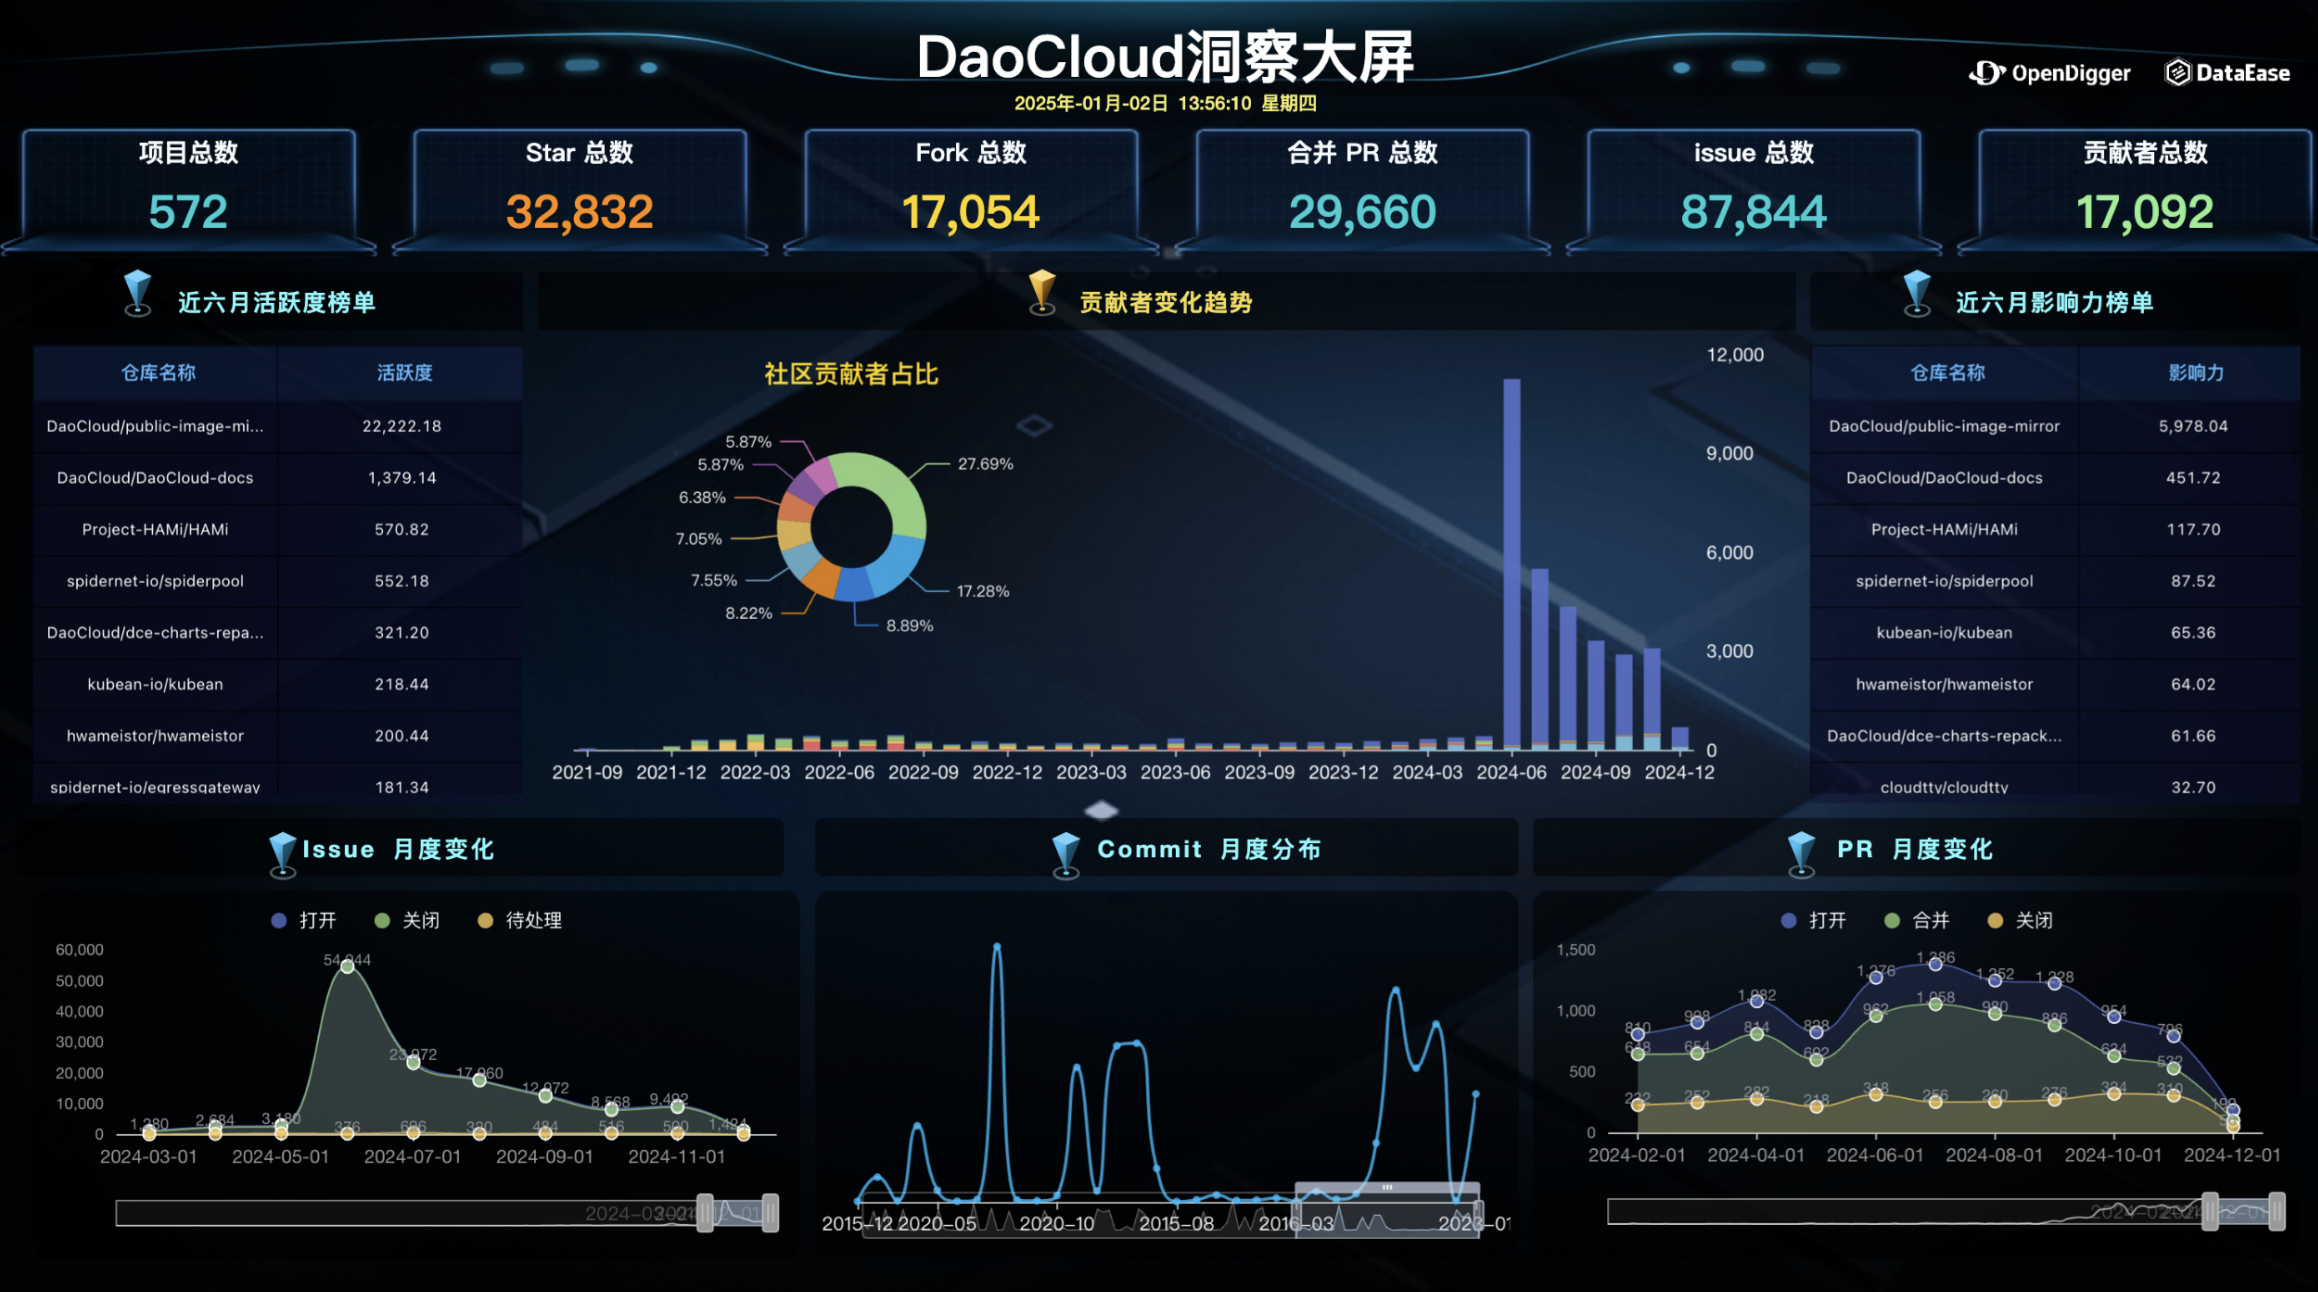
This figure displays the DaoCloud Insight Dashboard, comprehensively presenting DaoCloud's overall contribution situation, active project rankings, contributor distribution, and some key open-source activity metrics (such as trends in Issues, Commits, and PRs). These data provide important basis for analyzing community dynamics and development.
In terms of activity trends, DaoCloud's performance is particularly outstanding. First, the number of Issues peaked in May 2024 (exceeding 60,000), which might be closely related to new version releases or community discussions triggered by major events. Subsequently, the community's efficient response to issue closure and processing fully demonstrates its ability to quickly resolve problems. Additionally, the community's Commit activity has shown significant fluctuations historically, with two peaks occurring in 2020 and 2023 respectively, possibly related to important version releases or feature updates. The most recent peak appeared at the end of 2024, with a significant increase in Commit numbers, indicating the community's continued rise in activity. In terms of PR (Pull Request) performance, the number of opened, merged, and closed PRs in 2024 remained stable overall, reflecting efficient and orderly community development activities.
From an overall performance perspective, the DaoCloud community has demonstrated a healthy and continuously growing ecosystem. Its core projects public-image-mirror (public image service) and DaoCloud-docs (related documentation collaboration) have contributed major activity and influence in the community. Among them, public-image-mirror is dedicated to providing efficient and stable image support for developers, not only promoting the development of the DaoCloud community but also providing important support for domestic and international open-source users. As a documentation collaboration project, DaoCloud-docs significantly lowers the learning threshold for new developers by providing comprehensive technical documentation and development guides, and enhances user experience and technical dissemination capabilities through continuous optimization of document content.
In conclusion, the DaoCloud community has performed exceptionally well in multiple dimensions. The efficient handling of PRs and Issues highlights the close collaboration within the community, while the growth in the number of contributors, Commit activity, and PR activity indicates that the community is still developing rapidly and has the ability to attract more developers. The diverse contributor structure, stable development activities, and active project management further consolidate DaoCloud's important position in the open-source ecosystem. Through the successful operation of core projects, DaoCloud has not only enhanced its own industry influence but also provided valuable experience for the construction of other open-source communities.
3.5.2 Ecosystem Collaboration Network of DaoCloud's Core Project DaoCloud-docs
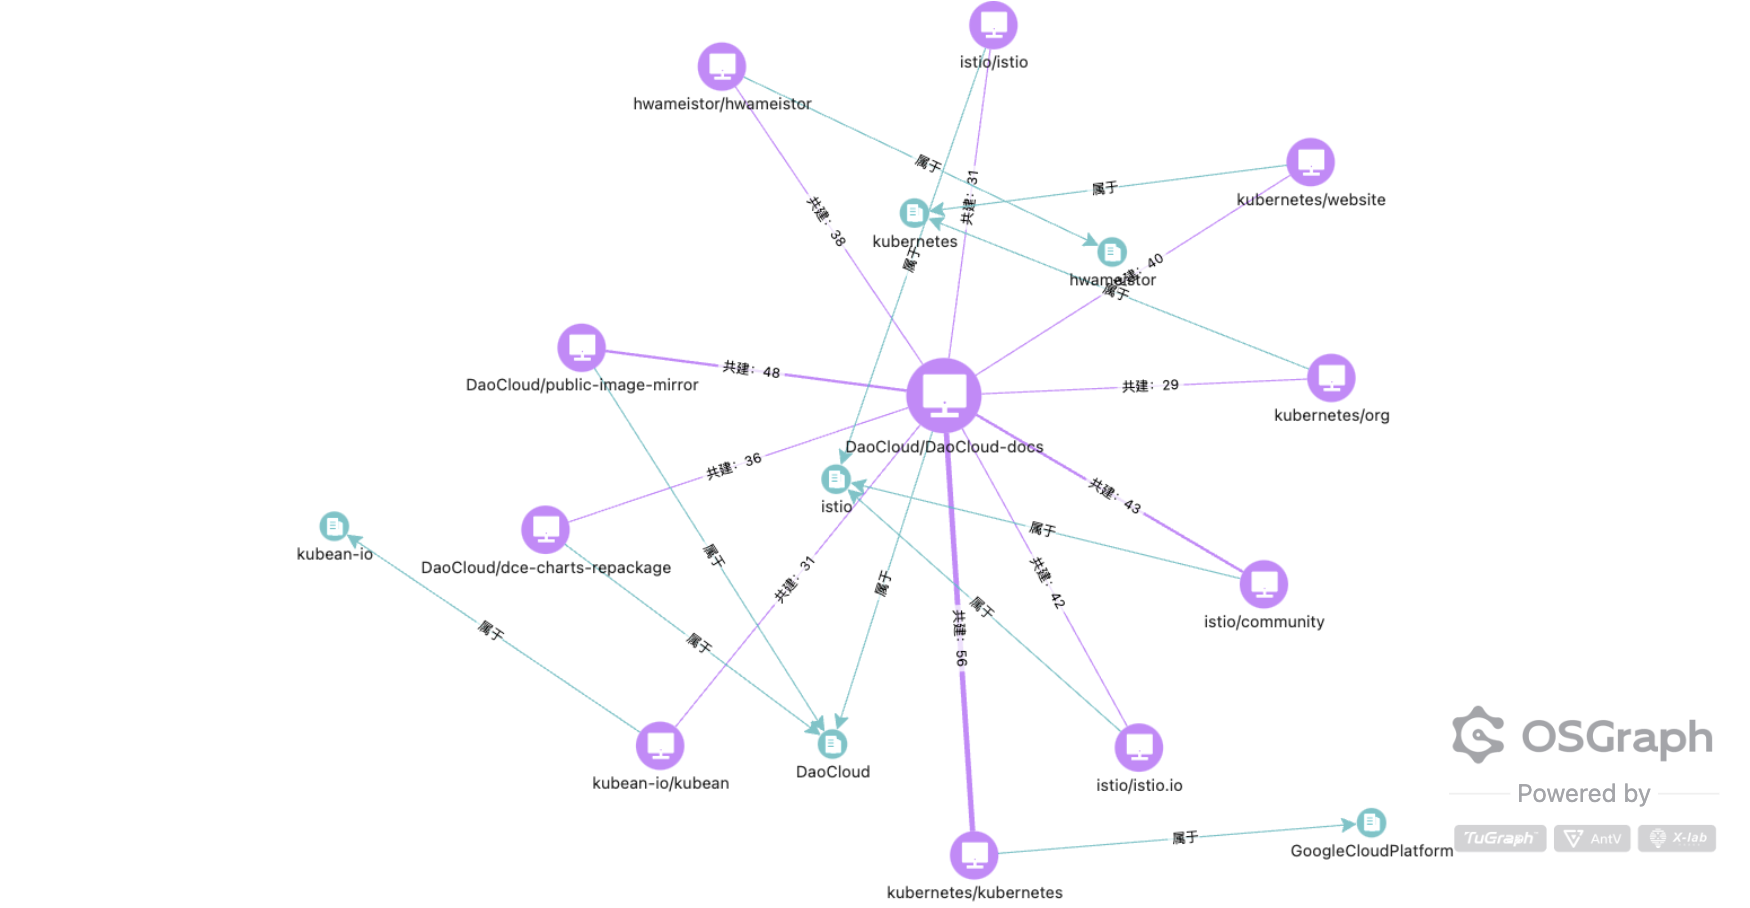
This figure is the ecosystem network of the DaoCloud-docs project in the DaoCloud community, aimed at showcasing the interconnections between the project and other projects and organizations, as well as their development activities and cooperative relationships.
Key findings:
- Strong connection with Kubernetes: DaoCloud-docs has strong connections with multiple Kubernetes-related projects (such as kubernetes/kubernetes, kubernetes/website), indicating that it plays an important role in the Kubernetes ecosystem. This connection may come from DaoCloud's deep use, extension, or contribution to Kubernetes.
- Collaboration with Istio: DaoCloud-docs also has significant associations with the Istio project (such as istio/istio, istio/istio.io), indicating its synergistic role in service mesh technology.
- Other partners: In addition to Kubernetes and Istio, DaoCloud-docs also has connections with multiple projects such as GoogleCloudPlatform and Kubean-io, showing its activity in multi-cloud and container technologies.
3.5.3 Community Collaboration Network of DaoCloud's Core Project DaoCloud-docs

This figure shows the Project Community Network of the DaoCloud-docs project, analyzing the distribution and composition of the project community through development activities and organizational associations.
Key findings:
- Core strength of the community: Chinese developers and organizations are the core strength of this project community, with the main contributors and associated organizations coming from China. Developers windsonsea and samzong are the individuals who have contributed the most, and the number of PRs they submitted indicates their leading role in the project. This year, windsonsea also received the annual "Best Technical Documentation Award" Top Documentarian from the CNCF community (https://mp.weixin.qq.com/s/tdO2QhvE800TKy5RY7FCWw).
- International influence: Although the core of the community is concentrated in China, the project has also attracted attention from developers in other countries and regions, such as the United States and South Korea, indicating that the DaoCloud-docs project has a certain international influence.
- Organizational collaboration: The participation of different organizations such as EMC and @DaoCloud shows the characteristics of cross-organizational collaboration, which helps enhance the diversity and influence of the project.
The DaoCloud-docs project community has shown significant localization characteristics, with Chinese developers and organizations as the main contributing force, while also having international potential.
3.5.4 Ecosystem Collaboration Network of DaoCloud's Core Project public-image-mirror
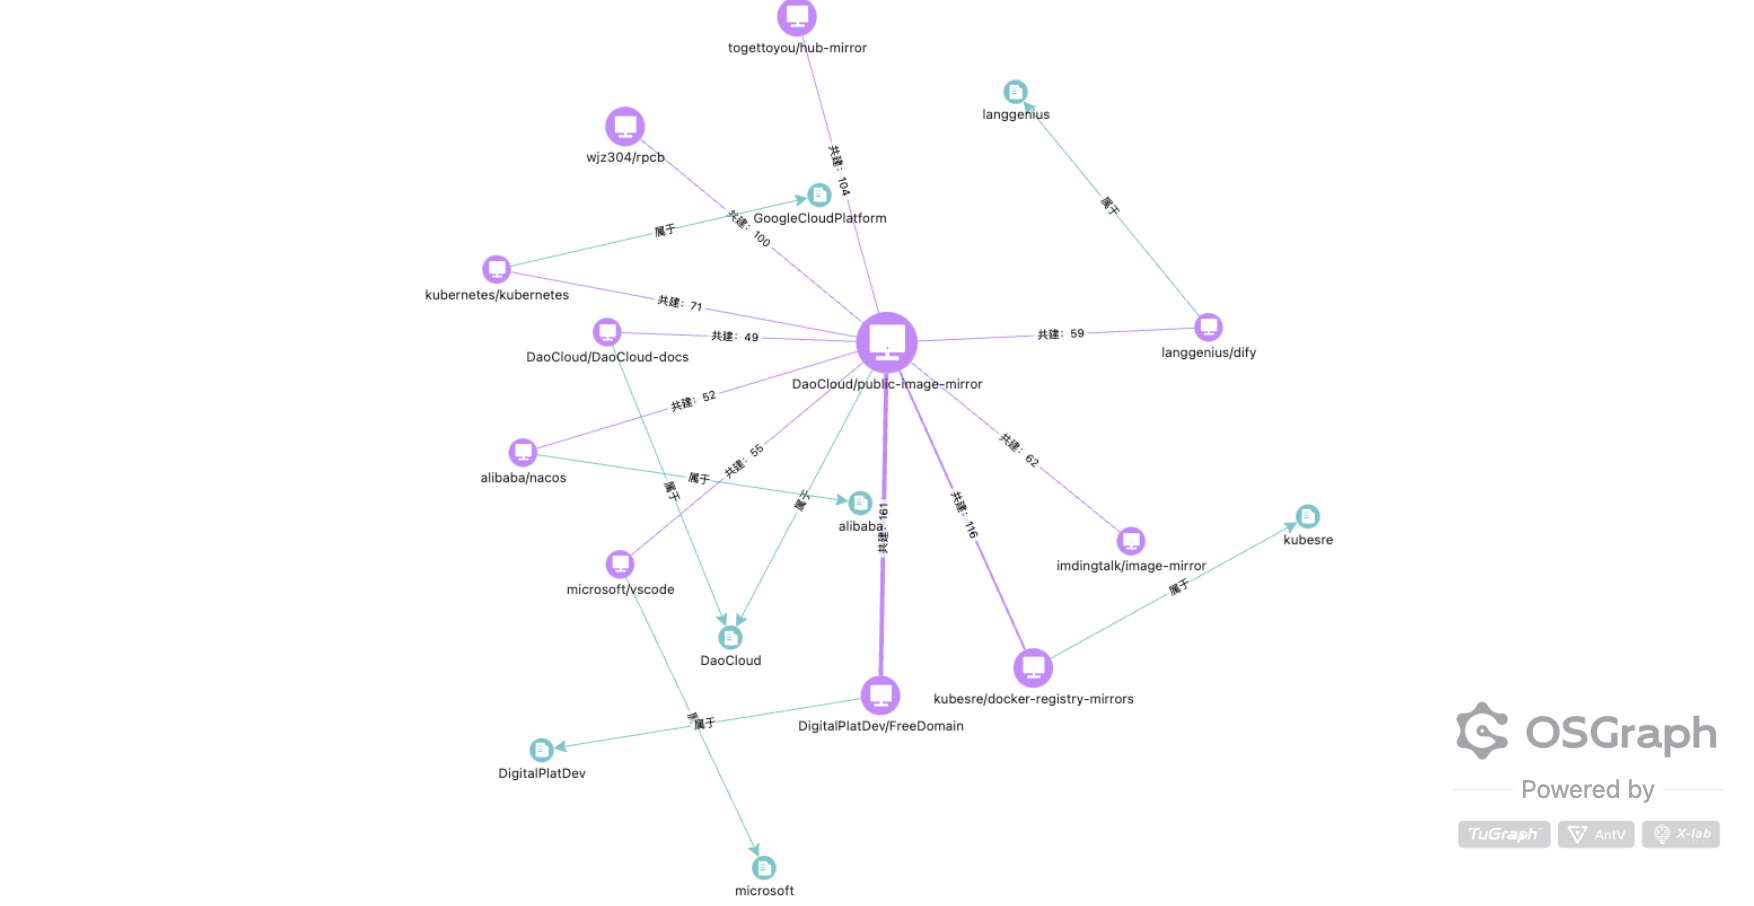
Strongly connected projects:
- kubesre/docker-registry-mirrors (connection strength: 161) and DigitalPlatDev/FreeDomain (connection strength: 176) are the two projects most closely linked to the public-image-mirror project, possibly as a result of joint development, resource sharing, or technical integration.
- kubernetes/kubernetes (71) and alibaba/nacos (52) also have significant associations with it, indicating that they may use or depend on this image project.
- Collaboration with multiple tools and image services: The project has more interaction with image tools such as imdingtalk/image-mirror and langenius/dify, suggesting that the public-image-mirror project may provide infrastructure support for these tools.
- Collaboration with other core projects: DaoCloud/DaoCloud-docs is another core project belonging to DaoCloud that is closely related to it, possibly collaborating on documentation and configuration-related development.
3.5.5 Community Collaboration Network of DaoCloud's Core Project public-image-mirror

Main contributors:
- wzshiming submitted a large number of PRs (279) and is a core contributor to the project.
- Other contributors such as JaredTan95, yank1, and cuisongliu have also made significant contributions to the project through PRs, Stars, and other forms.
Main sources of contribution:
- China is the main source of community collaboration, showing the localization characteristics of the project.
- The United States and Taiwan have also participated in the collaboration, indicating that the project has certain international influence.
4. Foundation Insights
As a non-profit open source organization, the Foundation plays an indispensable role in promoting the organization, development and collaborative innovation of open source projects and communities. It not only provides a full range of services such as technical support, operation and management, and legal protection for the incubation of open source software, but also provides governance guidance for the construction and operation of the community, becoming a combination of incubator and accelerator, and injecting the power of continuous development into the open source ecology. As an important organizer of the open source ecosystem, foundations play the role of a bridge between developers, enterprises and the community due to their standardized operation mode and resource integration ability. This section analyzes the development of the open source ecology from the dimension of foundations, aiming to reveal the core position and actual contribution of foundations in the open source ecology through data insights.
4.1 OpenRank Trend Analysis of Global Foundations
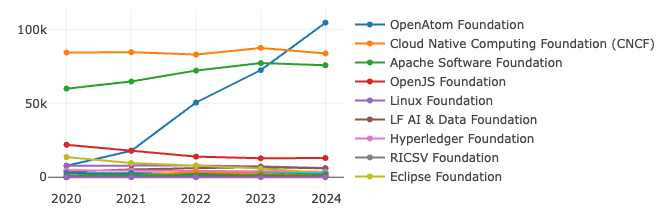
*Note: The Linux Foundation mentioned here does not include its sub-foundations.
- The OpenAtom Foundation has performed particularly prominently, with its influence continuing to rise rapidly, becoming the highlight of 2024. This reflects its strong ecosystem expansion capabilities and project influence.
- In contrast, the growth momentum of CNCF (Cloud Native Computing Foundation) and Apache Software Foundation has significantly slowed. Although they still maintain a high level of influence, their OpenRank saw a slight decline in 2024, which may reflect the maturation of cloud-native technologies and intensified competition.
- Meanwhile, the Linux Foundation continues to develop steadily, demonstrating strong stability. Foundations such as the OpenJS Foundation and Hyperledger Foundation have shown little fluctuation.
The overall trend in 2024 indicates that rapidly growing foundations are gaining market recognition through innovative technologies and robust community ecosystems, while mature foundations need to find new breakthroughs to cope with increasingly fierce competition while maintaining their existing advantages.
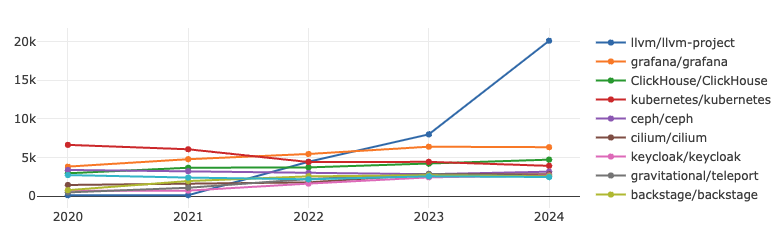
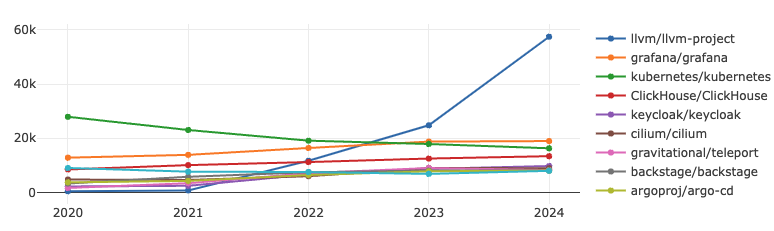
4.2 OpenRank Trend Analysis of Global Foundation Projects
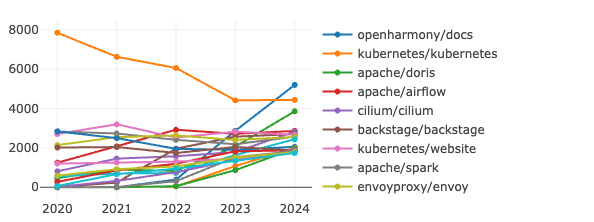
- The influence of the OpenHarmony/docs has risen rapidly, with its OpenRank reaching a historic high in 2024, likely due to the expansion of its ecosystem and the promotion of community activities.
- In contrast, the OpenRank of Kubernetes/kubernetes has been declining since 2020, and its influence further weakened in 2024. This may be closely related to a decrease in community activity or the rise of competitors.
- Apache/doris is another project worth noting, as its OpenRank continued to grow steadily in 2024. This indicates that the project's performance in the field of data processing continues to gain recognition from users and the community.
- Meanwhile, some mature projects, such as Cilium/cilium and Envoyproxy/envoy, showed relatively stable performance in 2024, with minimal fluctuations in OpenRank. This suggests that these projects have entered a stable development phase, maintaining their influence at a certain level.
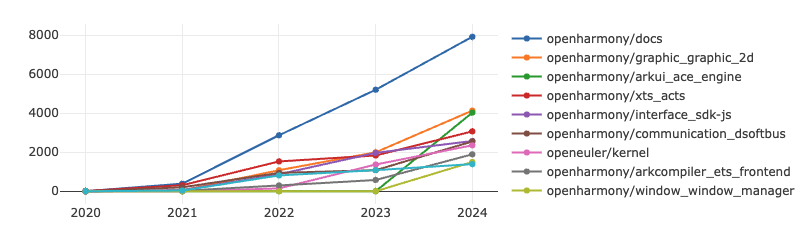
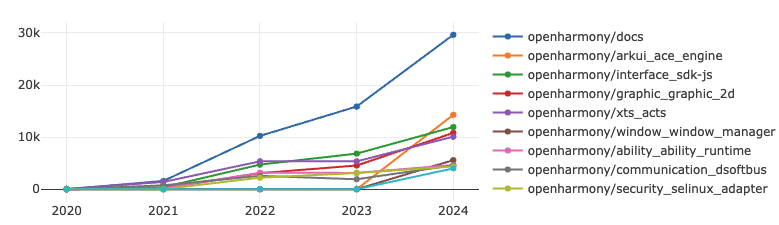
4.3 OpenRank Trend Analysis of the Global Foundation's Chinese Projects
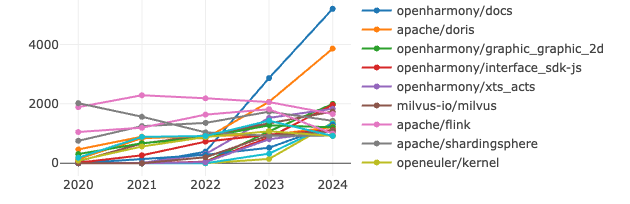
In 2024, among the Chinese projects under foundations, top projects experienced rapid growth, while others developed steadily. Chinese open-source projects demonstrated strong influence and growth potential across various technical fields.
- openharmony/docs ranked first, and other core modules of OpenHarmony (such as graphic_graphic_2d, interface_sdk-js, and xts_acts) also ranked high, reflecting the OpenHarmony community's strong emphasis on promoting ecosystem development. This indicates that OpenHarmony has built a mature and active community ecosystem in the operating system field, with its core components gaining widespread attention and participation from developers.
- Chinese projects have also shown significant influence in the database field. In the field of distributed data processing and storage, apache/doris, as a high-performance analytical database project, ranked second, highlighting its importance in big data and analytics scenarios. Additionally, milvus-io/milvus, focused on vector database development, along with apache/flink and apache/shardingsphere, represents the innovative capabilities of domestic developers in real-time computing and distributed database technologies.
- Furthermore, openeuler/kernel, as a core module of openEuler, is a representative project in the domestic operating system field, reflecting continuous progress in foundational software technologies and the achievements of community collaboration. Meanwhile, openharmony-sig/arkcompiler_runtime_core demonstrates that the domestic operating system ecosystem not only focuses on kernel development but also emphasizes breakthroughs in key technologies such as compilers and runtime systems.
OpenRank Trend Analysis of Chinese Projects Under the Linux Foundation
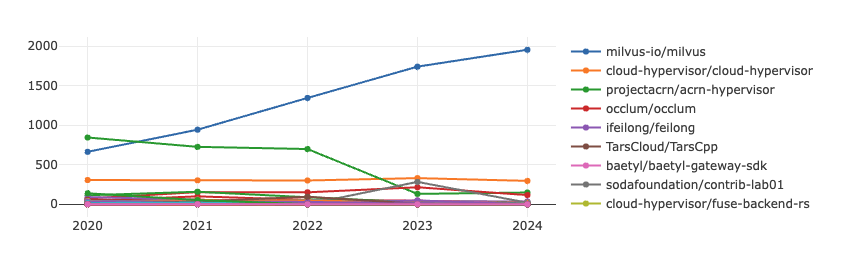
As a key organization in the global open-source community, the participation and development of Chinese projects within the Linux Foundation reflect China's influence in the global open-source ecosystem.
- The OpenRank of the milvus-io/milvus has grown rapidly. Milvus is an open-source vector database project initiated by Zilliz and contributed to the LF AI & Data Foundation, a sub-foundation of the Linux Foundation. It focuses on the efficient storage and retrieval of unstructured data (such as images, videos, audio, and text), making it particularly suitable for machine learning and artificial intelligence-related scenarios. In 2024, milvus-io/milvus ranked sixth in the Linux Foundation's OpenRank, showcasing China's strong influence in the fields of big data and artificial intelligence.
- Overall, the OpenRank of most projects remains relatively low and shows little change. This disparity provides insights for other Chinese projects: by leveraging technological innovation, market adaptation, and community engagement, projects can enhance their competitiveness and vitality, ensuring long-term influence in the open-source ecosystem.
4.4 OpenRank Analysis of Projects Under the OpenAtom Foundation
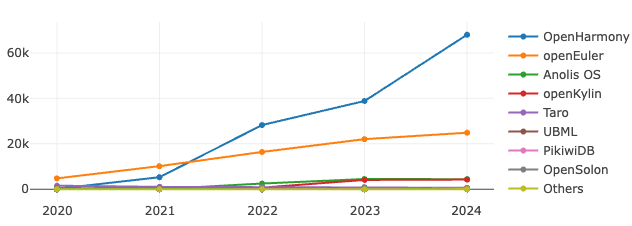
- OpenHarmony continues to hold the top position, with its OpenRank metric showing significant growth compared to 2023, increasing by nearly 70%. This demonstrates its strong appeal as a core project. Such growth may be attributed to its widespread application in smart devices and operating systems, as well as the continuous investment and support from its community.
- openEuler follows closely behind, maintaining its growth momentum in 2024 with steady increases in OpenRank. This indicates its expanding influence in the field of open-source operating systems and its further adoption in cloud computing and enterprise applications.
- The performance of Anolis OS and openKylin in 2024 has been relatively stable. Although their growth rates are not as pronounced as the top two, they remain competitive in specific domains. Anolis OS focuses on the enterprise Linux market, while openKylin targets domestic operating systems, both maintaining a certain level of recognition within their target user groups.
- Other projects such as Taro, UBML, and PikwiDB have lower OpenRank values, reflecting their limited ecosystem scale or the fact that their application scenarios have not yet been widely adopted.
5. Technology Insights
The development of technology plays a pivotal role in the open-source ecosystem, with numerous subdomains demonstrating rapid progress and transformation. Operating Systems: Continuously adapting to new architectures and evolving within the open-source community, showcasing strong ecosystem expansion capabilities. Cloud-Native Technologies: Driving enterprise digital transformation, with an active and rapidly growing open-source project ecosystem, becoming a key driver of technological innovation. Databases: As the core infrastructure for data innovation, the widespread adoption of open-source technologies has facilitated breakthroughs in diverse scenarios. Big Data: Leveraging open-source tools to provide robust support for intelligent decision-making, advancing data-driven applications. Artificial Intelligence: Accelerating automation across industries through open-source frameworks, emerging as a critical force in technological transformation. Front-End Technologies: Enhancing interactive experiences and visual design through open-source projects, improving user experience and development efficiency. These fields, characterized by their openness and innovativeness, have attracted significant attention from developers and investors. This section will provide a data-driven analysis of these technology domains based on two key metrics: influence and activity, revealing their development trends and future potential.
5.1 Trends in the Technical Subfields over the Past 5 years
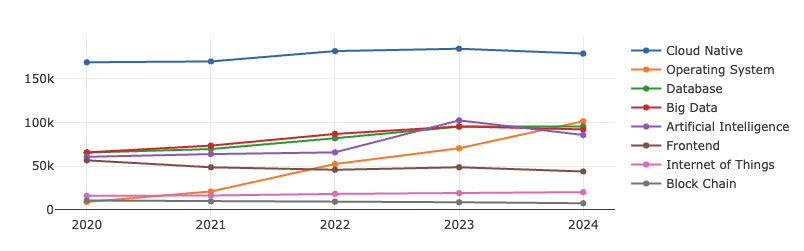
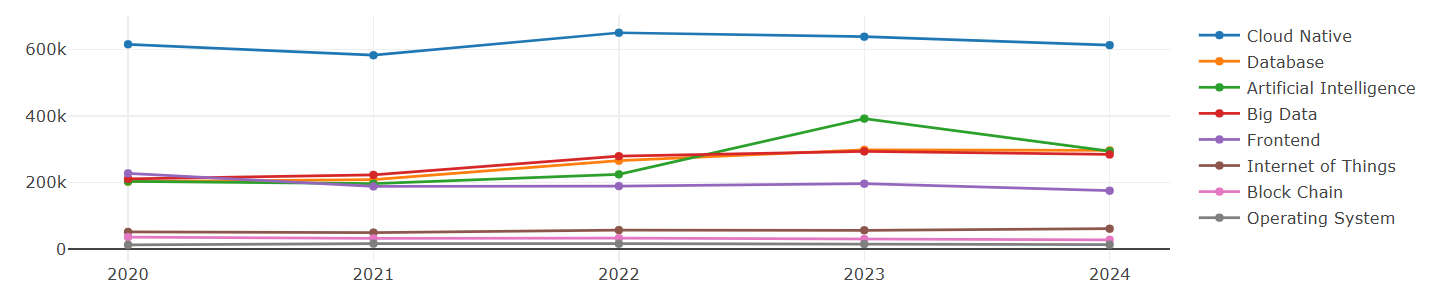
From the trends observed in various categories over the past five years, cloud-native technologies have shown a clear advantage, with a relatively higher number of repositories compared to other areas. AI has experienced significant growth in recent years, reflecting its rapid development. Databases, as critical foundational software, have consistently maintained a strong presence due to their high activity levels. The popularity of big data saw a slight decline in 2024. Although the operating systems field has fewer repositories, its influence has been steadily increasing, highlighting the high value of foundational software. Meanwhile, the influence of front-end technologies has been gradually declining.
5.2 OpenRank of Top 10 Projects in Each Category over the Past 5 Years
Big Data
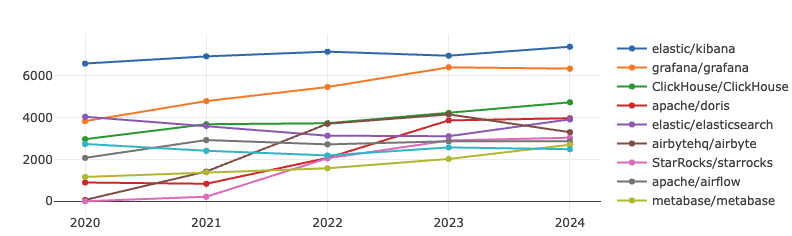
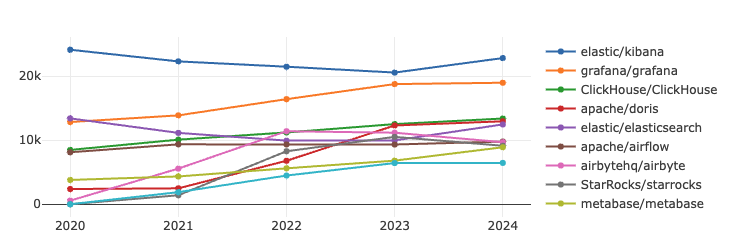
In the big data section, the two key metrics have shown an overall upward trend, with Kibana and Grafana consistently ranking in the top two in terms of influence and activity. Notably, the gap between the two narrowed gradually in 2023, but began to widen again in 2024. Additionally, the competition between Clickhouse and Doris in the big data space is becoming increasingly intense.
Kibana is an open-source data visualization and exploration tool that seamlessly integrates with ElasticSearch, supporting querying, analyzing, and visualizing ElasticSearch data.
Grafana, on the other hand, is a powerful open-source data visualization tool widely used in monitoring and reporting scenarios. It supports multiple data sources, including Prometheus, InfluxDB, and Graphite, and can generate various types of charts and dashboards, providing users with flexible data display and analysis capabilities.
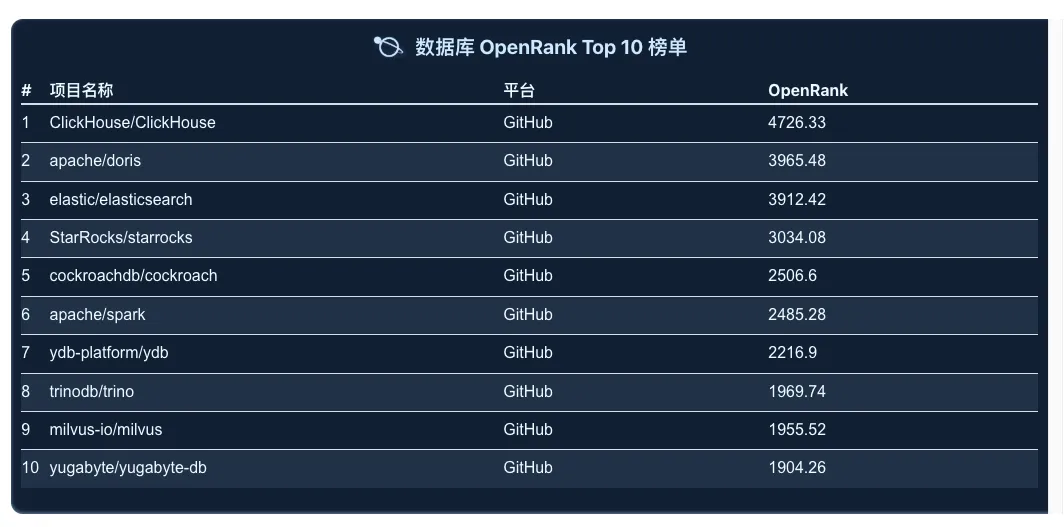
Database
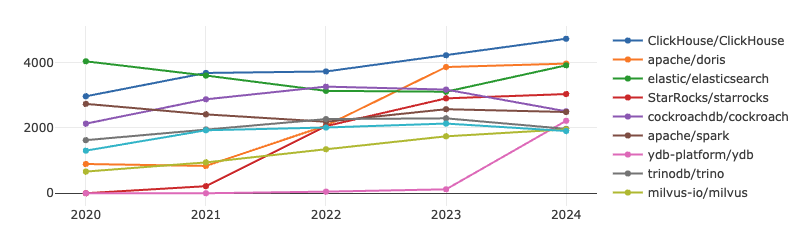
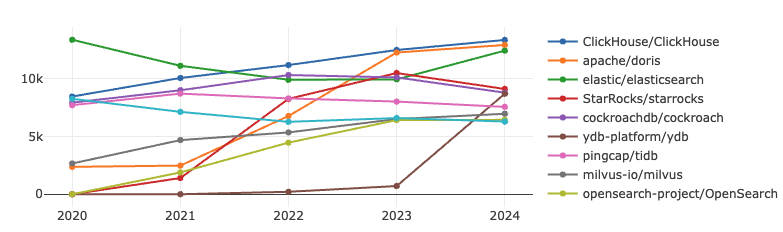
ClickHouse database continues stable growth in both metrics, ElasticSearch returns to the top three, and although Doris' growth rate has slowed, its activity metric is now close to the top. It is expected that its overall ranking may surpass ClickHouse in the future. Additionally, YDB has shown significant growth, successfully entering the top ten rankings in 2024.
ClickHouse is an open-source high-performance analytical engine developed by Russia’s Yandex, based on an MPP (Massively Parallel Processing) architecture. Its vectorized execution engine claims to be 100-1000 times faster than traditional transactional databases while offering rich features and high reliability.
Apache Doris, contributed by Baidu, is an open-source MPP analytical database with a simple distributed architecture that is easy to maintain and is widely used in efficient real-time analytical scenarios.
YDB was released as an open-source project in 2020, designed to provide a high-performance distributed database that supports ACID transactions, making it especially suitable for high-concurrency and distributed application scenarios. Initially developed to address Yandex’s internal technical challenges, YDB has gained increasing attention from developers and enterprises since its open-sourcing and has become a part of the modern distributed database landscape.
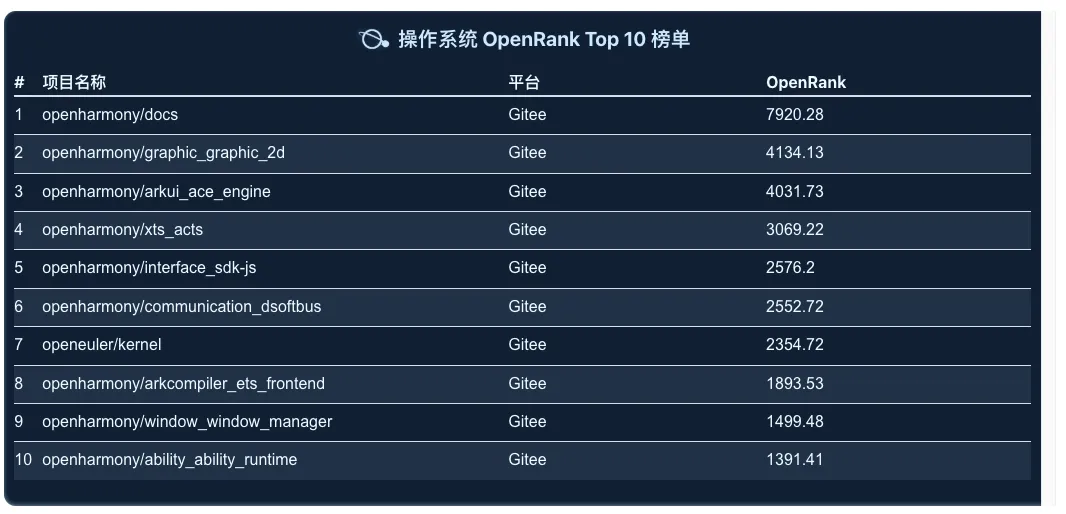
Operating System
It can be observed that multiple repositories under the OpenHarmony project are ranked in the top ten. This analysis incorporates data from the Gitee platform, providing a clearer view of the various advantages of domestic operating systems. Additionally, the OpenEuler Kernel project has also demonstrated strong performance.
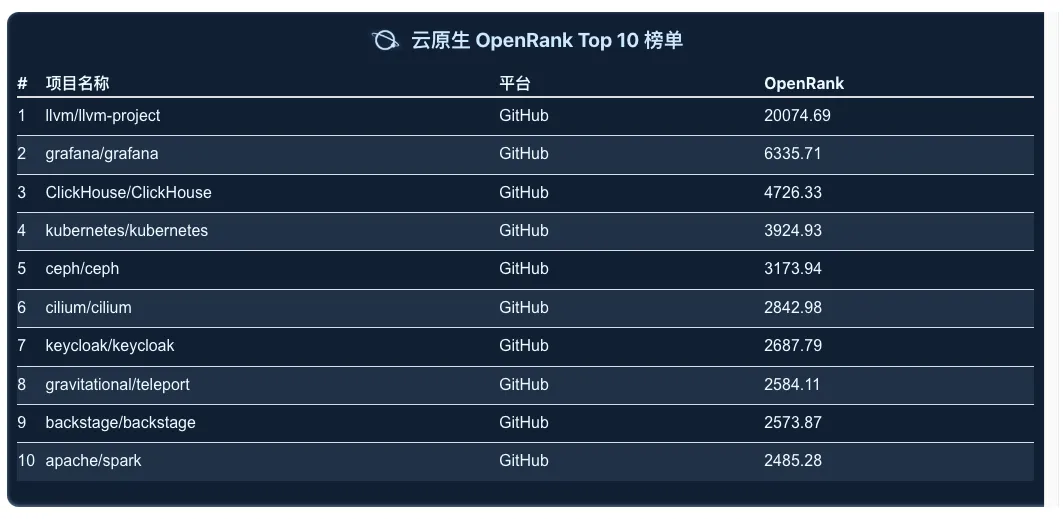
Cloud Native
LLVM-Project has a significant growth rate, ranking first in both indicators; Grafana's growth rate has slowed down, ranking second; Kubernetes's two indicators have declined significantly, and the competition for other projects is fierce.
LLVM is a modular, reusable collection of compiler frameworks and toolchain technologies. It has grown rapidly in activity in the past three years and is deeply loved by developers.
Frontend
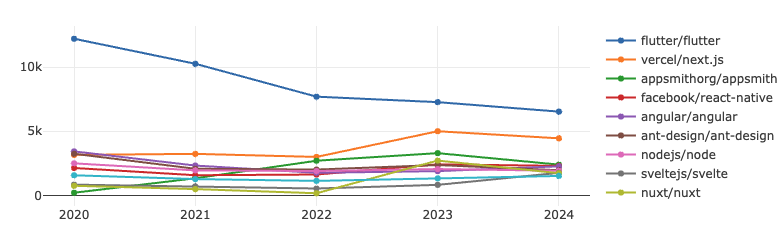
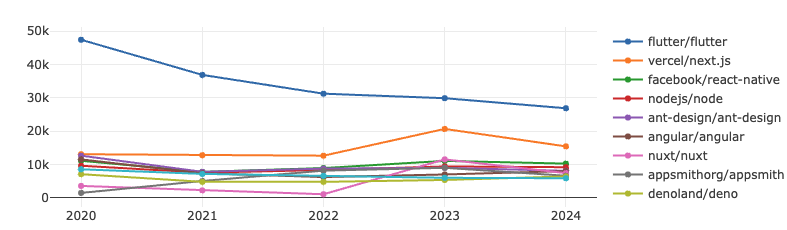
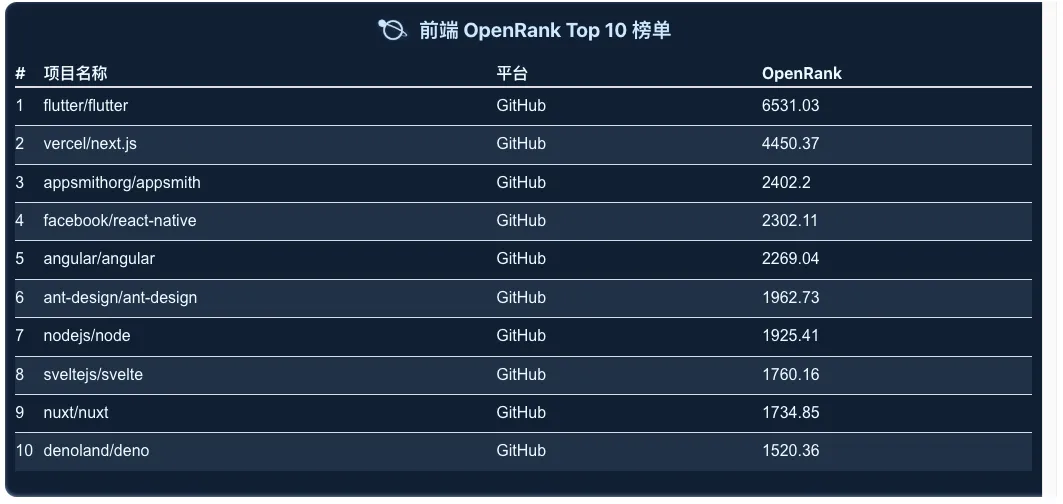
Flutter has experienced a gradual decline in both metrics, yet still maintains a clear advantage over Next.js. Next.js, which showed significant growth since 2023, has slightly slowed down in 2024. Meanwhile, projects ranked 3rd to 10th remain highly competitive with narrow differences in rankings.
Flutter: Developed by Google, it enables both front-end and full-stack developers to build cross-platform user interfaces from a single codebase.
Next.js: An open-source framework created by Vercel, based on Node.js and Babel. Designed to complement React, it offers preview mode, fast compilation, and static export features.
AI
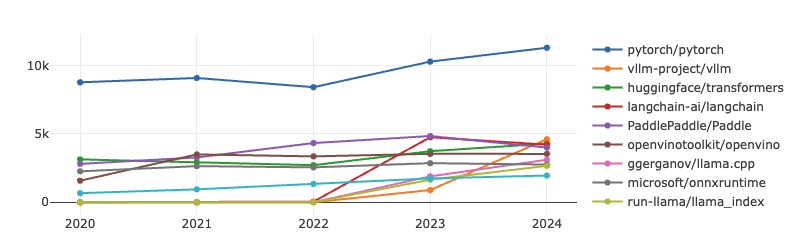
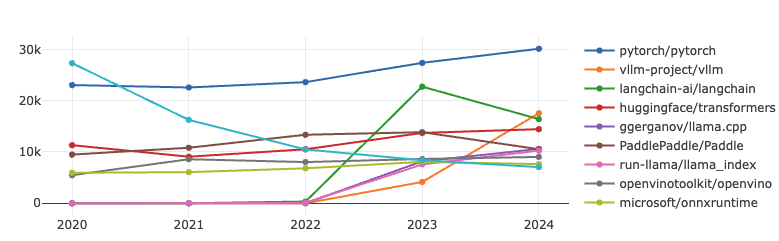
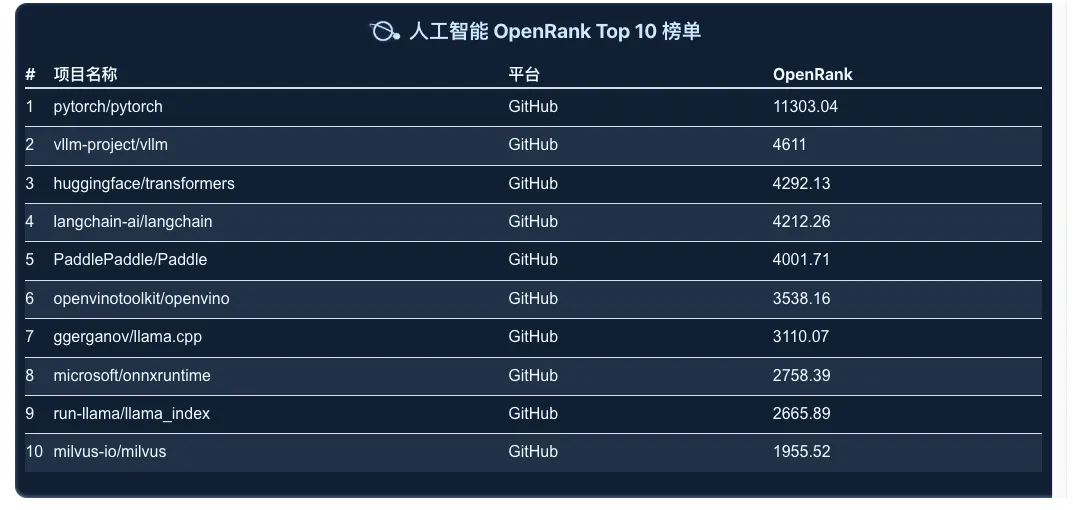
Since 2020, TensorFlow has been on a steady decline, eventually dropping out of the OpenRank Top 10 by 2024. Meanwhile, PyTorch has been steadily growing, further widening the gap with other projects. It is worth mentioning that LangChain has been ranked in the top three in terms of both indicators since it was open sourced in 2022. Although its popularity has slightly declined in 2024, its influence is still significant. At the same time, vllm has grown significantly, surpassing LangChain to rank second, while the Huggingface/Transformers project has maintained a steady growth in both indicators.
LangChain is an open source project launched by Harrison Chase in October 2022 and has become one of the most popular frameworks in LLM development.
vllm-project/vllm is an efficient and scalable distributed reasoning framework designed for efficient reasoning optimization of large-scale language models (LLMs). It has seen a significant increase in activity in the past three years and is deeply loved by developers.
5.3 OpenRank of Top 10 Projects in Each Sub-category
Below is the 2024 OpenRank leaderboard for projects across various categories. 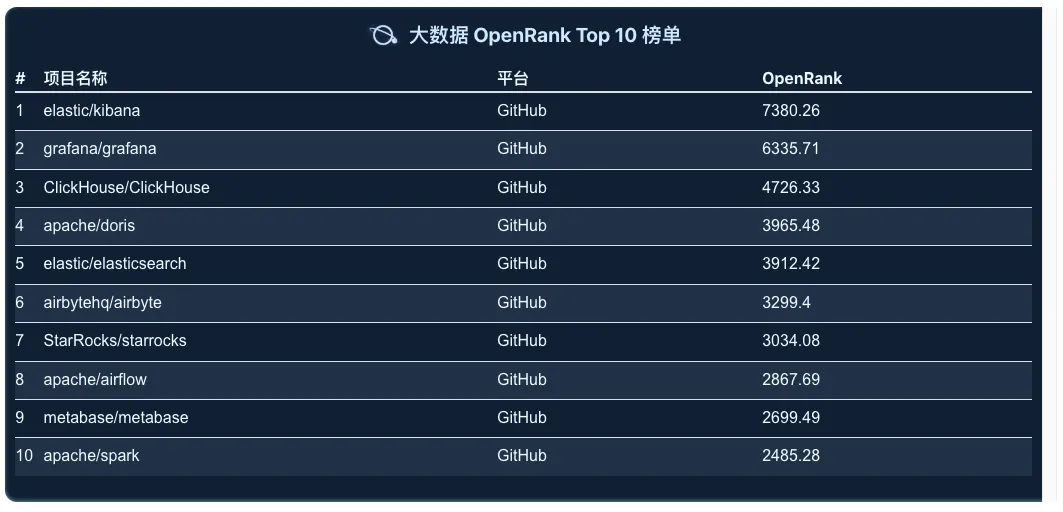
6. Open Source Project Insights
In 2024, open source projects are gradually showing a smooth evolution after the rapid development of AI large models and generative AI, as well as a new vigour after the steady development in the database field. This chapter analyses in-depth multi-dimensional data of the projects from the perspective of open source projects to gain a more comprehensive insight. Statistical analysis of the Topics of open source projects reveals the common points of interest of the global open source community in 2024.
6.1 Project Category
This section selects the top 10,000 active GitHub repositories for analysis.
6.1.1 Proportion of Project Categories
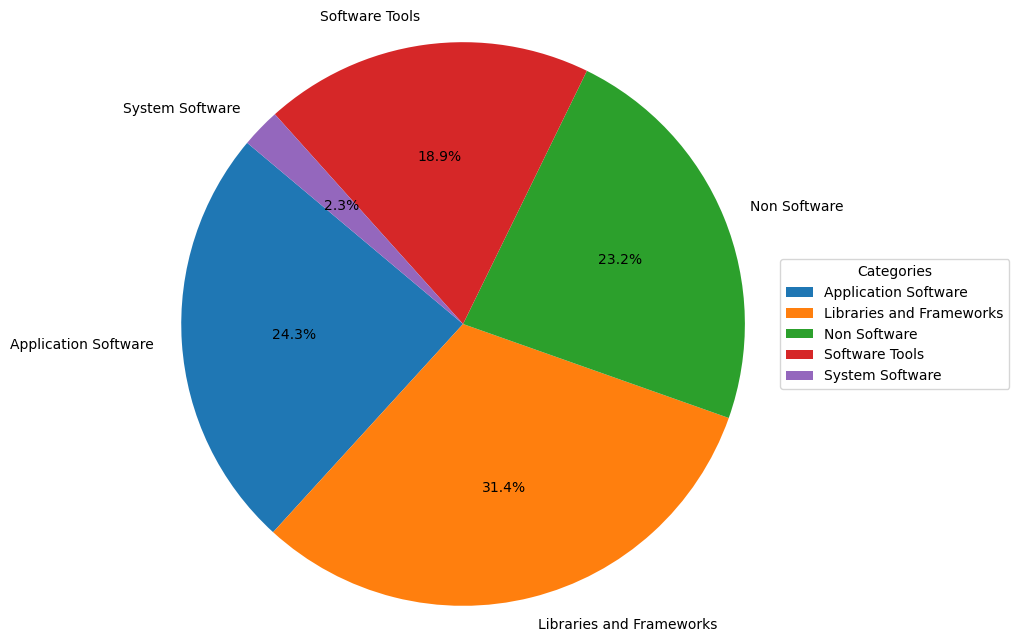
- Application Software: Represented in blue, accounting for 24.3% of the pie chart. This indicates that application software holds a significant proportion in the analyzed dataset, reflecting its importance in the software ecosystem.
- Libraries and Frameworks: Represented in orange, making up the largest proportion at 31.4%. This highlights the widespread use of libraries and frameworks in software development, as they provide the infrastructure and tools for building applications.
- Non-Software: Represented in green, accounting for 23.2%. This category may include projects not directly related to software development, such as documentation, design resources, or other non-code assets.
- Software Tools: Represented in red, making up 18.9%. These tools may include compilers, debuggers, version control systems, etc., which are essential auxiliary tools in the software development process.
- System Software: Represented in purple, accounting for the smallest proportion at only 2.3%. This may include operating systems, drivers, etc., which form the foundation of computer system operations but have a relatively small share in this dataset.
6.1.2 Proportion of OpenRank Totals by Project Categories
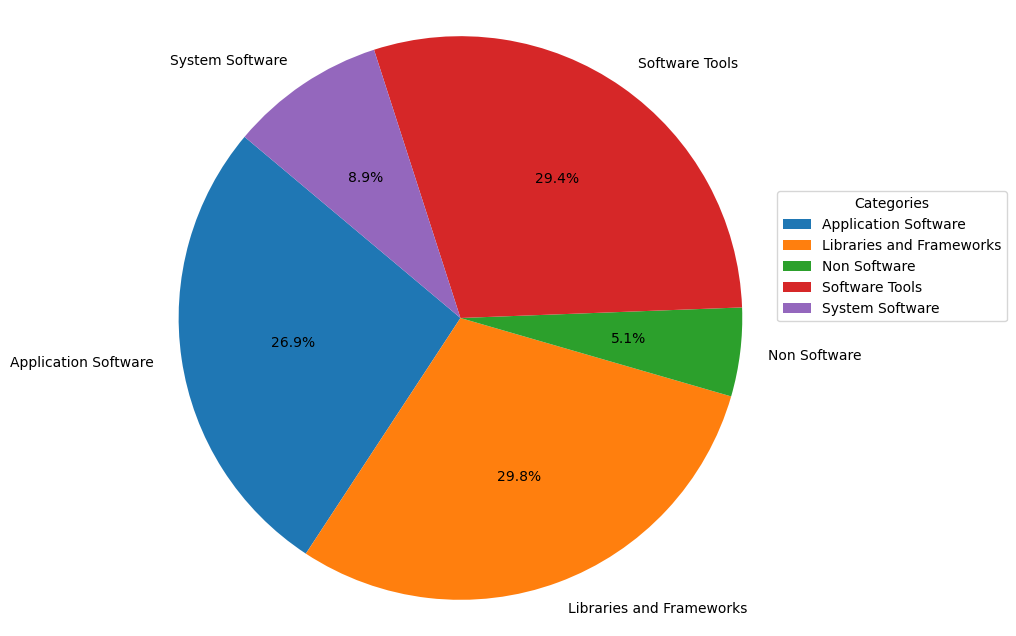
From the influence perspective of OpenRank in 2024, the distribution of these categories shows some notable trends:
- The most significant change is that Non-Software projects, despite having a high proportion in terms of active project count, have relatively low influence in 2024.
- System Software projects, although accounting for a small percentage of active projects, have a relatively higher influence in 2024. A similar trend is observed for Software Tools projects.
- Libraries and Frameworks and Application Software categories remain relatively unchanged, both continuing to represent a significant proportion.
6.1.3 Trends in OpenRank Changes for Different Project Types Over the Past 5 Years
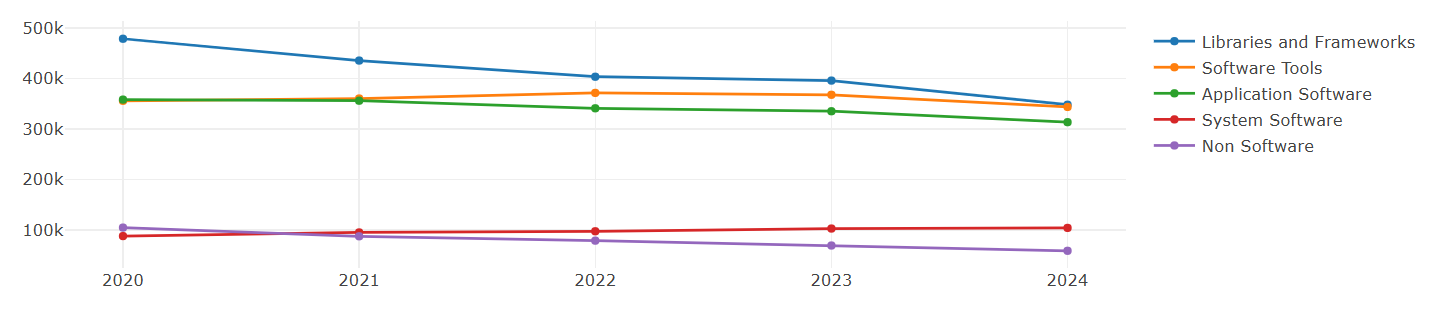
From the five-year OpenRank changes above, it is evident that the influence of System Software has been increasing year by year. The influence of Software Tools has slightly declined this year. Libraries and Frameworks and Application Software show an overall downward trend, while the influence proportion of Non Software projects has been decreasing year by year.
6.2 Project Topic Analysis
This section also selects the top 10,000 repositories ranked by GitHub OpenRank for analysis and explores the Topic tags within these repositories for deeper insights.
6.2.1 Popular Topics
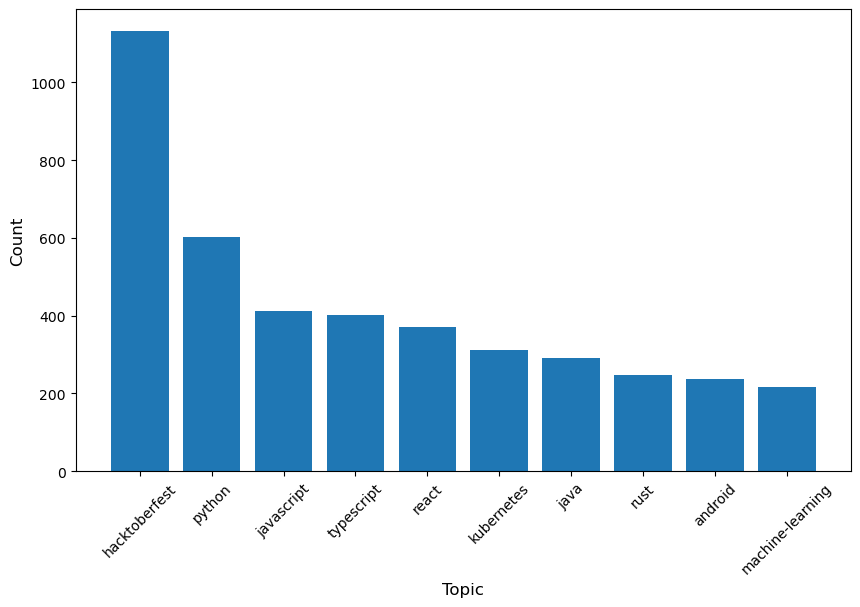
The top 10 topics cover multiple domains, reflecting the diverse interests of the open-source community. Among them, hacktoberfest — a GitHub open-source event that encourages developers to contribute code — leads significantly with 1,132 occurrences, showcasing the welcoming nature of many projects toward contributors. Topics such as Python, JavaScript, TypeScript, Java, and Rust highlight the popularity of these programming languages in open-source software development. Additionally, Kubernetes and machine-learning are among the highly recognized topics, indicating strong community interest in these areas.
6.2.2 The Total OpenRank Trend of Popular Topics' Repositories
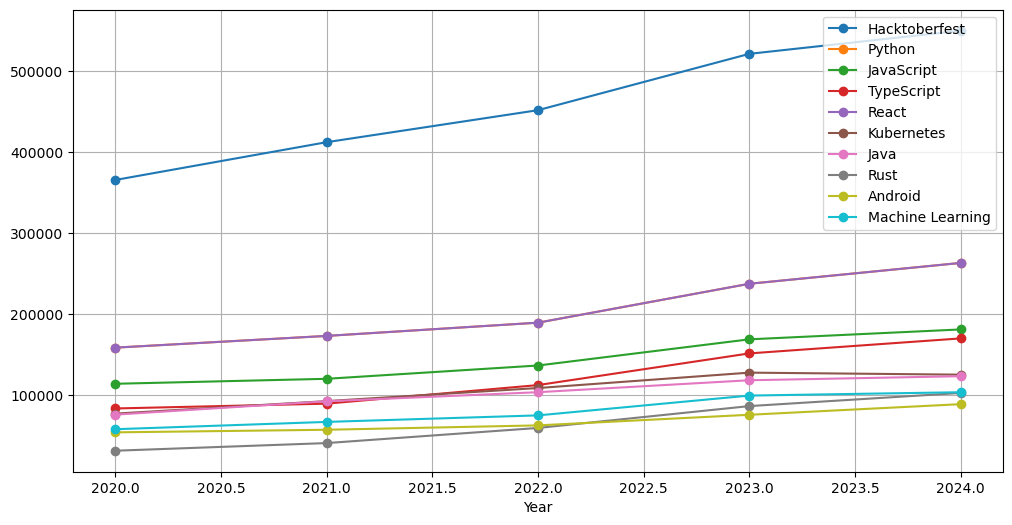
- From 2020 to 2024, Hacktoberfest's OpenRank has shown significant growth. The goal of Hacktoberfest is to encourage more people to participate in open-source projects, reflecting the enthusiasm for open-source initiatives, community engagement, and contributions.
- Python and React have steadily risen, indicating their continued popularity. JavaScript and TypeScript have shown stable growth, highlighting the ongoing demand for front-end and application development.
- The growth of Kubernetes and Machine Learning reflects advancements in the fields of cloud computing and artificial intelligence.
- Other technologies, such as Java, Rust, and Android, have experienced moderate growth, indicating stability in mature technology markets.
6.3 Database Project Analysis
This section analyzes the growth trend of the database field in terms of OpenRank, Activity and other indicators in the past five years, as well as the concentration trend of the top 10 projects. It also quotes the open source database information disclosed in Database of Databases and DB-Engines Ranking. The focus area is divided into 18 categories according to the database structure and purpose of the database, namely Relational, Key-Value, Document, Wide Column, Search Engine, Time Series, Vector, Graph, Object Oriented, Hierarchical, RDF, Array, Event, Spatial, Columnar, Native XML, and Content. The collaboration log data of the corresponding open source projects on GitHub are collected and analyzed.
6.3.1 Growth Trends in the Database Domain Over the Past Five Years and the Changing Trends in the Concentration of Top 10 Leading Projects
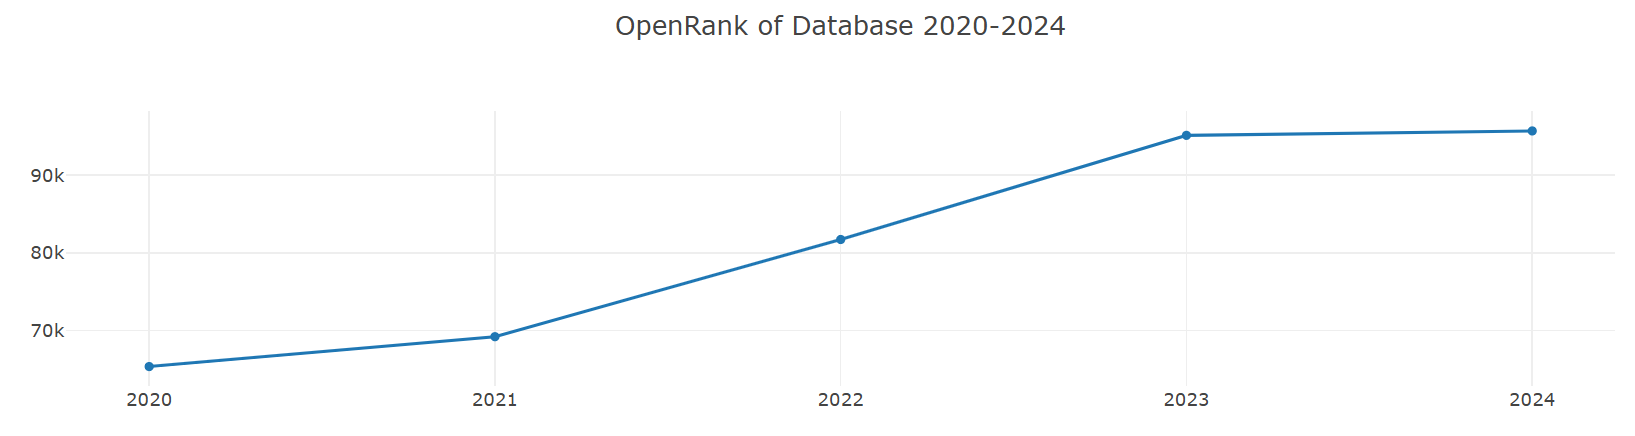
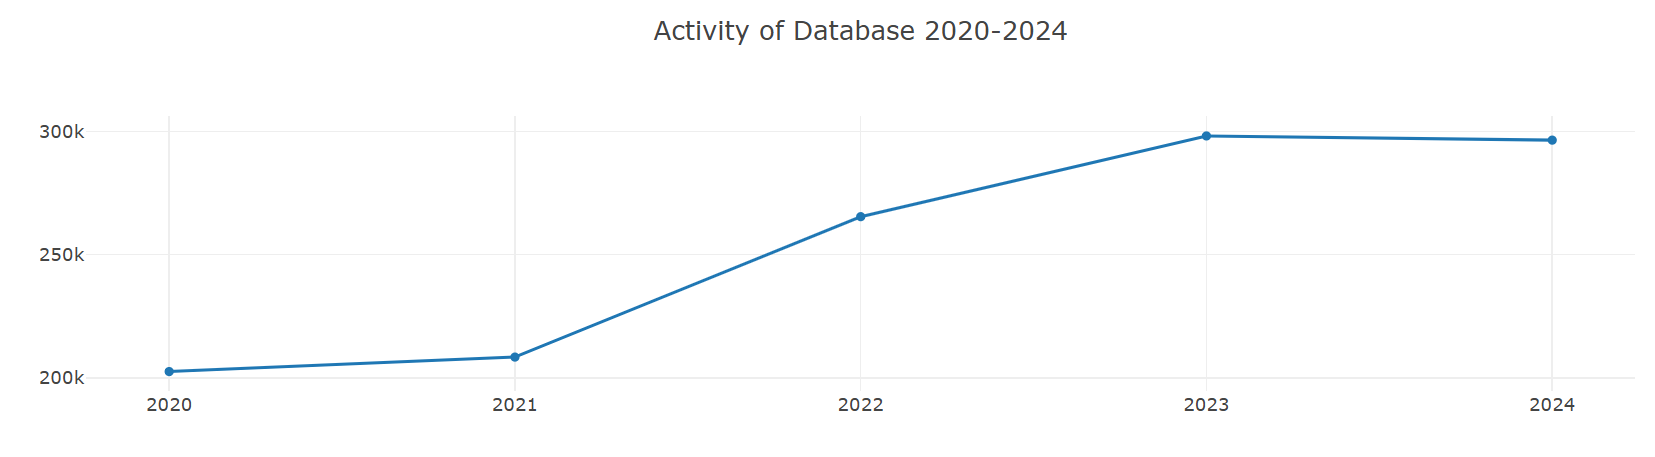
1. Analysis of Concentration Changes in Leading Projects in the Database Domain
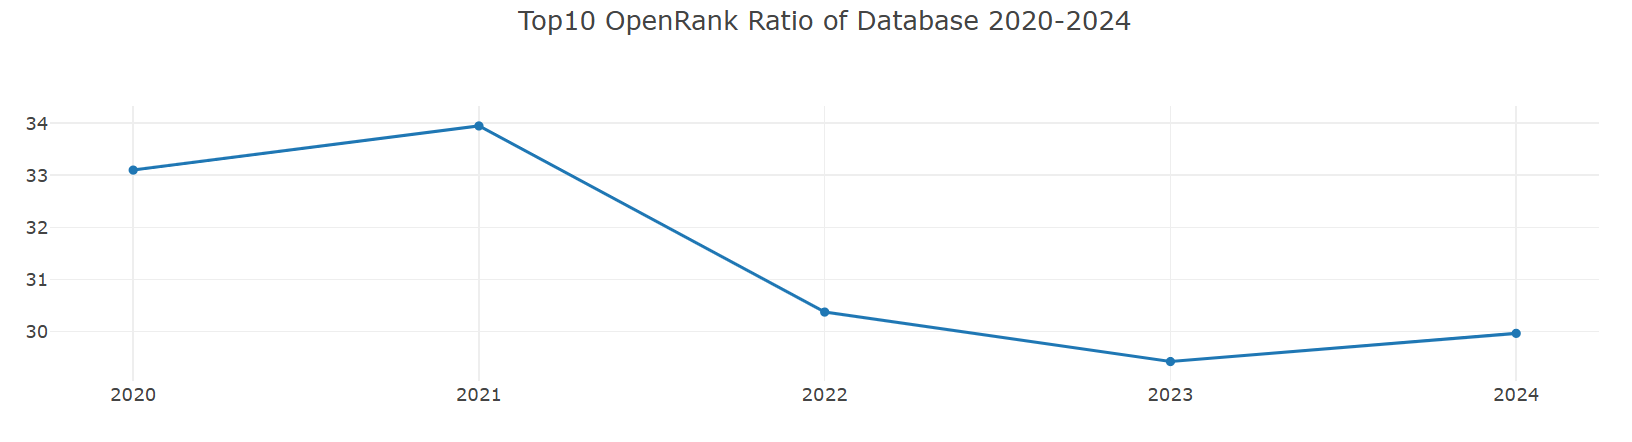
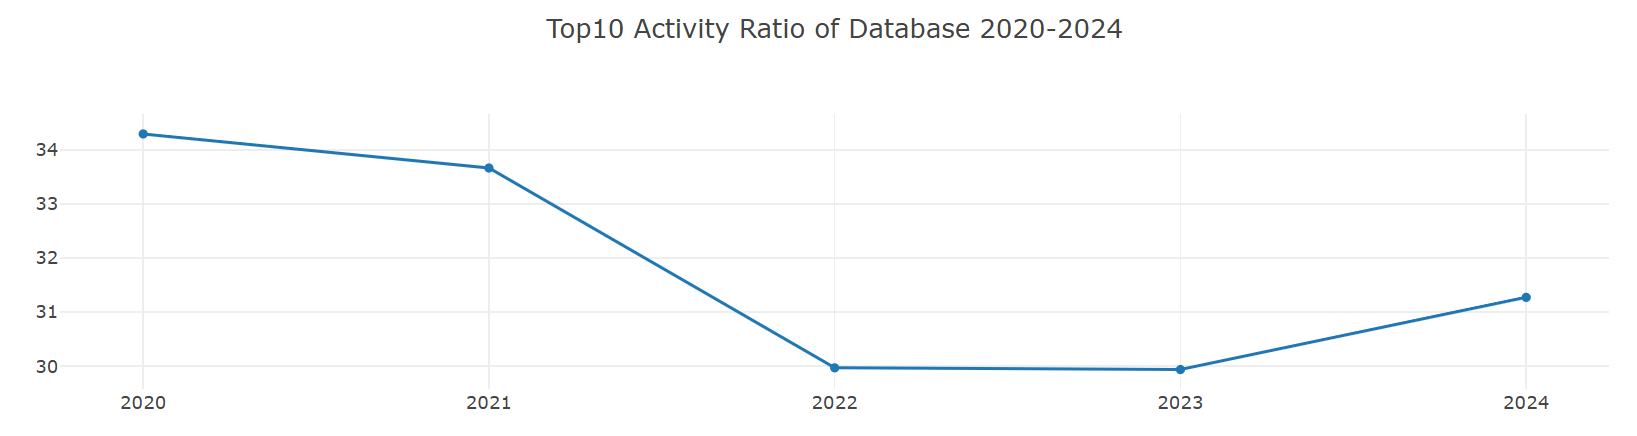
Over the past five years, the concentration of OpenRank and concentration of Activity for the Top 10 leading projects in the database domain have remained within the range of [29%, 35%]. However, in the most recent three years (2022-2024), there has been a decline of approximately 3 percentage points compared to 2020 and 2021, with a slight rebound observed in 2024. Specifically:
- The concentration of OpenRank reached its peak in 2021 at 33.9455%, and dropped to its lowest point in 2023 at 29.42372%.
- The concentration of Activity peaked at 34.29604% in 2020 and fell to its lowest point of 29.96794% in 2022.
This indicates that the concentration of top database projects shows a consistent change in both OpenRank and Activity metrics. Moreover, by comparing the peak and trough years and trends of the two metrics, it can be observed that OpenRank changes lag slightly behind Activity, with the time lag being roughly on a monthly to quarterly scale. This lag reflects the temporal logic between activity and influence in database top projects: changes in activity may occur earlier, while changes in influence gradually follow.
2. The Recovery of Concentration in 2024 and Future Trend Predictions
In 2024, all concentration metrics for leading projects showed an upward trend, and the month-on-month increase in Activity concentration was greater than that of OpenRank concentration. This phenomenon indicates that the resurgence in activity among top database projects will further drive the accumulation of influence. Based on past trends, it can be predicted that the OpenRank concentration in 2025 may accelerate its recovery, and the influence of leading projects over the entire domain will also significantly strengthen as a result.
As the influence of top projects increases, an important challenge they face is how to convert this influence into higher activity levels to further consolidate their position in the field. This dynamic relationship is particularly crucial for top projects to maintain an advantage in the increasingly competitive database sector.
3. Intensified Industry Competition and Resource Allocation Challenges
Looking at the OpenRank and Activity trends over the past five years, although the indicators for top projects have rebounded in 2024, overall growth has slowed. This suggests that competition for resources in the database sector is intensifying, and the pressure among leading projects is increasing. In this context, how to leverage existing advantages and maintain a leading position will be a critical issue for the future development of top projects.
Overall, the changes in concentration among leading projects in the database domain reveal the temporal relationship between activity and the dissemination of influence, while also reflecting the intensification of competition within the field. In the future, leading projects will need to place greater emphasis on resource integration and the conversion of influence to address domain competition and further solidify their central position in the database technology ecosystem.
6.3.2 Growth Trends in Various Subdomains of Databases Over the Past Five Years
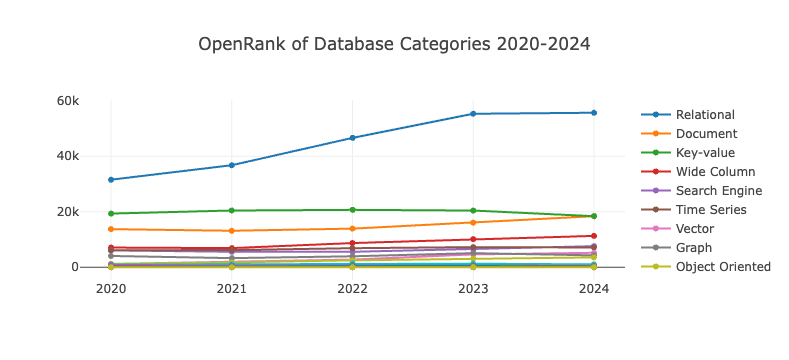
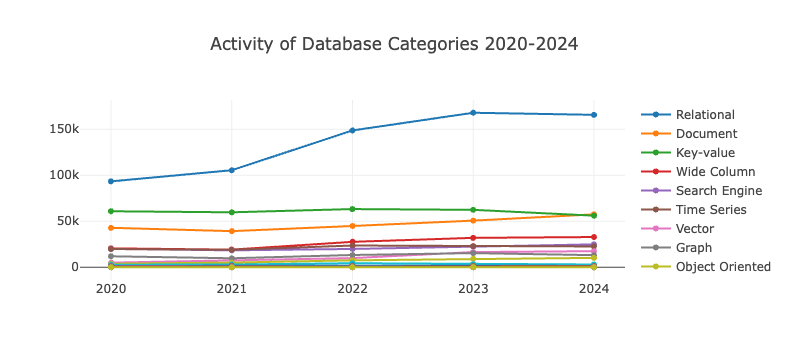
- The development of database categoriess has remained relatively stable over the past five years, with relational databases dominating the field. Although growth slowed in 2024, they still demonstrate strong dominance.
- Key-value databases saw a decline in influence and activity in 2024, with document databases catching up and even surpassing them to some extent.
- Document databases have maintained steady growth over the years. The top three database categories together account for over 70% of the total OpenRank and activity indicators in the database sector.
- As a sector that has existed since the birth of computing, databases have shown a stable development trend over the past five years. It is foreseeable that relational databases will continue to lead the industry, while various types of non-relational databases will serve as important branches in the long-term future.
6.3.3 OpenRank Rankings and Activity Rankings with Proportions in Database Subdomains
| Rank | Category | OpenRank | openrank_ratio(%) |
|---|---|---|---|
| 1 | Relational | 55440.5 | 41.334 |
| 2 | Document | 18780.1 | 14.0016 |
| 3 | Key-value | 18262 | 13.6154 |
| 4 | Wide Column | 11285.4 | 8.41389 |
| 5 | Search Engine | 7575.18 | 5.64772 |
| 6 | Time Series | 7111.37 | 5.30192 |
| 7 | Vector | 5187.47 | 3.86755 |
| 8 | Graph | 4262.87 | 3.17821 |
| 9 | Object Oriented | 3532.3 | 2.63353 |
| 10 | Hierarchical | 1036.42 | 0.772709 |
| 11 | RDF | 430.36 | 0.320857 |
| 12 | Array | 319.34 | 0.238086 |
| 13 | Event | 281.65 | 0.209986 |
| 14 | Spatial | 239.08 | 0.178248 |
| 15 | Columnar | 228.52 | 0.170374 |
| 16 | Native XML | 132.76 | 0.09898 |
| 17 | Content | 22.77 | 0.0169763 |
| Rank | Category | Activity | activity_ratio(%) |
|---|---|---|---|
| 1 | Relational | 166707 | 40.4575 |
| 2 | Document | 58567.1 | 14.2134 |
| 3 | Key-value | 57491.4 | 13.9524 |
| 4 | Wide Column | 32835.4 | 7.96871 |
| 5 | Search Engine | 24881.8 | 6.03848 |
| 6 | Time Series | 22610.5 | 5.48727 |
| 7 | Vector | 17463.4 | 4.23814 |
| 8 | Graph | 13128 | 3.18599 |
| 9 | Object Oriented | 10190.1 | 2.47299 |
| 10 | Hierarchical | 3021.28 | 0.733224 |
| 11 | RDF | 1405.37 | 0.341064 |
| 12 | Array | 1009.34 | 0.244953 |
| 13 | Spatial | 812.11 | 0.197088 |
| 14 | Event | 735.62 | 0.178525 |
| 15 | Columnar | 568.63 | 0.137999 |
| 16 | Native XML | 549.4 | 0.133332 |
| 17 | Content | 77.83 | 0.0188883 |
From the 2024 OpenRank and activity rankings across various categories in the database sector, the following observations can be made:
- Relational, Key-value, and Document databases consistently rank in the top three in both metrics. These top three categories collectively account for over 70% of the total metrics in the database sector.
- Relational databases dominate significantly, with their metrics exceeding the combined totals of the second to fifth places. They represent over 40% of the total metrics in the database sector, making it a super-large category.
- Columnar, as a newly listed database category, is experiencing rapid development momentum.
- Vector databases have also seen notable growth in 2024.
6.3.4 Open Source Quadrant Charts for Projects in Various Subdomains of the Database Field
The Open Source Quadrant Chart evaluates database categories based on three key metrics: Activity, OpenRank, and CommunityVolume. The CommunityVolume metric follows the same formula as the Attention metric in open-digger project, calculated as the weighted sum of stars and forks over a given time period: sum(1*star+2*fork).
Methodology for Quadrant Chart Construction:
- Select the top 10 projects from each database subfield based on Activity.
- Plot a
log(x)-log(y)scatter plot usinglog(openrank)-log(communityvolume), where the base of the logarithm is 2. This represents the number of half-lives required for the spatial influence (openrank) and temporal influence (communityvolume) to decay to 1. - Divide the plot into four quadrants using a vertical line corresponding to the mean of the horizontal coordinates (x-axis) of all points as the vertical axis, and a horizontal line corresponding to the mean of the vertical coordinates (y-axis) of all points as the horizontal axis.
There are 18 database categories in total. For the analysis, we selected 9 categories with an activity proportion greater than 1% in 2023: Relational, Key-value, Document, Wide Column, Search Engine, Time Series, Vector, Graph, and Object Oriented. The Open Source Quadrant Chart based on these categories is shown below:
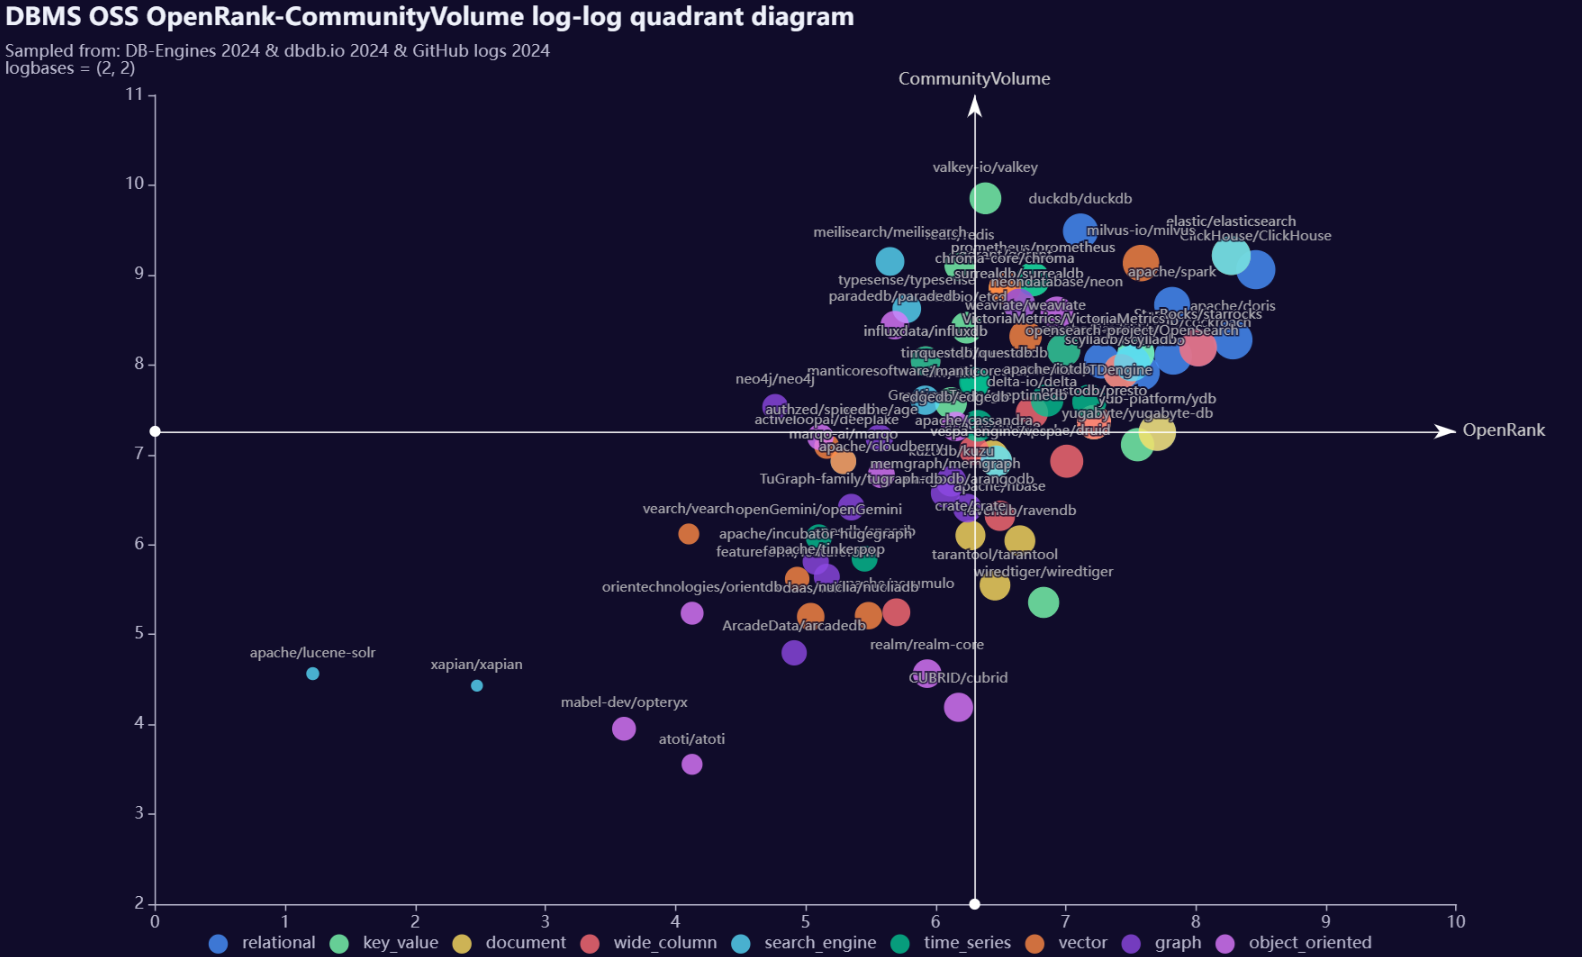
The Search Engine category exhibits significant polarization, with projects like ElasticSearch having both high OpenRank and CommunityVolume, while others like Lucene-Solr and Xapian have relatively low values in both metrics.
Insights from the First Quadrant: Relational, Document, Search Engine, Vector, and Wide Column databases exhibit strong OpenRank influence as well as high CommunityVolume engagement. In contrast, Object-Oriented and Graph databases show weaker performance in both aspects.
From the vertical distribution in the open-source quadrant chart of the top 9 subcategories by activity, it can be observed that subcategories such as key_value and search_engine, represented by projects like valkey and meilisearch, exhibit higher CommunityVolume relative to their OpenRank, indicating a stronger community presence and faster growth expectations compared to other subcategories. The vector subcategory shows a strong linear correlation between the log-log values of CommunityVolume and OpenRank for its top 10 projects, suggesting a balanced relationship between community presence and collaborative influence.
6.3.5 Analysis of Working Hours of Open Source Database Projects
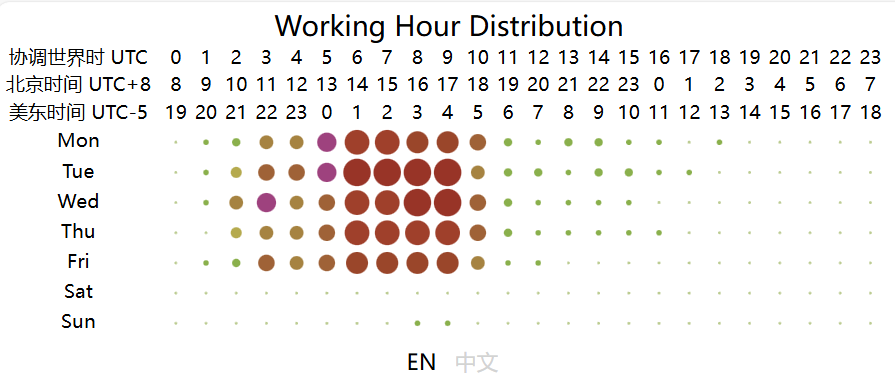
From the chart, it can be observed that the peak working hours for open-source database projects are mainly concentrated between 2:00 to 10:00 UTC from Monday to Friday, while the active hours span from 1:00 to 18:00 UTC from Monday to Friday. This pattern may be related to the fact that most database-related projects have corporate backing. Based on the active UTC time, the chart shows that the active time of the day begins at 2:00 UTC, reaching a peak time at 6:00 UTC and continuing until 10:00 UTC. At 11:00 UTC, activity significantly decreases, and by 18:00 UTC, the projects are no longer active. The two distinct peak time — 2:00 to 6:00 UTC and 6:00 to 10:00 UTC — correspond to the working hours in Asia and Europe, respectively (assuming a typical work start time of 9:00 local time, aligning with UTC+7 to UTC+3 and UTC+3 to UTC-1). As the overlap in working hours gradually decreases afterward, the work peak quickly diminishes. This analysis highlights the critical role of collaboration between Asia and Europe in the open-source database domain, underscoring the importance of their contributions to the field.
6.4 Project Analysis in the Field of Generative AI
After another year of industry development, generative AI has demonstrated new patterns of growth. Overall, the year 2024 has seen a slowdown in the development of the Generative AI (GenAI) field across the board. This is likely due to the fact that advancements in generative AI, particularly in the domain of large models, require massive investments in funding and computational resources. Following the incremental competition of 2022-2023, the AI industry in 2024 has shifted to competing in a saturated market. With the foundational frameworks of various AI products now largely complete, the focus of development has gradually transitioned from expansion to refining and evolving product forms. Additionally, as leading projects mature and find practical applications, we anticipate that the development of generative AI in 2025 will enter a new phase of equilibrium.
6.4.1 Growth Trends of GenAI Categories in the Past Five Years
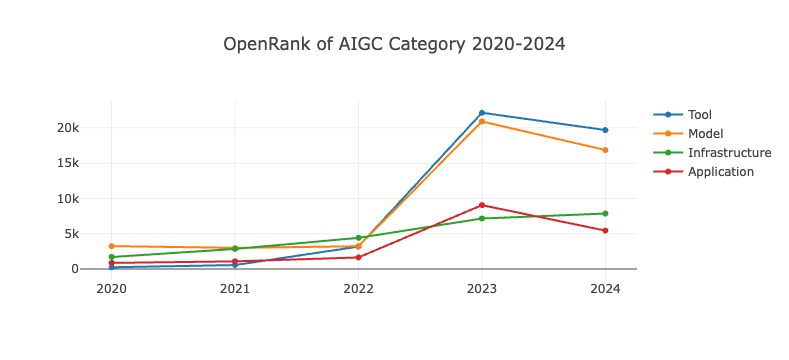
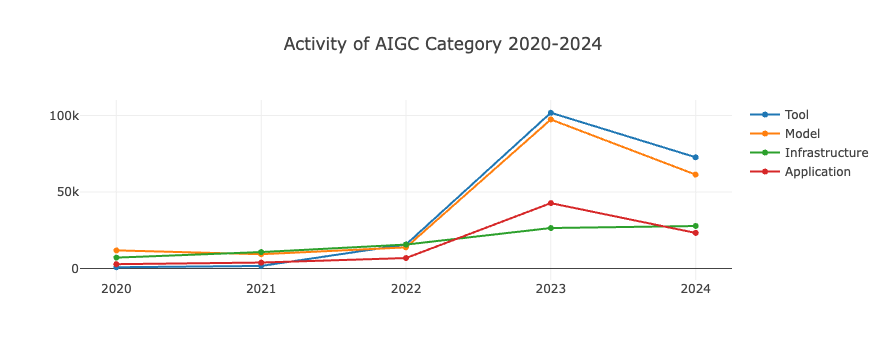
- Across different category classifications, the activity and influence of various generative AI projects have declined to some extent.
- The influence and activity level of GenAI tool-based open-source projects are significantly higher than those of model-based and application-based projects.
- The influence of model projects grew rapidly starting in 2022, surpassing infrastructure projects in 2023, marking a breakthrough year for GenAI innovation and application development. However, growth slowed in 2024, possibly indicating that the development of generative AI has stabilized in recent times.
6.4.2 Generative AI Projects: OpenRank and Top 10 Activity Trends
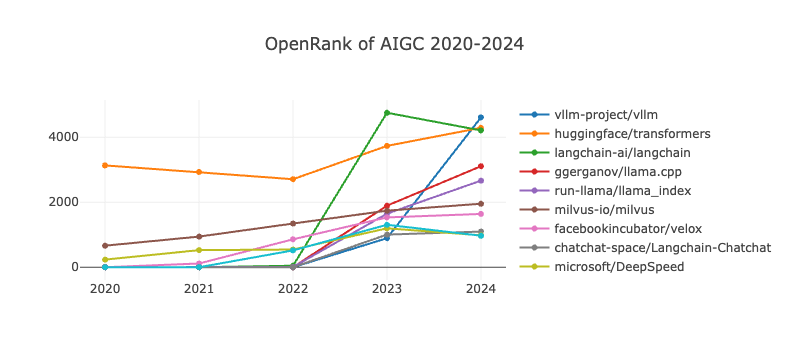
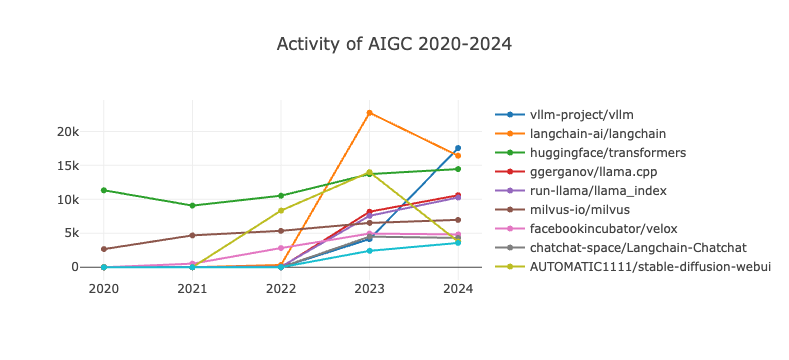
- vLLM ranks first in both influence and activity, drawing significant attention from developers.
- langChain has seen a decline in both influence and activity rankings in the new year but still maintains a relatively high position.
- transformers, as the foundation of modern AI since their inception, continue to enjoy high attention in the latest year. Despite challenges from newer architectures like mamba, transformers remain at the core of large-model AI.
- stable-diffusion-webui showed strong growth momentum in 2023 and was once considered a major challenger to transformers. However, its various metric indicators have declined in 2024, yet it still has not shaken transformers' dominance.
- Langchain-Chatchat, as a locally deployed knowledge repository, has maintained a steadily ascending developmental trajectory into the year 2024.
6.4.3 2024 Top 10 Generative AI Projects by OpenRank and Activity
| Rank | Project | OpenRank |
|---|---|---|
| 1 | vllm-project/vllm | 4611 |
| 2 | huggingface/transformers | 4212.26 |
| 3 | langchain-ai/langchain | 4292.13 |
| 4 | ggerganov/llama.cpp | 3110.07 |
| 5 | run-llama/llama_index | 2665.89 |
| 6 | milvus-io/milvus | 1955.52 |
| 7 | facebookincubator/velox | 1641.14 |
| 8 | chatchat-space/Langchain-Chatchat | 1097.79 |
| 9 | microsoft/DeepSpeed | 983.42 |
| 10 | invoke-ai/InvokeAI | 971.2 |
| Rank | Project | OpenRank |
|---|---|---|
| 1 | vllm-project/vllm | 17556.02 |
| 2 | langchain-ai/langchain | 16413.39 |
| 3 | huggingface/transformers | 14454.74 |
| 4 | ggerganov/llama.cpp | 10599.61 |
| 5 | run-llama/llama_index | 10272.5 |
| 6 | milvus-io/milvus | 6978.76 |
| 7 | facebookincubator/velox | 4832.71 |
| 8 | chatchat-space/Langchain-Chatchat | 4315.73 |
| 9 | AUTOMATIC1111/stable-diffusion-webui | 3782.55 |
| 10 | getcursor/cursor | 3579.97 |
7. Developer Insights
Developers are the core driving force behind the continuous growth of the open-source ecosystem. They are not only the creators and promoters of technological innovation but also serve as a crucial foundation for the collaborative mechanisms within open-source communities. The overall number of developers, their level of contribution activity, and their modes of collaboration have a profound impact on the prosperity and development of open-source projects. This section takes a global perspective, conducting an in-depth analysis of individual developer data and comparing trends across different countries and regions to reveal the distribution patterns and evolving dynamics of open-source developers worldwide.
7.1 Developers' Geographical Distribution
The 2024 analysis continues the research methodology of previous studies while incorporating richer and more refined data sources. This study covers a sample of 12 million active developers on GitHub, among whom approximately 2.55 million have accurately provided their geographic location information, accounting for 2% of GitHub’s total registered user base of around 120 million. Although this sample represents only a subset of all registered users, improvements in data quality and the expansion of the sample size provide a more representative and reliable perspective for analyzing the global distribution of developers and regional collaboration patterns.
7.1.1 Geographic Distribution of Active GitHub Developers
From a global perspective, the distribution of active GitHub developers has distinct regional characteristics, as shown in the figure below.
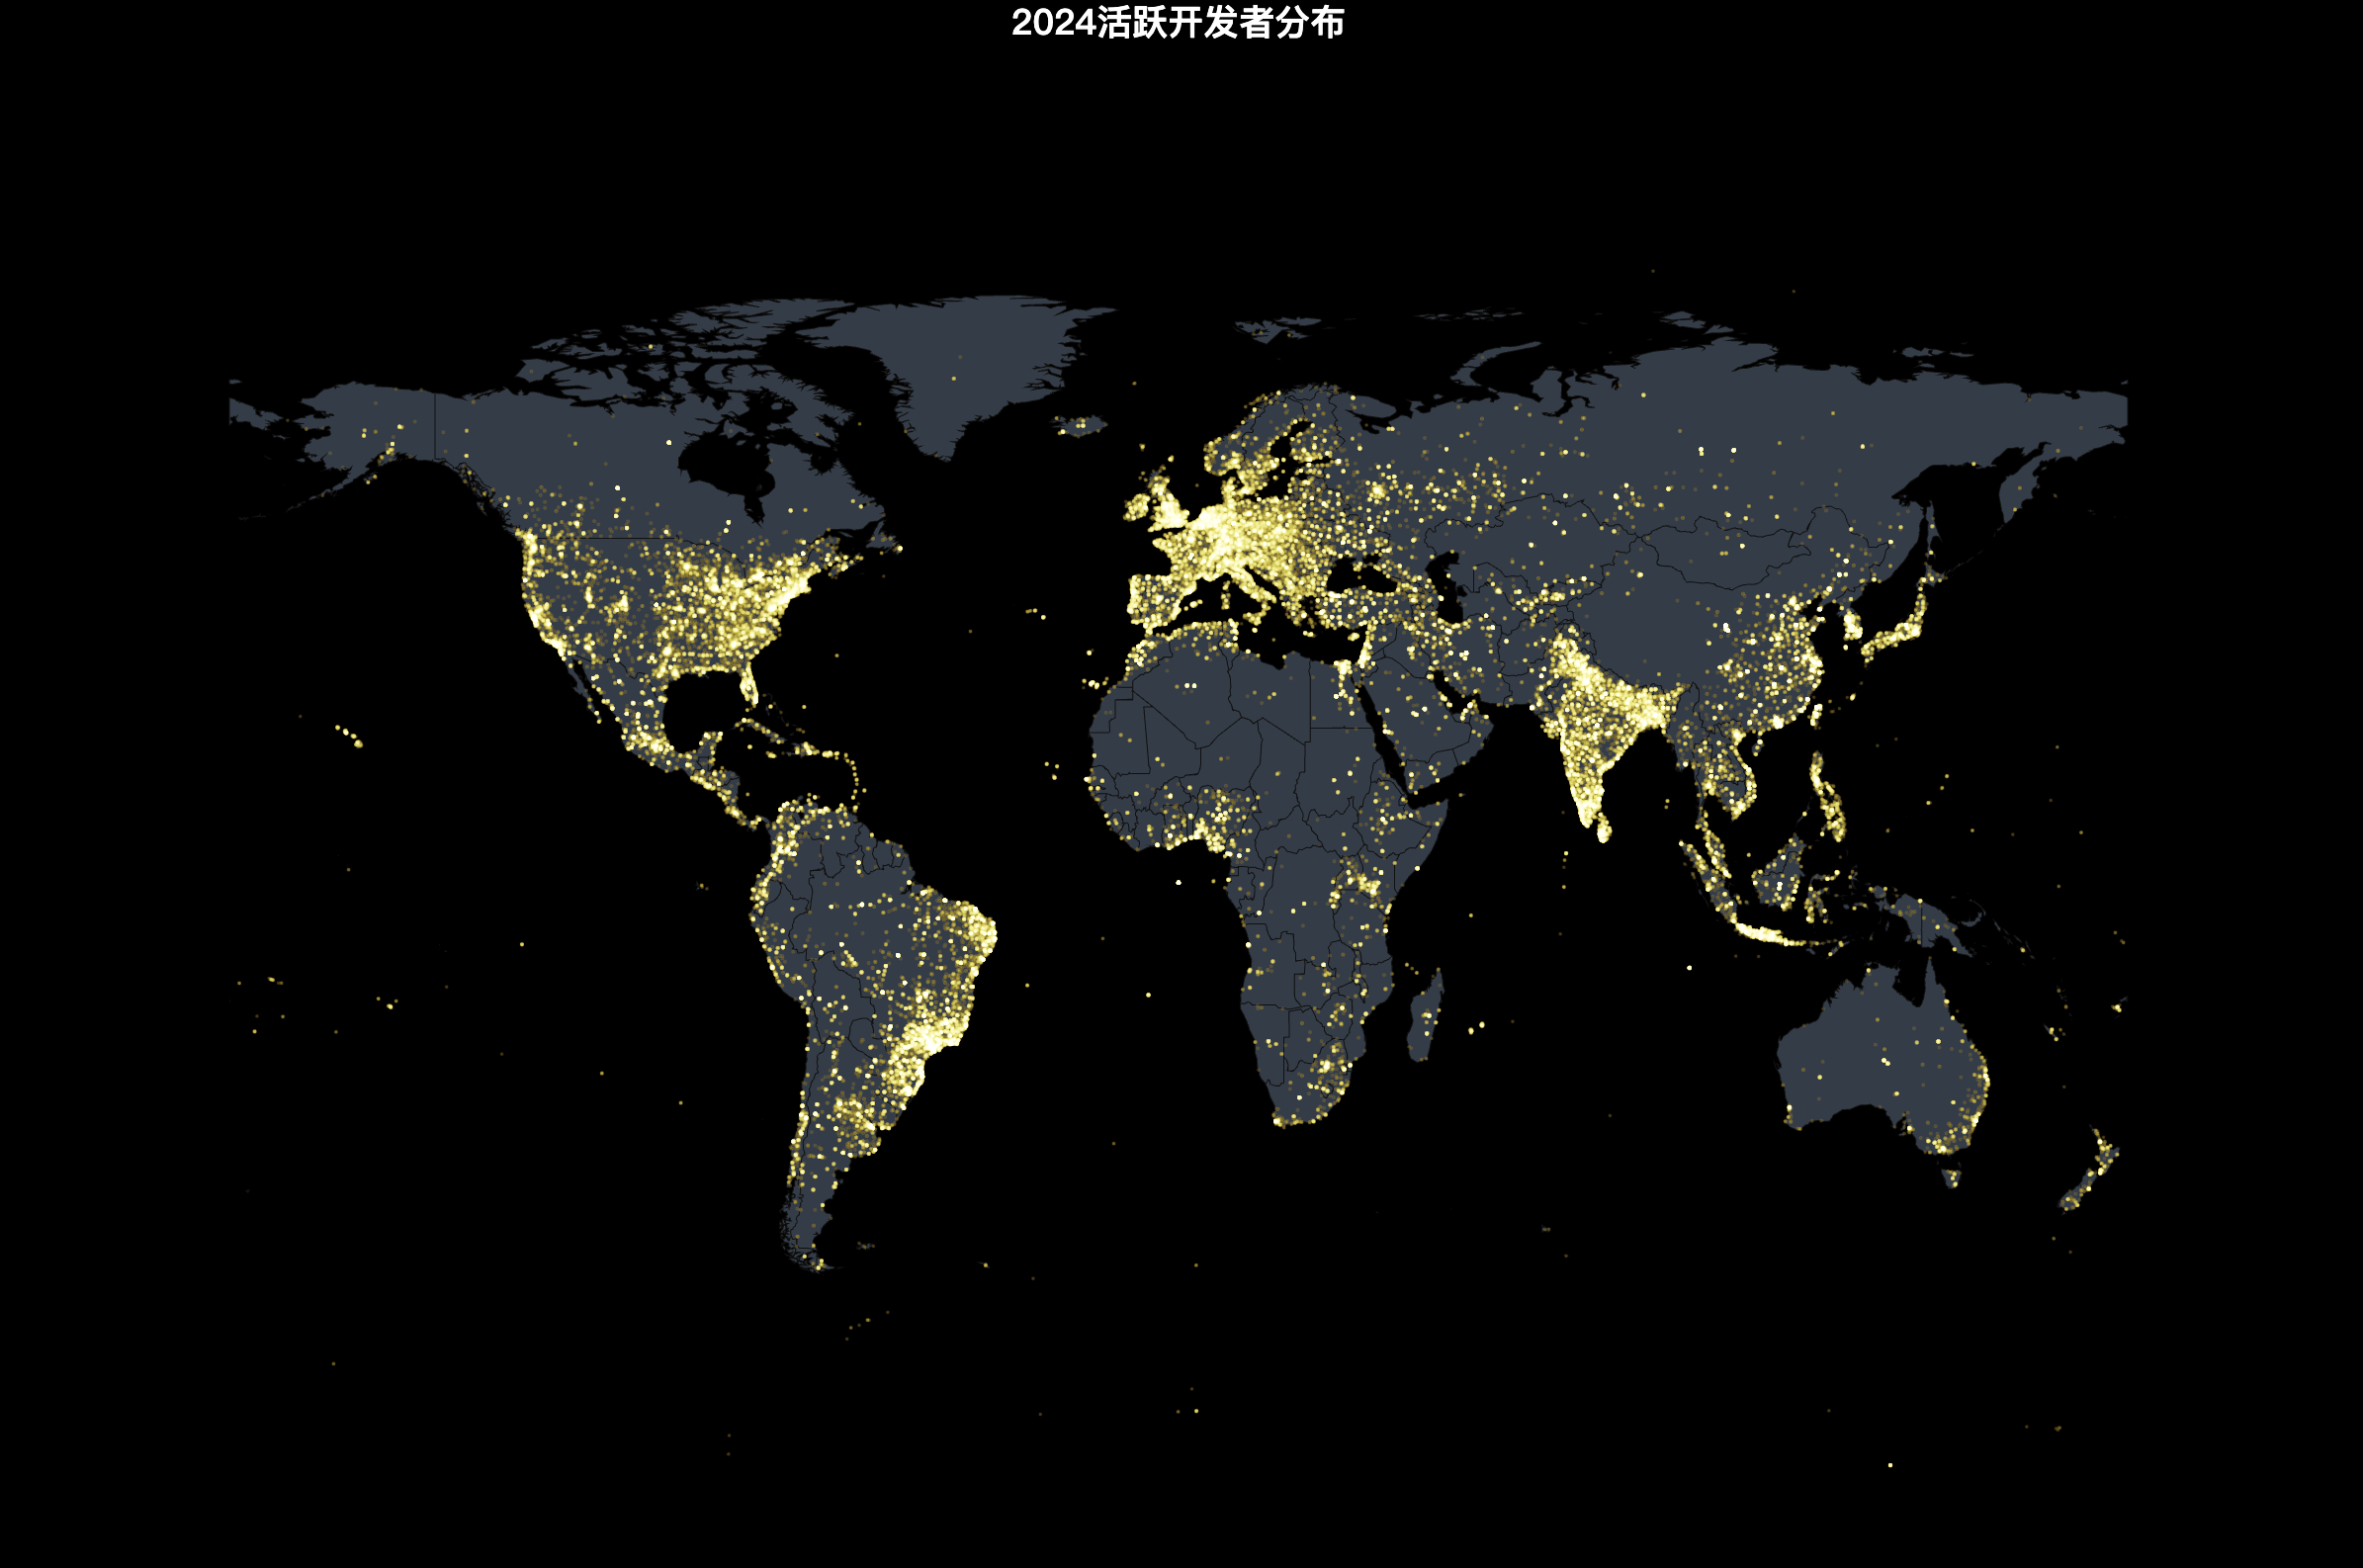
Globally, developers are primarily concentrated in densely populated areas with well-developed internet infrastructure, such as:
- Coastal city clusters in China
- Tech hubs on the East and West coasts of the United * States
- Major economic centers in Europe
- High-tech industry clusters in India
- Metropolitan areas in southeastern Brazil
These regions boast a large pool of technical talent and a well-established tech industry ecosystem, providing strong support for open-source development activities. In contrast, in sparsely populated areas or regions with underdeveloped internet infrastructure—such as deserts, mountainous areas, and polar regions—developers are relatively scarce or even nonexistent. This pattern not only reflects the current global distribution of technological resources but also highlights the imbalance in digital economic development.
Notably, certain regions in emerging economies—such as parts of Southeast Asia and Africa—have seen a growing number of active developers in recent years. With the increasing global internet penetration and the expansion of technology education, open-source development activities are gradually extending beyond traditional tech hubs into emerging markets, injecting new vitality and diversity into the global open-source ecosystem.
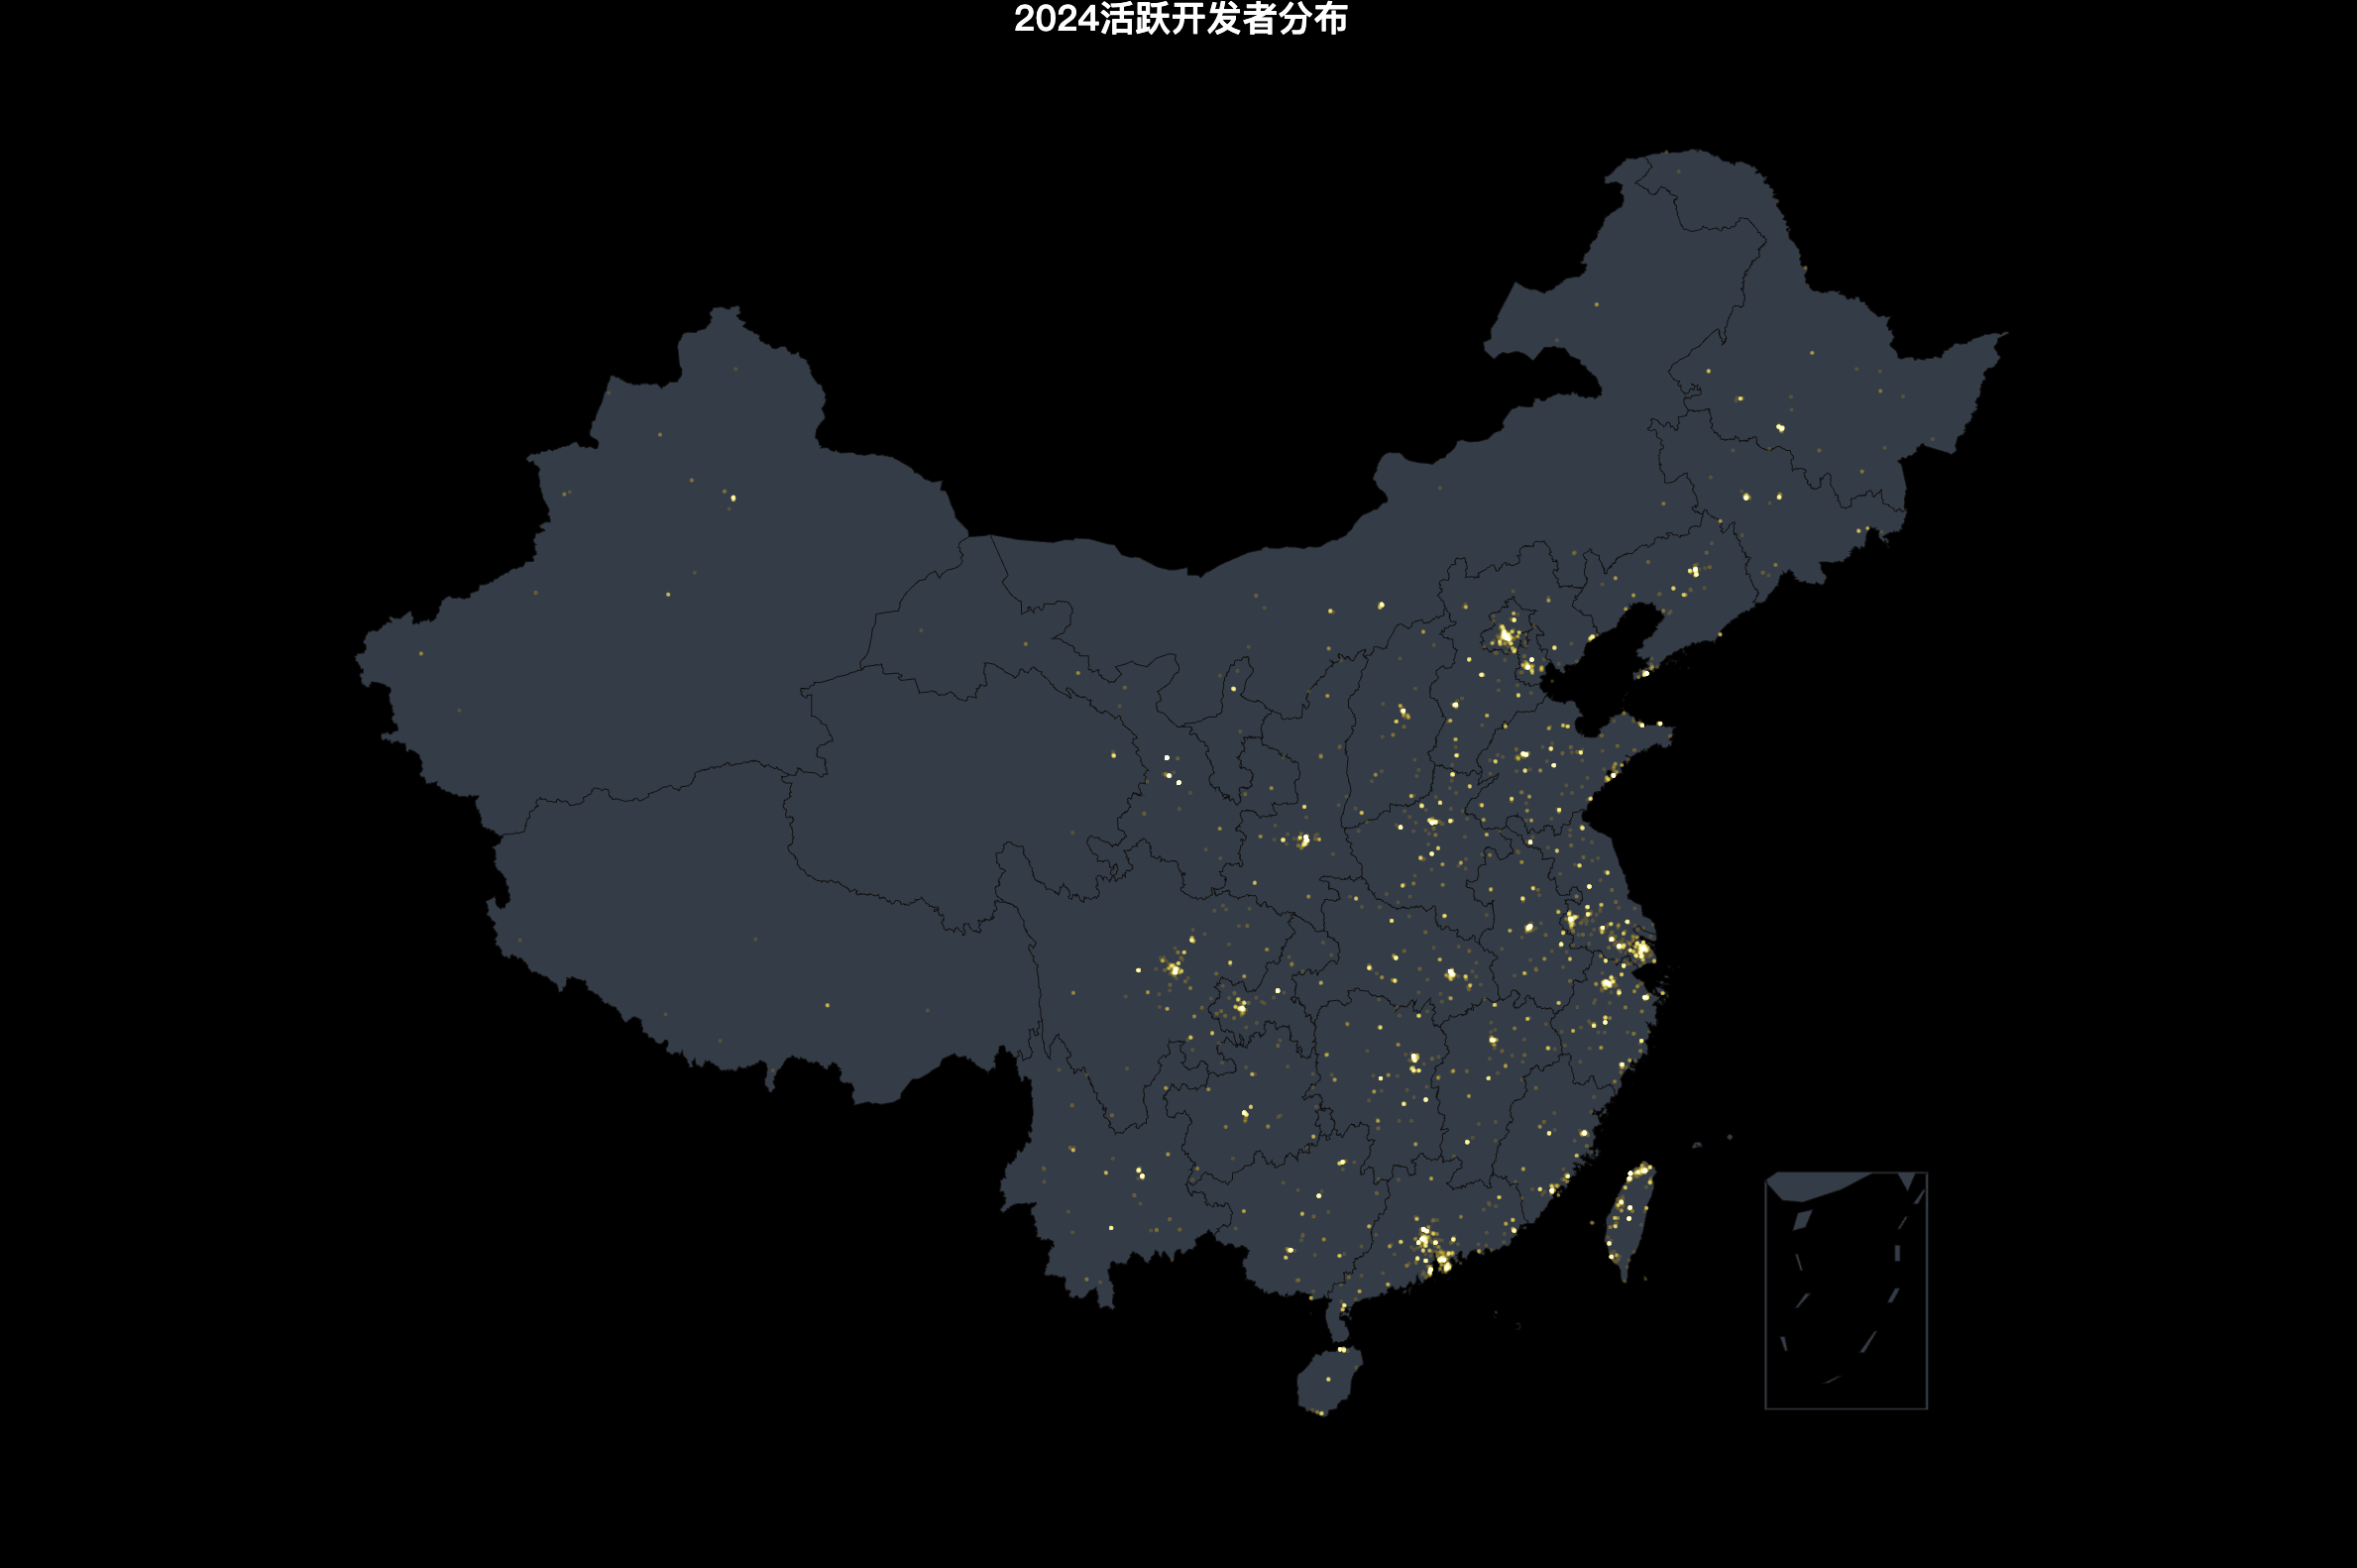
7.1.2 Active GitHub Developers by Country/Region
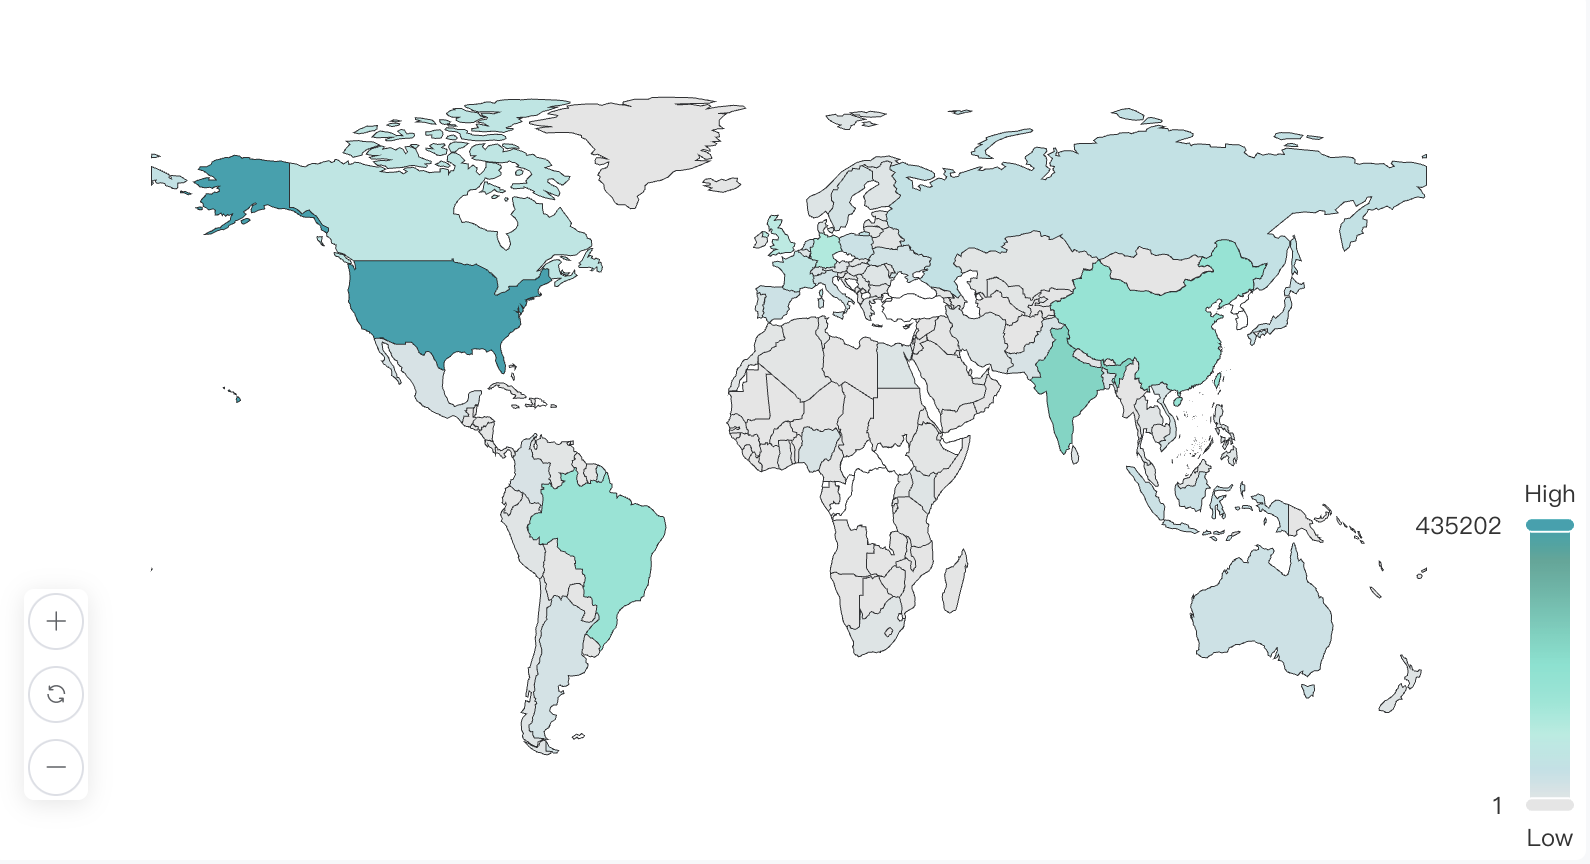
| Rank | Country/Region | 2024 Count | 2023 Count | Growth Count | Growth Rate (%) |
|---|---|---|---|---|---|
| 1 | United States | 22,233,197 | 18,326,730 | 3,906,467 | 21.32 |
| 2 | European Union | 17,281,528 | 14,086,752 | 3,194,776 | 22.68 |
| 3 | India | 15,209,709 | 11,443,487 | 3,766,222 | 32.91 |
| 4 | China | 9,404,966 | 8,863,326 | 541,640 | 6.11 |
| 5 | Brazil | 4,812,874 | 3,736,602 | 1,076,272 | 28.80 |
| 6 | United Kingdom | 3,796,457 | 3,110,915 | 685,542 | 22.04 |
| 7 | Russia | 3,404,378 | 2,790,032 | 614,346 | 22.02 |
| 8 | Indonesia | 3,321,239 | 2,518,881 | 802,358 | 31.85 |
| 9 | Germany | 3,316,461 | 2,676,735 | 639,726 | 23.90 |
| 10 | Japan | 3,221,378 | 2,471,377 | 750,001 | 30.35 |
From the data, it is evident that the number of active GitHub developers in major countries worldwide has significantly increased in 2024 compared to 2023. This indicates a further rise in global open-source ecosystem activity. Possible driving factors include increased internet penetration, the promotion of technical education, and the growing willingness of both enterprises and individuals to participate in open-source projects. Below is a detailed analysis of each country's performance and key highlights:
Country with the Largest Number of Developers Worldwide: United States
The United States ranks first globally with 22,233,197 developers, experiencing a growth of 3,906,467, representing a growth rate of 21.32%. As a global leader in technology, the U.S. continues to solidify its central role in the global open-source ecosystem, supported by robust technological infrastructure and a mature open-source culture.Fastest-Growing Country: India
India's developer count reached 15,209,709 in 2024, with an increase of 3,766,222, marking a growth rate of 32.91%, making it the fastest-growing country in terms of developer population globally. India's rapid rise is attributed to significant improvements in internet penetration, a vast pool of technical talent, and strong support from both the government and private sector for technology education.Major Country with the Lowest Growth Rate: China
China ranks fourth with 9,404,966 developers, but its growth rate is only 6.11%, the lowest among all major countries, with an increase of 541,640 developers. Despite maintaining a leading position in total developer numbers, the slowdown in growth is linked to the rise of domestic open-source hosting platforms and the localization trend within the open-source ecosystem.Standout Region: European Union
The European Union (EU) ranks second with 17,281,528 developers, adding 3,194,776 new developers, representing a growth rate of 22.68%. As a cluster of multiple developed economies, Europe has long maintained a leading position in open-source technology and collaboration, and its growth in developers continues to reflect the region's strong technological innovation capabilities.Rapid Growth in Emerging Markets: Brazil and Indonesia
- Brazil ranks fifth with 4,812,874 developers, a growth rate of 28.80%, and an increase of 1,076,272 developers. Brazil's high growth rate highlights the strong potential of Latin American countries in the open-source field.
- Indonesia has a relatively small total number, but its growth rate is as high as 31.85%, with an increase of 802,358 developers, indicating the rapidly growing participation and influence of Southeast Asian countries in the open-source ecosystem.
Notable Performers: Japan and Germany
- Japan ranks tenth with 3,221,378 developers, a growth rate of 30.35%, demonstrating its strong technical culture and continued support for open-source projects.
- Germany ranks ninth with 3,316,461 developers, a growth rate of 23.90%, further solidifying its leading position in Europe's technology sector.
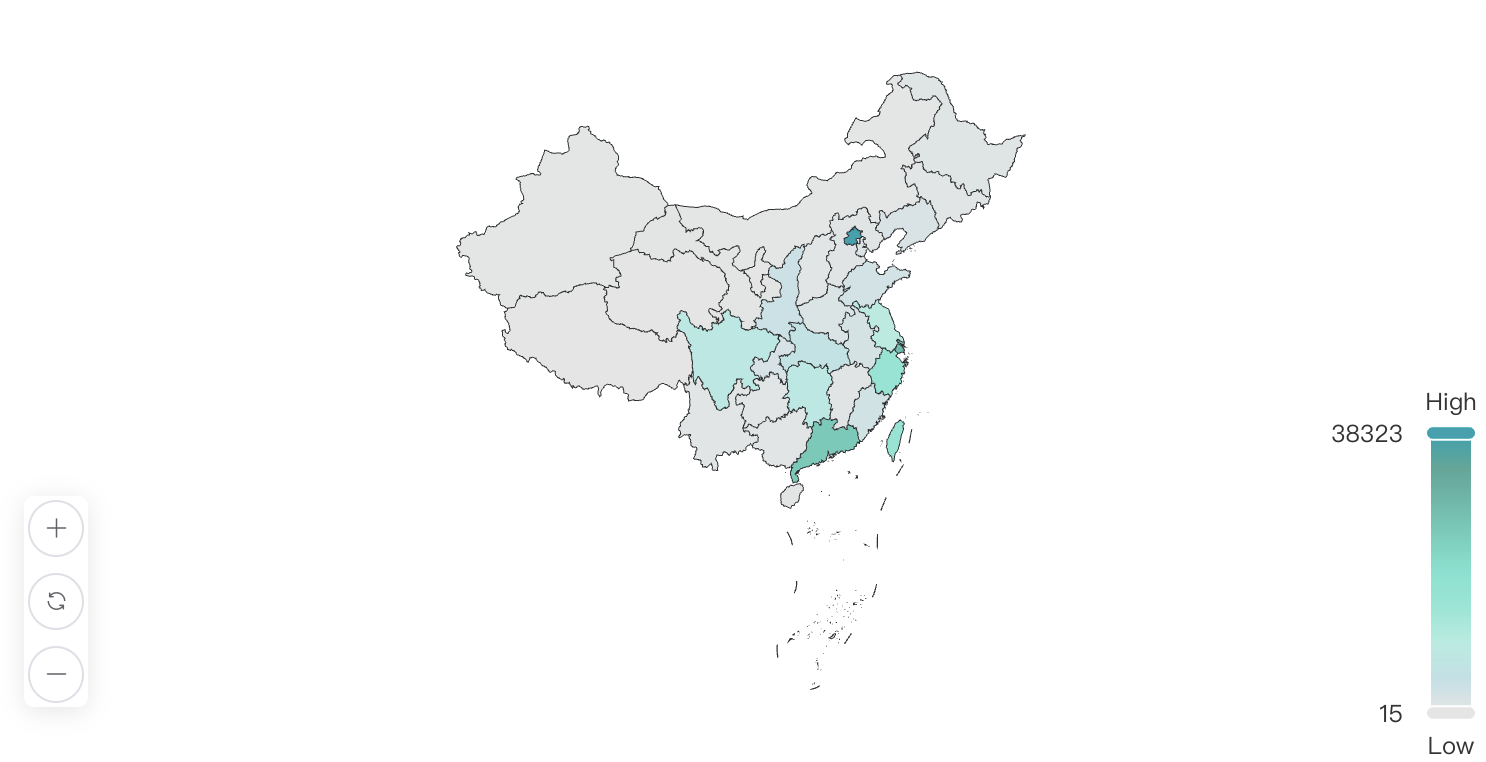
| Rank | Region | 2024 Count | 2023 Count | Growth Count | Growth Rate (%) |
|---|---|---|---|---|---|
| 1 | Beijing | 38,323 | 24,151 | 14,172 | 58.69 |
| 2 | Shanghai | 28,393 | 18,215 | 10,178 | 55.86 |
| 3 | Guangdong | 24,959 | 16,153 | 8,806 | 54.51 |
| 4 | Taiwan | 15,894 | 8,823 | 7,071 | 80.15 |
| 5 | Zhejiang | 15,816 | 10,927 | 4,889 | 44.74 |
| 6 | Jiangsu | 9,369 | 5,437 | 3,932 | 72.34 |
| 7 | Sichuan | 8,186 | 5,311 | 2,875 | 54.14 |
| 8 | Hongkong | 6,625 | 3,344 | 3,281 | 98.10 |
| 9 | Hubei | 5,732 | 3,273 | 2,459 | 75.13 |
| 10 | Shaanxi | 3,669 | 1,993 | 1,676 | 84.11 |
This table shows the changes in the number of active developers on GitHub in various regions of China between 2023 and 2024, including the total number of developers, the number of increases, and the growth rate. These data reveal the participation of different regions in China in the open source ecosystem and their development speed. The following are the main highlights and trend analysis:
1. Key Region Analysis
- Beijing, Shanghai, and Guangdong firmly occupy the top three positions, with 38,323, 28,393, and 24,959 developers, respectively. As China's core technology and economic hubs, these regions have attracted a large number of technical talents, making them major contributors to the open-source ecosystem.
- Taiwan and Zhejiang rank fourth and fifth, with 15,894 and 15,816 developers, respectively, highlighting their significant roles in cross-strait technological development.
2. Highlights in Growth and Growth Rate
Highest Absolute Growth: Beijing Beijing added 14,172 developers, with a growth rate of 58.69%, maintaining its top position nationwide. This indicates that Beijing, as China's center for technological innovation, continues to rapidly expand its technical talent pool, solidifying its leading role in the open-source ecosystem.
Highest Growth Rate: Hong Kong Hong Kong's growth rate reached an astonishing 98.10%, nearly doubling, with an increase of 3,281 developers. This suggests that Hong Kong's open-source development ecosystem is rapidly emerging, likely due to its enhanced position and resource investment in international technology strategies.
Outstanding Performers
- Jiangsu: Added 3,932 developers, with a growth rate of 72.34%, showcasing the technological development potential of the Yangtze River Delta region.
- Hubei: Added 2,459 developers, with a growth rate of 75.13%, demonstrating the rapid rise of technological capabilities in central China.
- Shaanxi: Added 1,676 developers, with a growth rate of 84.11%, indicating that the western region's technology ecosystem is quickly catching up with national development trends.
3. Regional Development Trends
North China, East China, and South China: Dominance in Developer Numbers Beijing, Shanghai, Guangdong, Zhejiang, and other regions are the most economically developed areas in China and home to the most mature internet industries. These regions provide superior resources and environmental support for open-source development, resulting in significantly higher developer numbers.
Central and Western Regions: Impressive Growth Rates Although the total number of developers in central and western regions like Hubei and Shaanxi is relatively small, their growth rates exceed 75%, showcasing the rapid rise of technological capabilities in these areas. This trend indicates that China's open-source ecosystem is gradually extending from coastal regions to inland areas, achieving more balanced regional development.
Overall, the regional distribution of China's open-source ecosystem exhibits a dual characteristic of "stable growth in key regions and rapid rise in emerging regions." With the rapid expansion of technological capabilities in central and western regions and the emergence of international hubs like Hong Kong, China's open-source ecosystem is becoming more diversified and balanced in its regional development.
7.2 Developer Work Time Analysis
This section analyzes the working hours of developers on GitHub and Gitee. The time in this section is based on UTC, which is 8 hours behind the UTC+8 time zone. The data is normalized to the [1-10] range using the min-max scaling method by default. In the time zone charts, the larger the dot area, the higher the value it represents.
7.2.1 Holistic Developer Working Hours Distribution
1 - GitHub Holistic Developer Working Hours Distribution
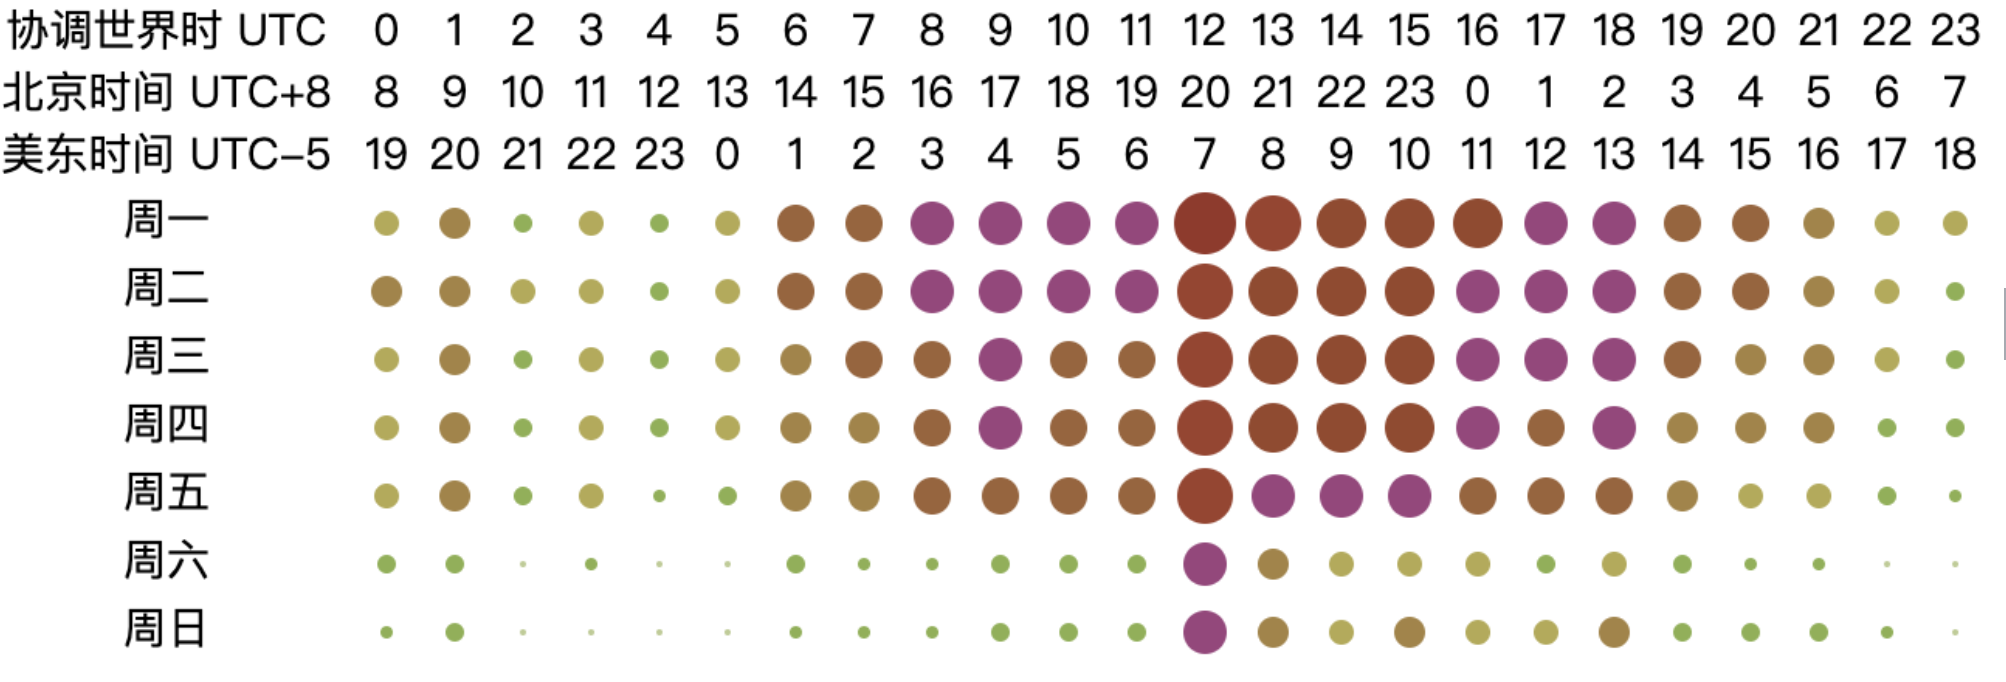
By analyzing the distribution of working hours of holistic developers in GitHub, we can find that developers’ active hours are mainly concentrated between 6:00 and 21:00, and reach a significant peak at 12:00, which may be related to the triggering of scheduled tasks. In addition, the activity on Saturdays and Sundays is relatively low, indicating that developers’ working frequency on weekends has decreased.
2 - Gitee Holistic Developer Working Hours Distribution
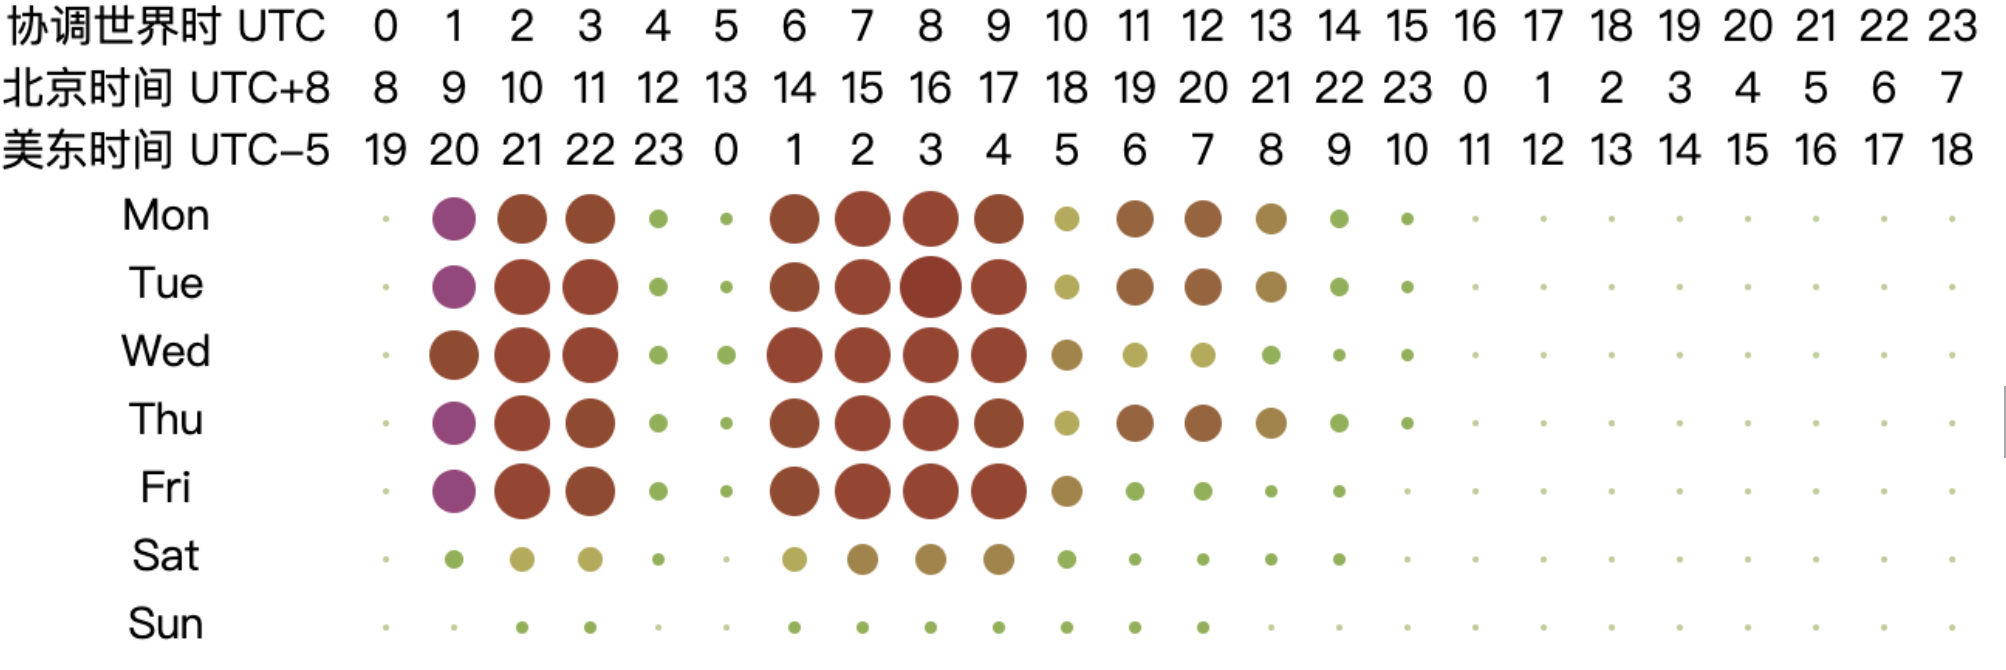
The data clearly indicates that the active hours of developers on the Gitee platform align more closely with the daily routine of the UTC+8 time zone. This characteristic is closely related to the user demographic of Gitee as a domestic code hosting platform in China. Since the majority of Gitee's users are concentrated in China and East Asia, the distribution of developers' active hours reflects the typical work and lifestyle rhythms of this region. Specifically, the peak working hours for developers generally occur between 9:00 AM and 8:00 PM, which largely coincides with the standard working hours in the UTC+8 time zone. Additionally, there is a slight dip in activity during lunch and dinner times, further indicating that developers' work habits are consistent with the daily routines in East Asia. Moreover, compared to global platforms like GitHub, the decline in developer activity on weekends is more pronounced on Gitee, which may reflect the cultural tendency of Chinese developers to rest or engage in non-work-related activities during weekends.
3 - Holistic Developer Working Hours Distribution Excluding Bot Data
After filtering out bot data, the distribution of developers' working hours shows a more realistic and natural pattern. The data shows that developers are active mainly between 6pm and 21pm, a time zone where activity is significantly higher and more evenly distributed. This suggests that developers' work habits and actual activity trajectories are more clearly reflected after the interference of automated behaviours is excluded.
This distributional feature is highly consistent with the daily routine of human developers, which usually corresponds to the morning to evening work period. This pattern suggests that the vast majority of developers tend to code, collaborate, and contribute to open source projects during the main working hours of the day, while their activity decreases significantly during the late night and early morning hours. In addition, the even distribution of working hours may indicate that developers process tasks at a smoother pace, avoiding bursts of behaviour that are overly focused on particular points in time.
7.2.2 Project Working Hours Distribution
1 - Working Hours Distribution for OpenRank Top 4 Global GitHub Repositories
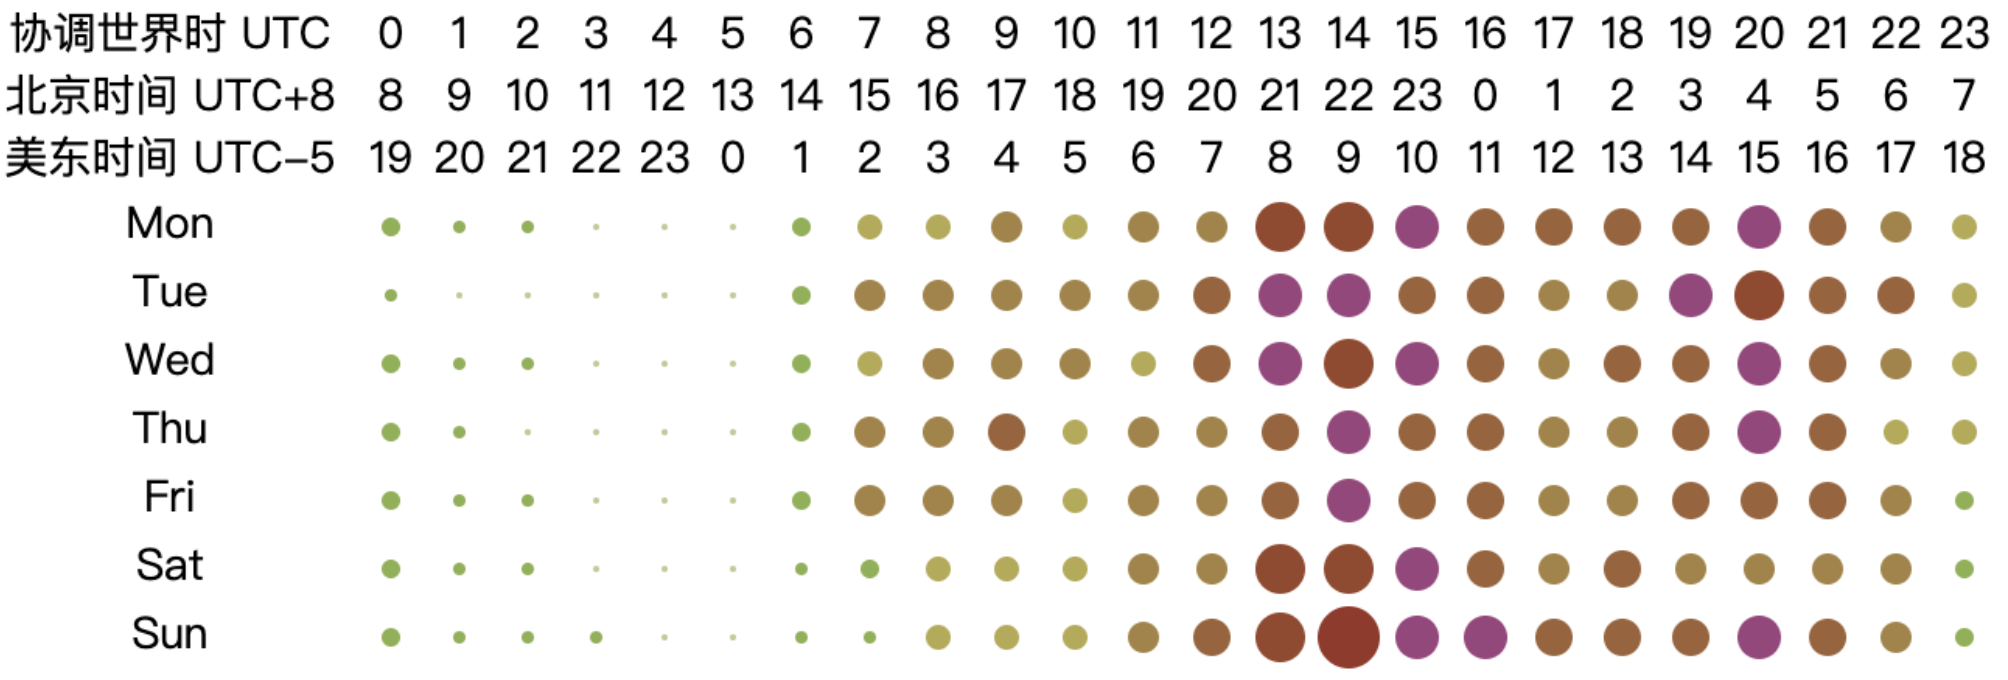
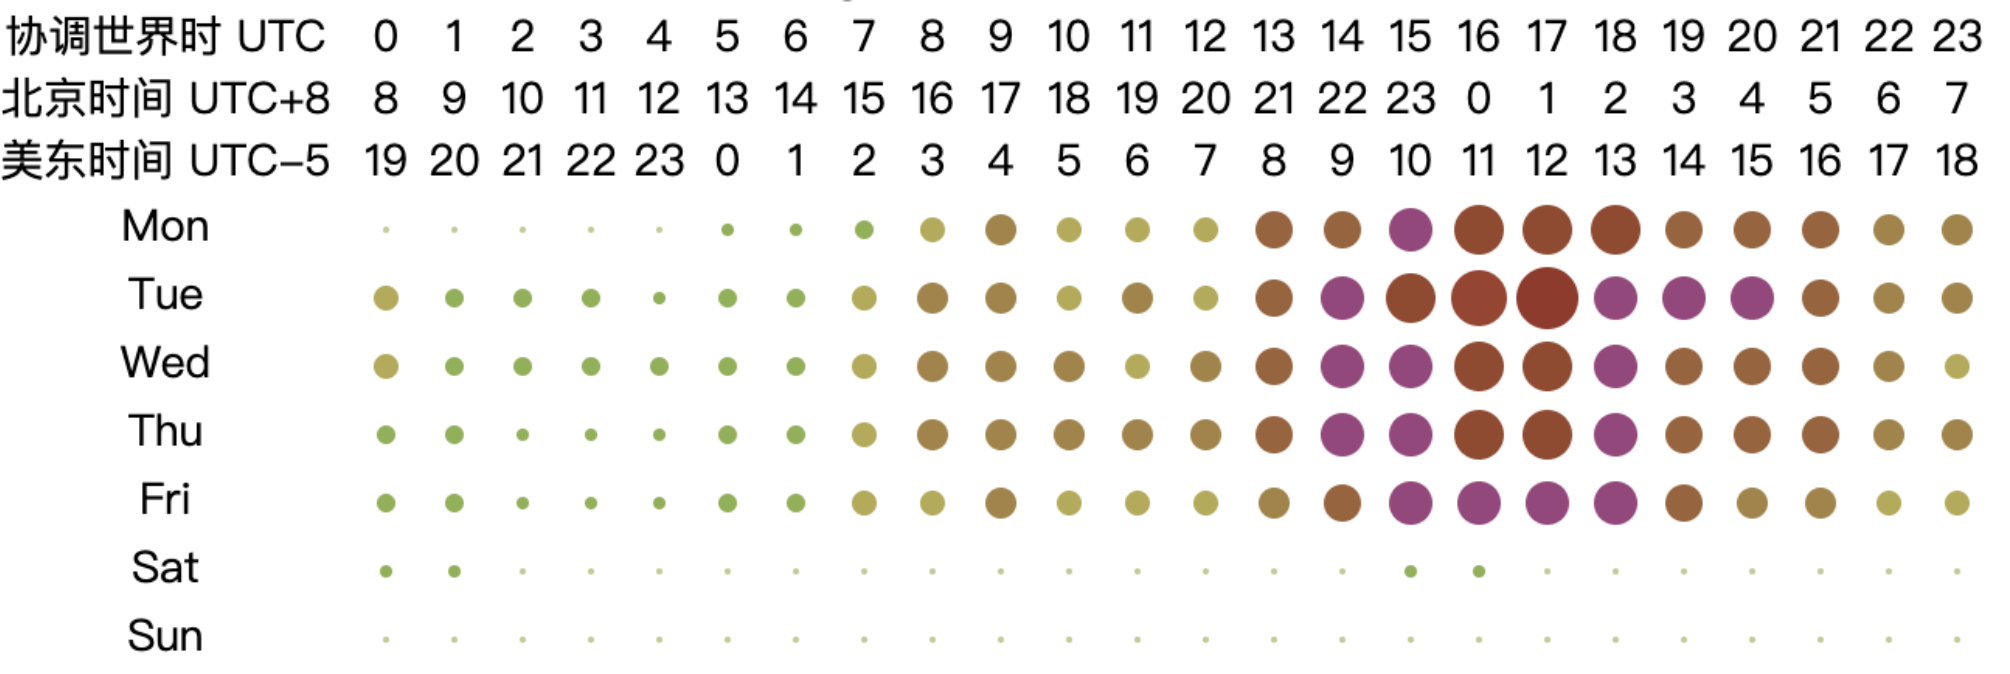
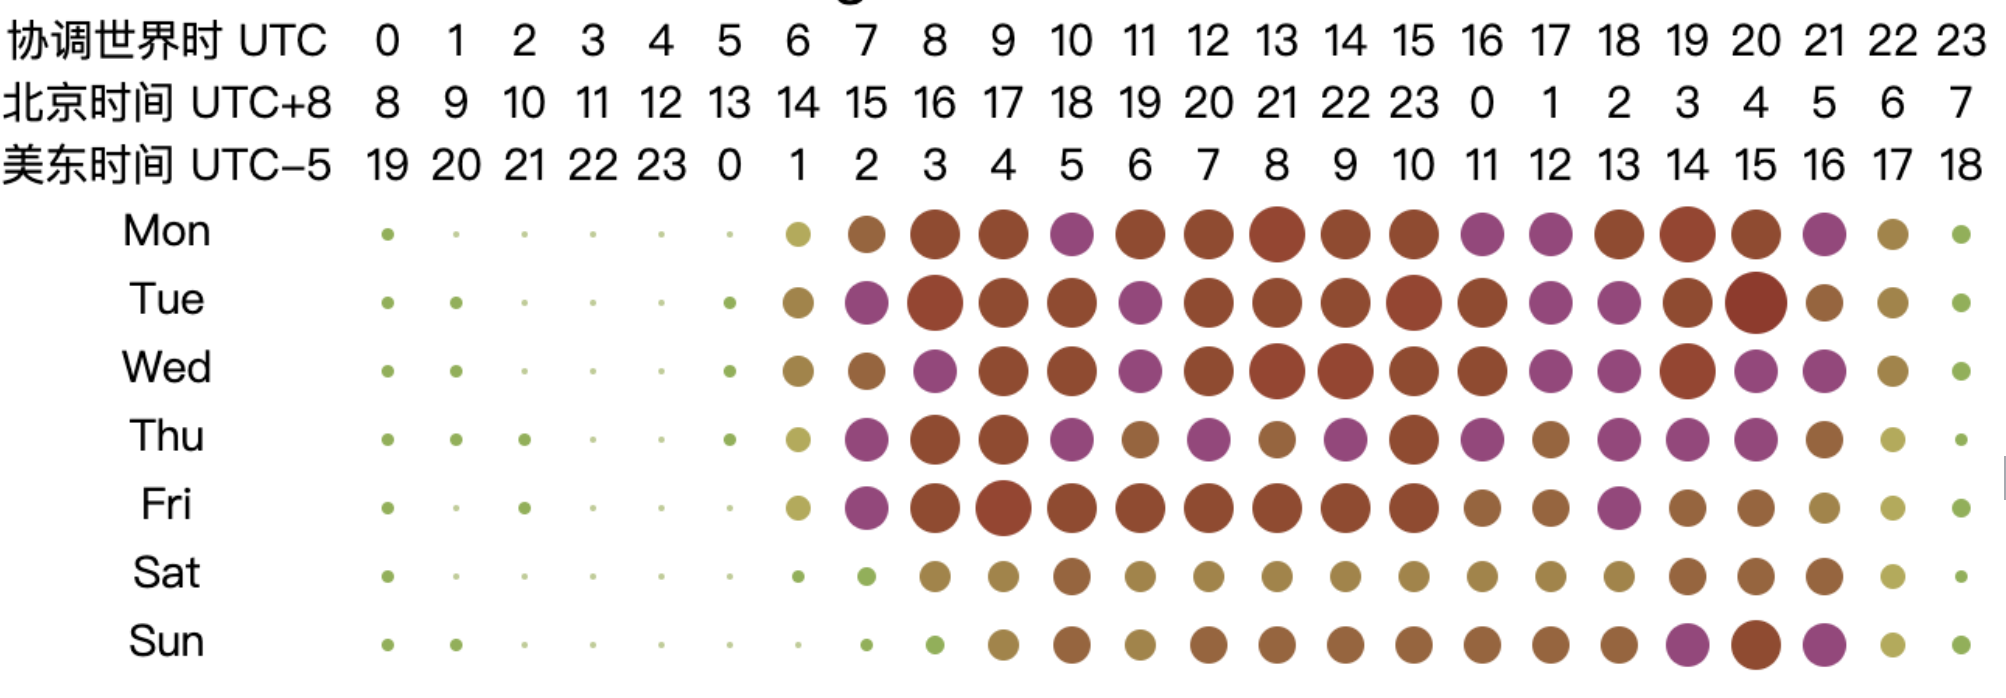
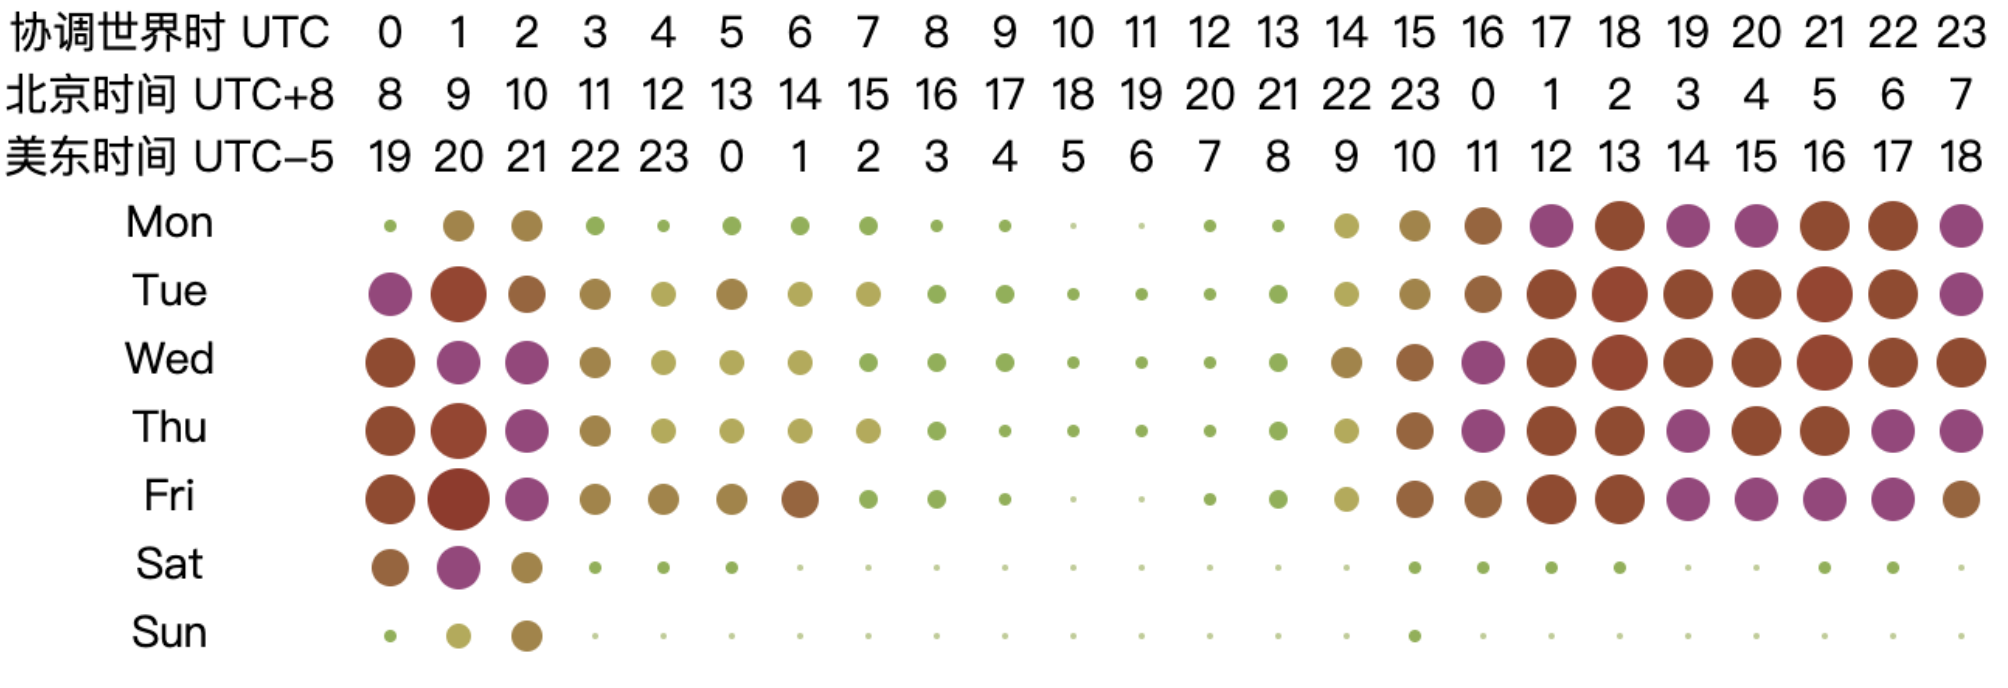
2 - Working Hours Distribution for OpenRank Top 4 Chinese GitHub Repositories
- openharmony
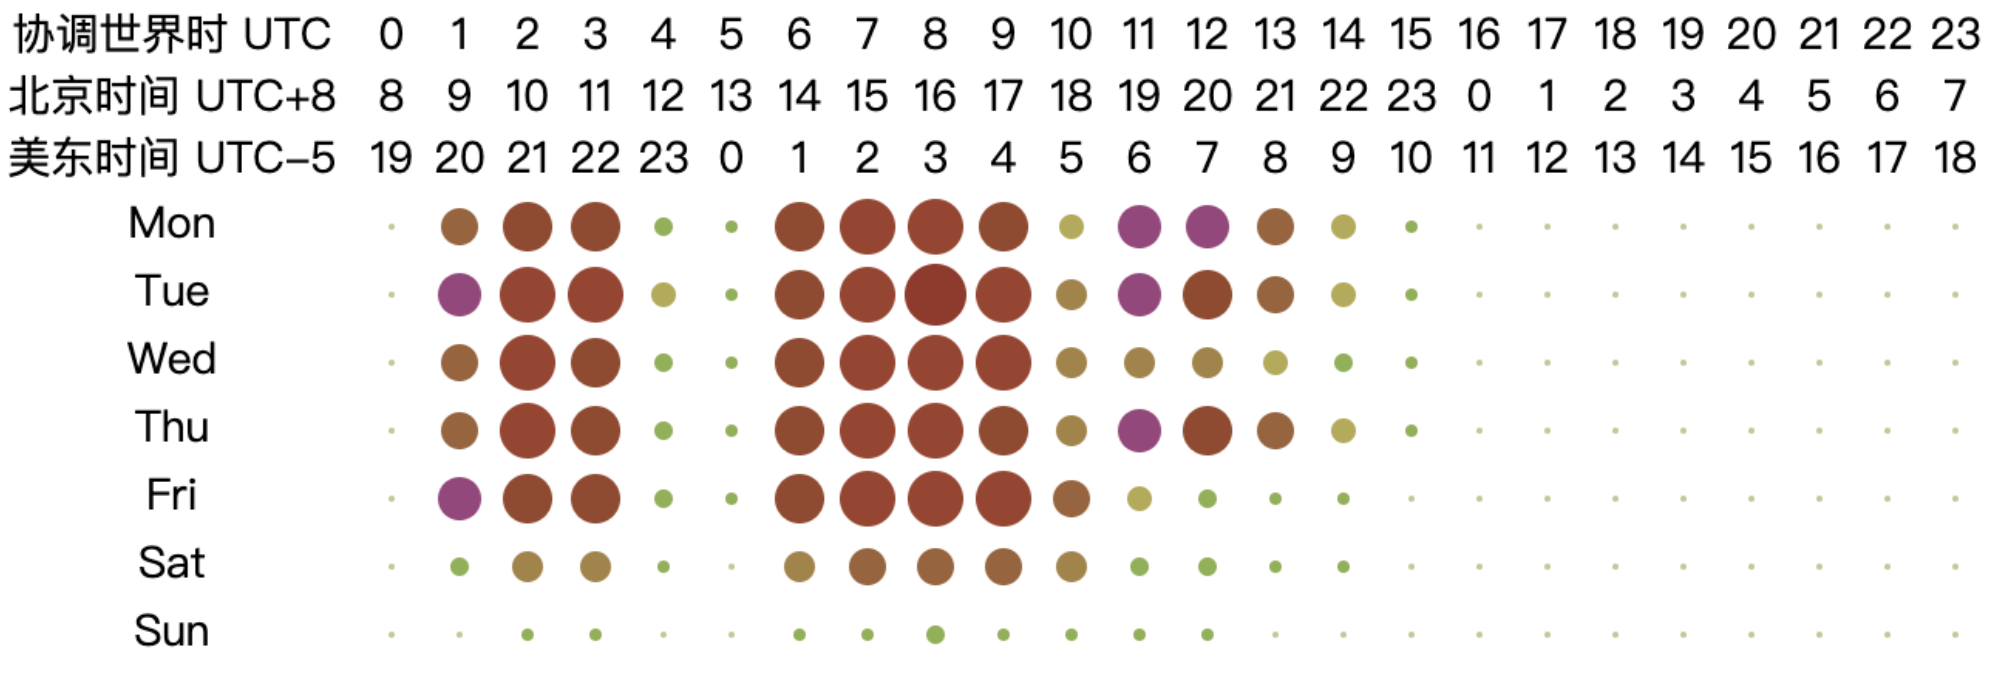
- DaoCloud
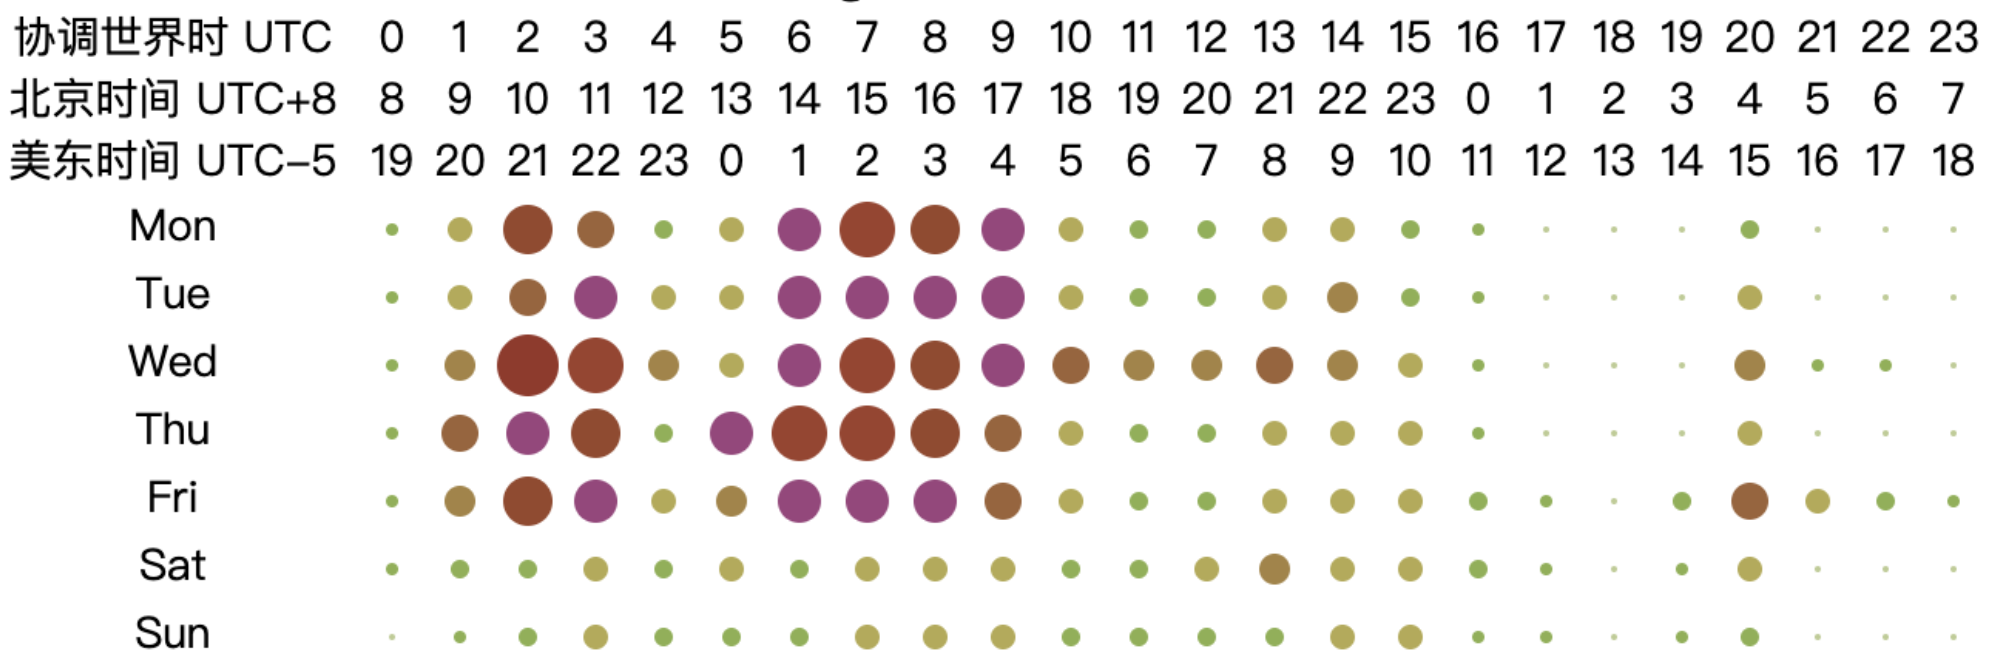
- PaddlePaddle
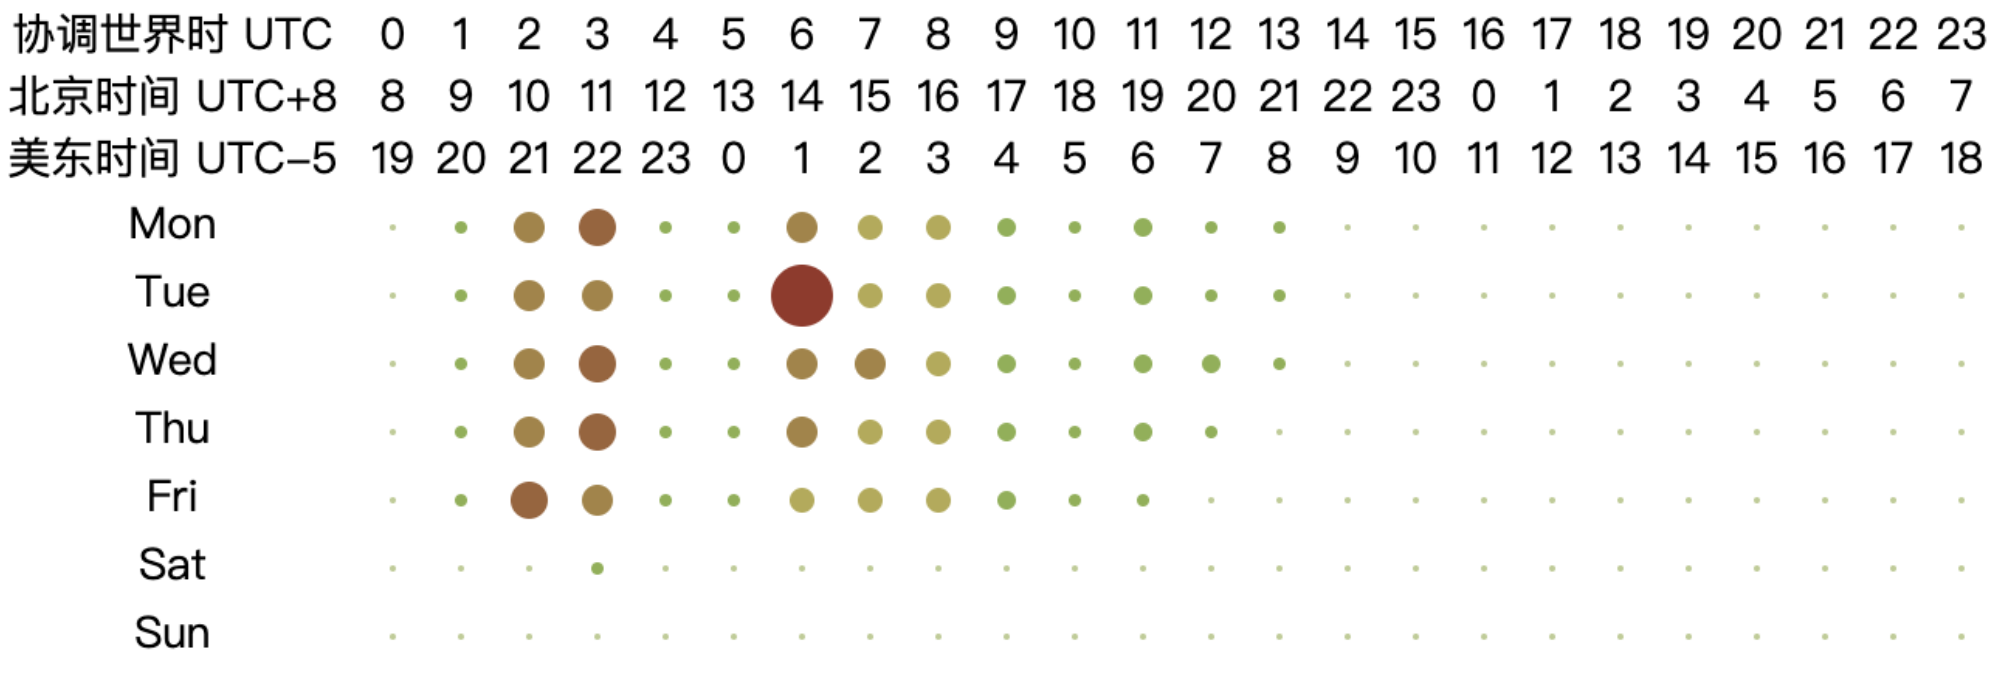
- Doris
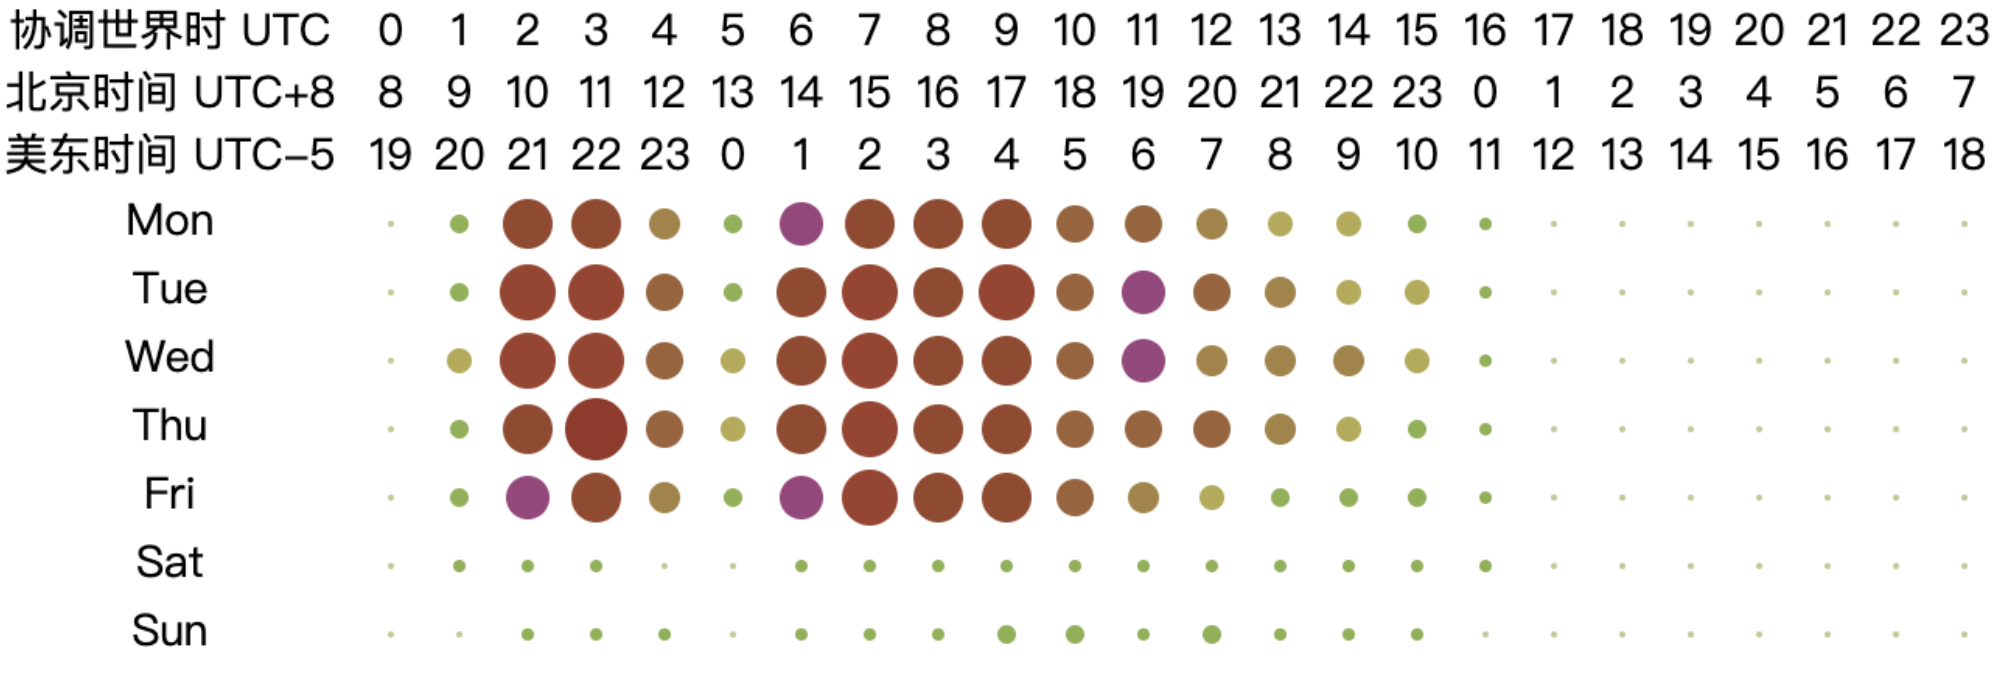
7.3 Developer Persona Analysis
This section categorizes GitHub users into four roles based on the events they trigger in open-source repositories: Explorers, Participants, Contributors, and Committers. The definitions of these roles are as follows:
| Role | Definition | Description |
|---|---|---|
| Explorer | Users who have starred a project. | The user has some interest in the project. |
| Participant | Users who have created Issues or left Comments in a project. | The user is actively engaging with the project. |
| Contributor | Users who have submitted Pull Requests (PRs) in a project. | The user has contributed to the project's CodeBase. |
| Committer | Users who have participated in PR reviews or merged PRs. | The user has made deep contributions to the project. |
In general, these four roles form a progressive hierarchy, as illustrated in the diagram below. Based on this role framework, we quantify the top 10 projects by OpenRank across GitHub from three perspectives: role distribution, temporal changes, and developer role evolution, which corresponds to the ranking list in the second section.
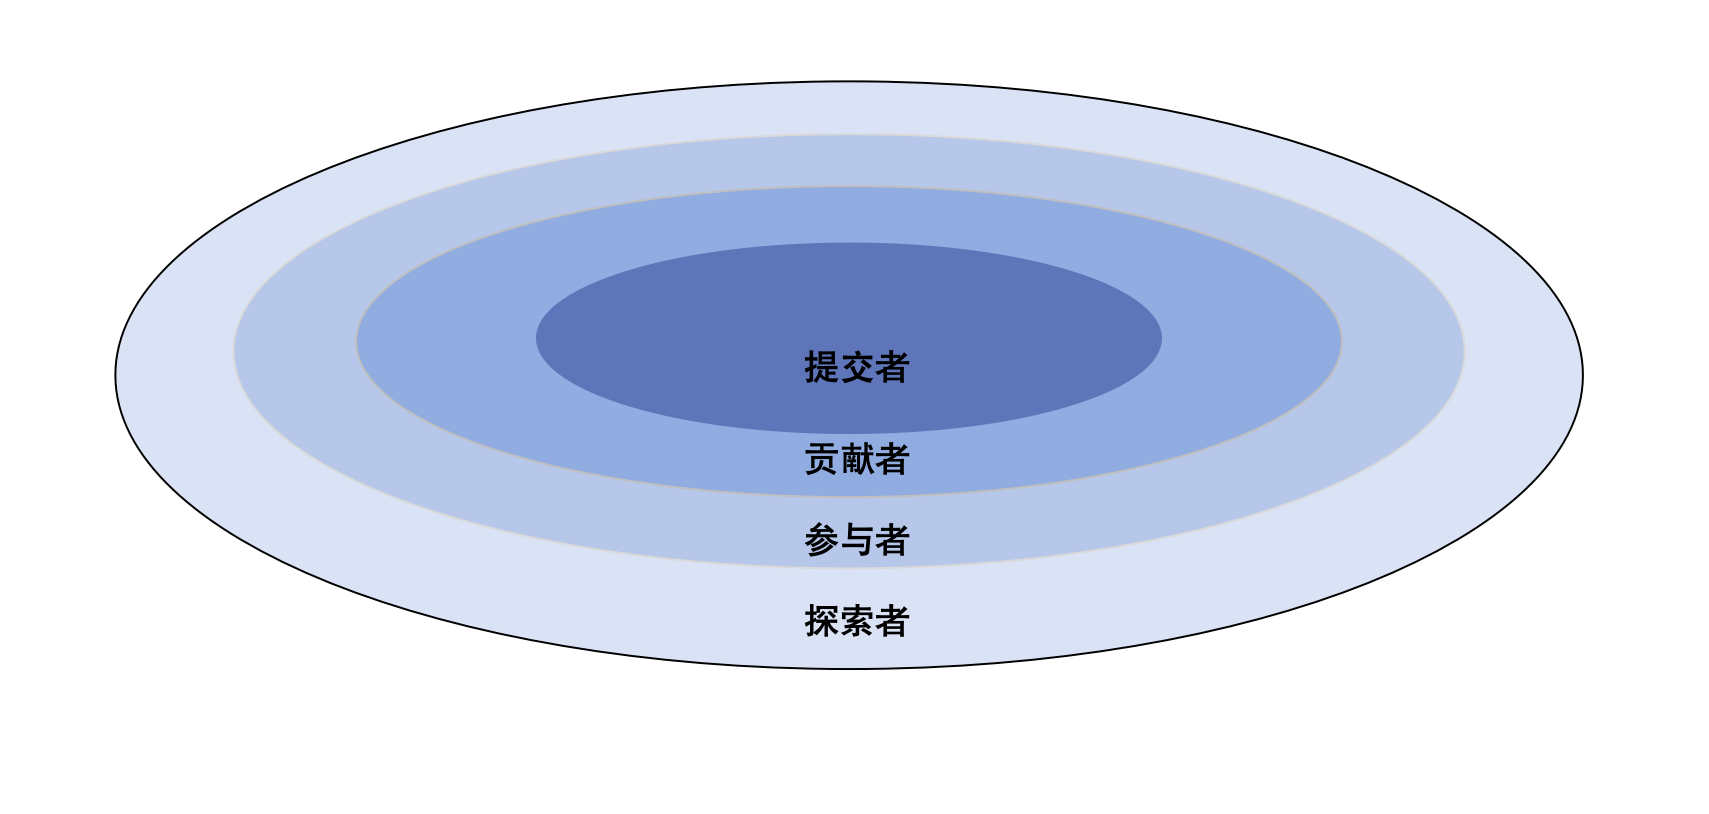
7.3.1 Distribution of the Number of Roles 2024
| Repository | Explorer | Participant | Contributor | Committer |
|---|---|---|---|---|
| NixOS/nixpkgs | 4897 | 3606 | 4339 | 3484 |
| llvm/llvm-project | 6789 | 3241 | 2365 | 2092 |
| home-assistant/core | 10596 | 7472 | 1300 | 989 |
| pytorch/pytorch | 12513 | 2599 | 1424 | 823 |
| digitalinnovationone/dio-lab-open-source | 3813 | 4462 | 21276 | 224 |
| odoo/odoo | 7659 | 650 | 1035 | 661 |
| microsoft/vscode | 14701 | 12522 | 579 | 388 |
| zephyrproject-rtos/zephyr | 2314 | 1054 | 1276 | 1120 |
| godotengine/godot | 15208 | 3314 | 1072 | 678 |
| elastic/kibana | 1298 | 852 | 437 | 452 |
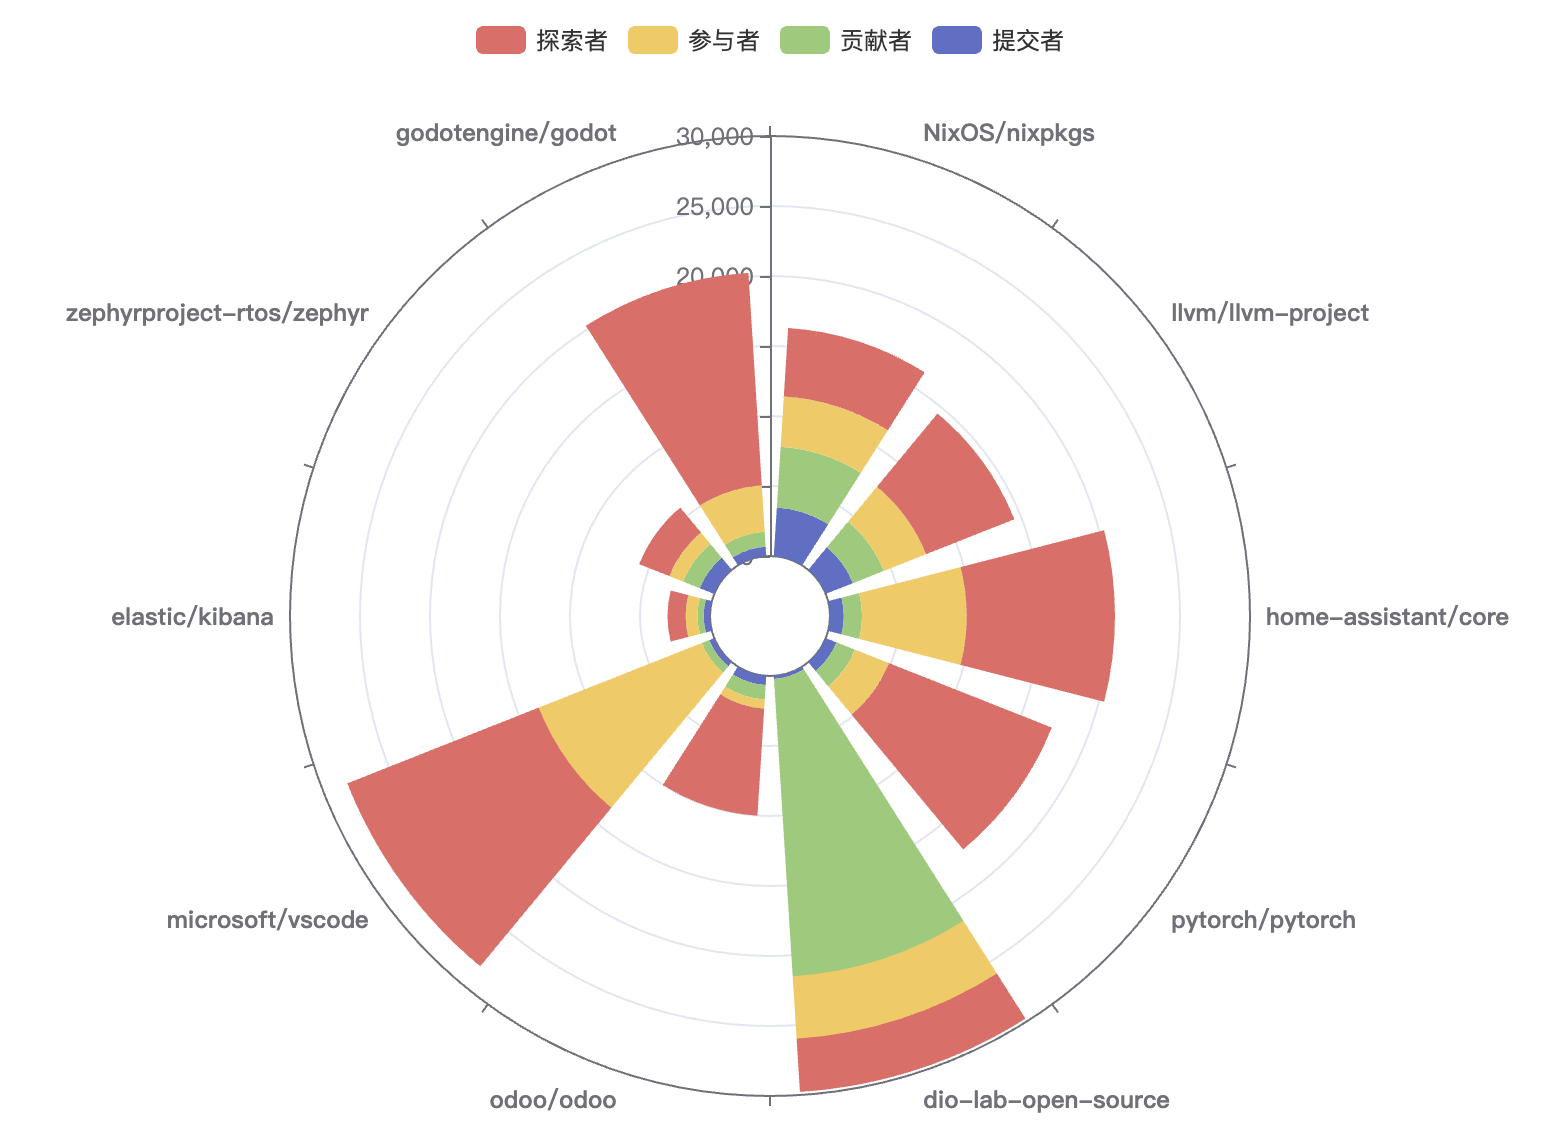
The results show that:
- dio-lab-open-source: With the most contributors (21,276), this project is a tutorial course designed for contributing to GitHub projects, which explains the large number of contributors.
- microsoft/vscode has the largest number of explorers (14,701) and participants (12,522), but the number of contributors (579) and committers (388) is relatively small. This shows that the project has a very high level of attention and participation, but the core contributions are still completed by a smaller number of developers, indicating that its development threshold is high or the management is relatively centralized.
- home-assistant/core and godotengine/godot have a large number of explorers (10,596 and 15,208), and a certain scale of participants, but the ratio of contributors to committers is lower (1,300 and 1,072 contributors, 989 and 678 committers, respectively). This distribution suggests that they have some community involvement, but the actual development work is still undertaken by a small number of developers.
7.3.2 New Additions by Role in 2024
The new statistical criterion for roles is as follows: If a user was not in role X (e.g., contributor or submitter) before 2024 and became that role in 2024, they are counted as an effective addition to the X role.
For example, A submitted a PR to project B in 2021, but never participated in code review. In 2023, A reviewed a PR in project B, so A is called a new committer.
The detailed role additions are shown in the figure and table below.
| Repository | New Explorer | New Participant | New Contributor | New Committer |
|---|---|---|---|---|
| NixOS/nixpkgs | 4836 | 2392 | 2187 | 1605 |
| llvm/llvm-project | 6689 | 2191 | 1517 | 1223 |
| home-assistant/core | 10483 | 5502 | 819 | 565 |
| pytorch/pytorch | 12321 | 1938 | 946 | 496 |
| digitalinnovationone/dio-lab-open-source | 3809 | 4455 | 21254 | 224 |
| odoo/odoo | 7559 | 445 | 467 | 239 |
| microsoft/vscode | 14416 | 10614 | 450 | 312 |
| zephyrproject-rtos/zephyr | 2278 | 687 | 690 | 554 |
| godotengine/godot | 14774 | 2216 | 738 | 445 |
| elastic/kibana | 1280 | 472 | 155 | 117 |
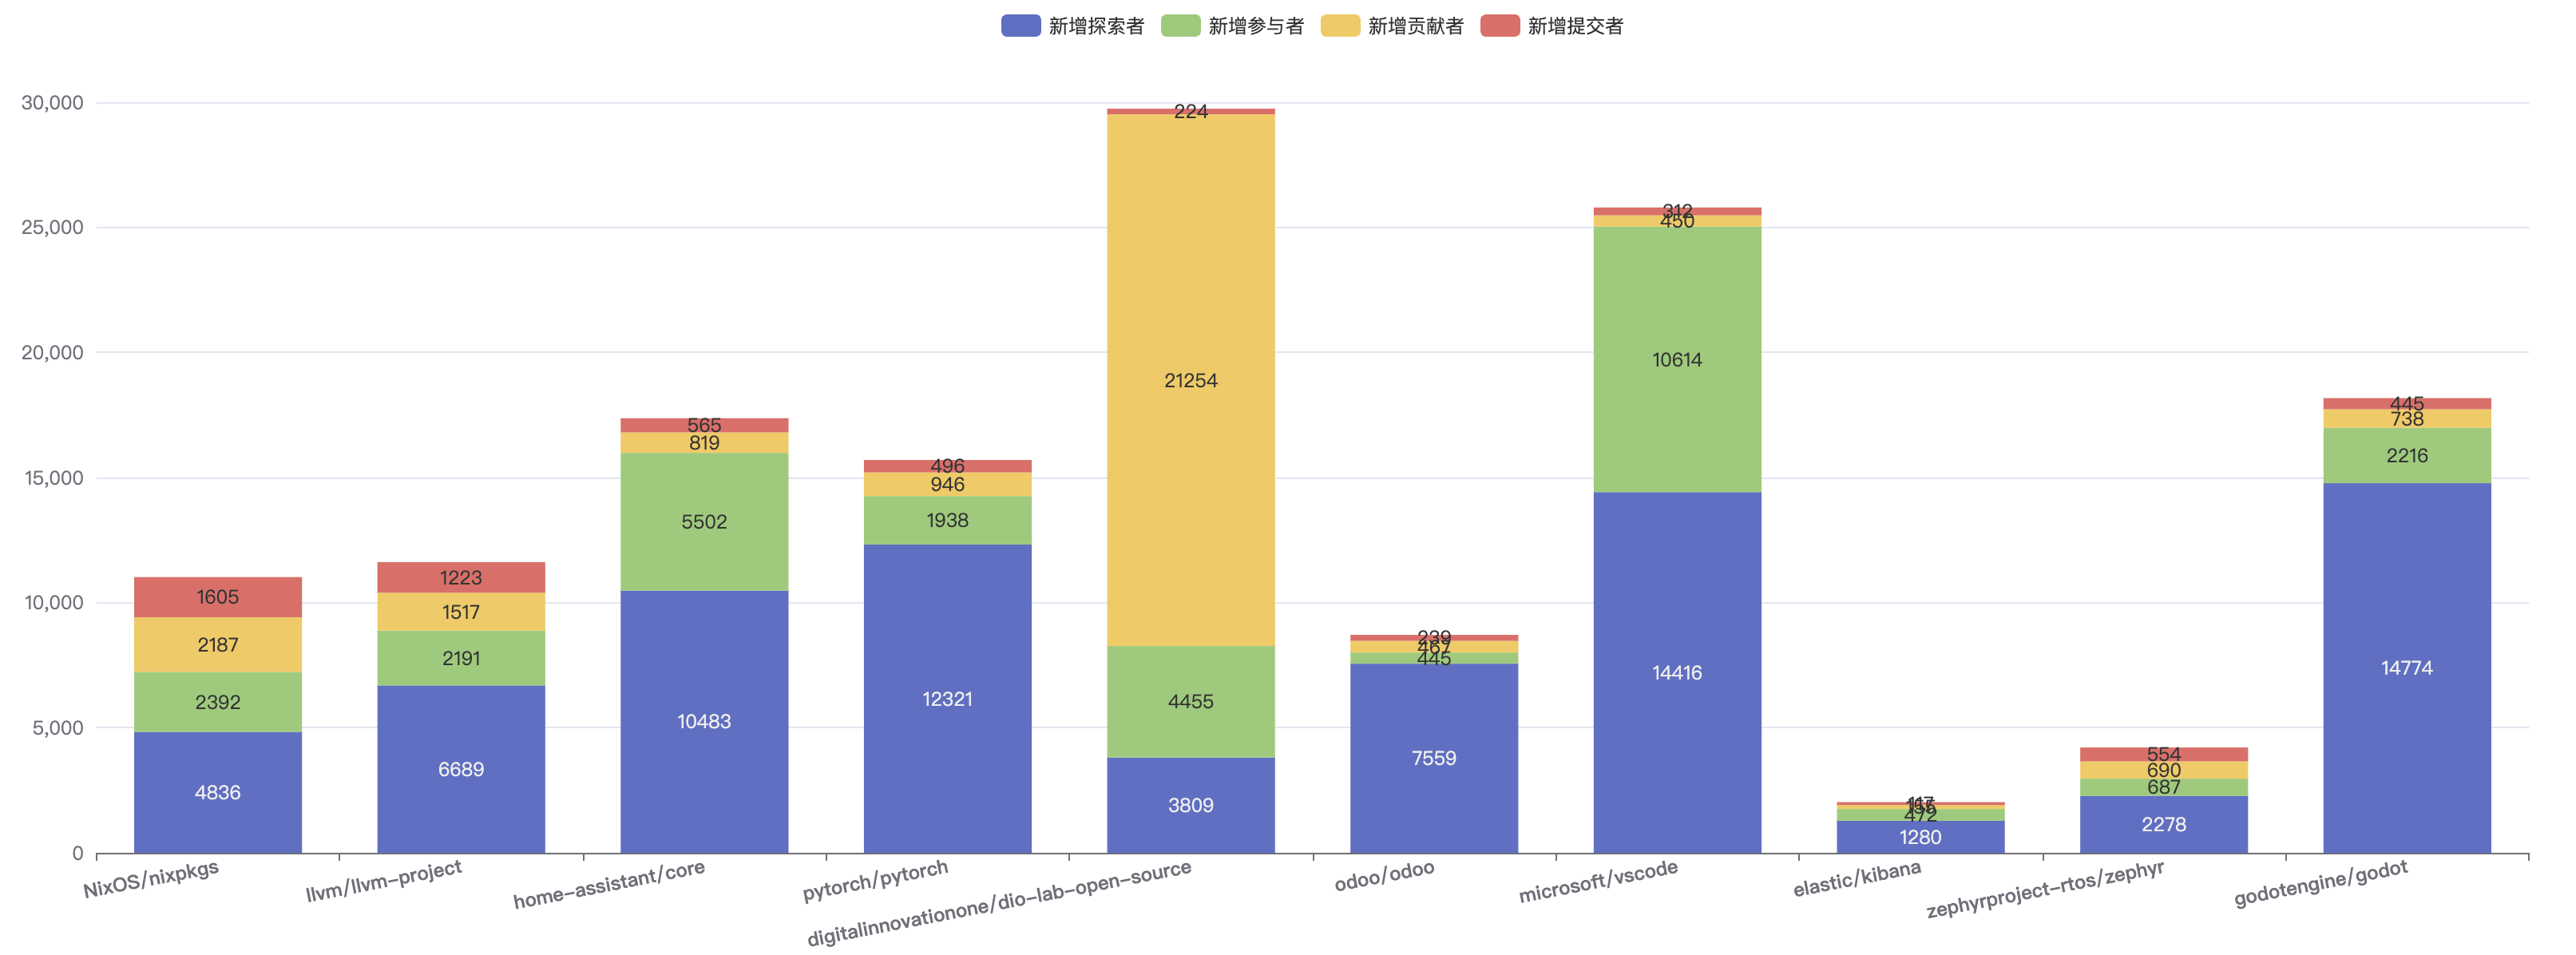
1. New Explorers
- microsoft/vscode follows closely, with the number of new explorers reaching 14,416. This reflects its ongoing appeal as one of the most popular code editors globally.
2. New Participants
- microsoft/vscode ranked first with 10,614 new participants, demonstrating that its participation and popularity in the open source community continues to remain strong.
3. New Contributors
- digitalinnovationone/dio-lab-open-source has 21,254 new contributors, far ahead of other projects. This shows that the project is very attractive to developers at the contribution level, which may be due to its friendly entry threshold for beginners and the support of a large number of teaching resources.
- NixOS/nixpkgs ranks second with 2,187 new contributors, indicating that its community activity and openness are still high.
4. New Committers
- NixOS/nixpkgs is the project with the highest number of new committers in 2024, reaching 1,605, indicating that its core maintenance team has further expanded. This shows that its community not only attracts a large number of contributors, but also converts into efficient commit behavior.
- llvm/llvm-project ranks second with 1,223 new committers, reflecting its strong core development capabilities and community activity.
7.3.3 Developer Evolution Perspective
The evolution process of developers is defined as: how many roles in an open source community transition to other roles. In this report, only developers transitioning from one role to a more advanced role were measured. For example, if a user was a participant before 2023 and submitted their first PR in 2023, they transitioned from a participant to a contributor.
| Repository | Contributor -> Committer | Participant -> Contributor | Explorer -> Participant |
|---|---|---|---|
| NixOS/nixpkgs | 287 | 188 | 204 |
| llvm/llvm-project | 134 | 289 | 185 |
| home-assistant/core | 66 | 103 | 155 |
| pytorch/pytorch | 82 | 78 | 168 |
| digitalinnovationone/dio-lab-open-source | 0 | 21 | 3 |
| odoo/odoo | 48 | 33 | 28 |
| microsoft/vscode | 23 | 50 | 272 |
| zephyrproject-rtos/zephyr | 62 | 45 | 46 |
| godotengine/godot | 67 | 115 | 242 |
| elastic/kibana | 12 | 26 | 3 |
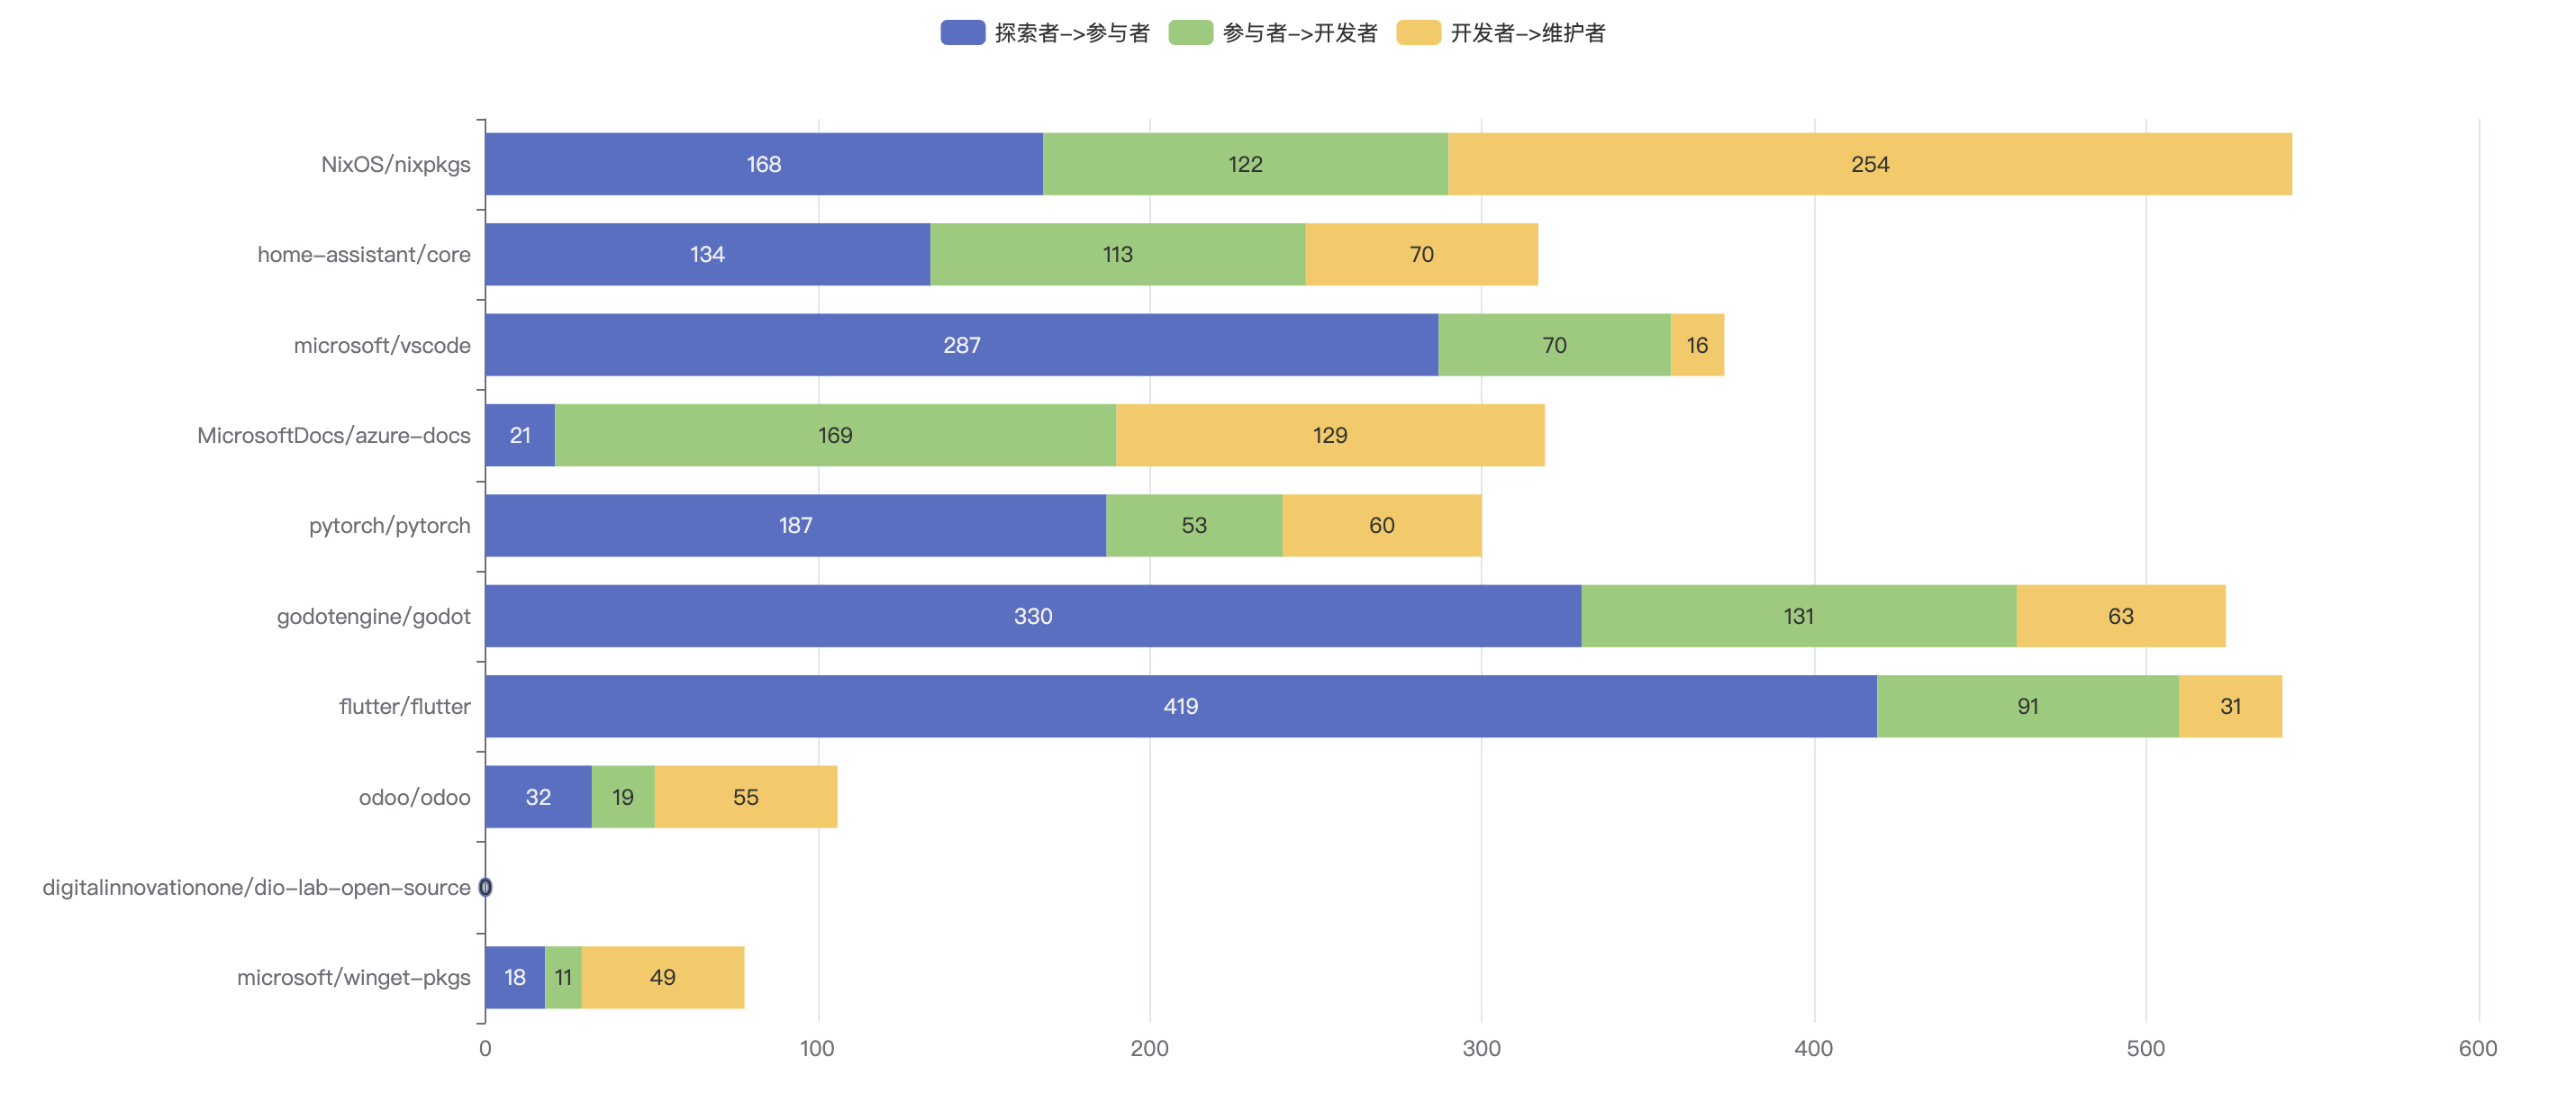
- From the data in the tables and charts, we can observe the evolution trends of developer roles across communities in 2024. It continues to reflect a typical funnel model, where developers transition from explorers to participants, from participants to contributors, and eventually to core committers. This trend aligns with the natural progression of open-source community members from initial exploration to deep engagement.
- In various communities, we can still observe the typical funnel model, the evolution path from explorers to participants, and then to contributors and committers. Taking godotengine/godot as an example, in 2024, 242 explorers successfully transformed into participants, 115 participants transformed into contributors, and 67 contributors evolved into committers. This trend is also reflected in other communities, showing the natural development process of members from initial participation to deep contribution.
- In the NixOS/nixpkgs community, we observed a high number of conversions from contributors to committers, reaching 287, which further shows its openness to core contributions and high code review requirements, which helps to improve code quality and project stability.
- In addition, for projects like microsoft/vscode and godotengine/godot, the transformation from explorers to participants is quite significant, with 272 and 242 explorers completing the role transformation respectively. This shows that these communities are more attractive to new developers and provide a relatively low threshold for participation.
- In contrast, the role transformation of digitalinnovationone/dio-lab-open-source is still relatively small, especially the former has less evolution data, indicating that the community is still in the early stages of development. Similarly, elastic/kibana also has less evolution data, but this project is a mature project. It can be seen that when the project is developed and improved, its developers will also tend to be stable.
7.4 Bot Account Perspectives
Bot accounts are accounts that have been manually labeled and recognized for their contributions to the community. Currently, there are 1,410 bot accounts, with 181 additions compared to last year. Among these, 965 bot accounts were active in 2024, with 930 on the GitHub platform and 35 on the Gitee platform. We analyzed all events in the repositories where these bots participated to study the changes in bot-related activities. By comparing the events generated by bot accounts with all events, we can assess the significance of bot accounts. Through comparative charts of different event types and their change rates, we can understand the reasons behind the changes in the number of bot-related events in 2024. Finally, by examining the 7x24-hour activity heatmap of bot accounts, we can gain insights into the working hours of these bots.
7.4.1 Bot Account Event Changes
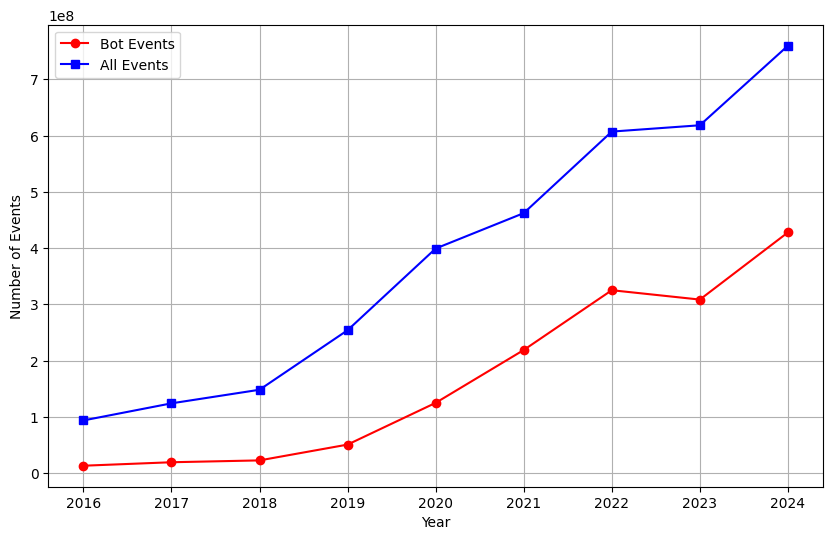
From Figure 7-8, it can be observed that the number of events generated by bot accounts has significantly increased over the past few years. Particularly, starting from 2020, the number of bot-related events has shown a rapid upward trend. In contrast, the number of events involving human developers, while also increasing, has grown at a relatively slower pace, with a more stable trend over time.
To elaborate further, between 2016 and 2024, the number of events generated by bot accounts grew from nearly zero to over 400 million, while the total number of events increased from approximately 100 million to over 700 million. The growth rate of bot-related events has significantly outpaced that of overall events, indicating that the role and influence of bot accounts in the community are continuously strengthening.
This growth is likely driven by the increasing adoption of bots in automating tasks, code reviews, continuous integration, and other areas, thereby reducing the workload on human developers and improving overall efficiency. Although the level of human developer participation has remained relatively stable, the rapid growth of bot accounts has compensated for this, ensuring a consistent rise in the total number of events.
In 2024, bot-related events accounted for 43% of all events, while events involving human developers made up 57%. This proportion further underscores the importance of bot accounts in the community. Not only has the number of bot-related events grown significantly, but their share of overall events has also increased, highlighting the increasingly critical role bots play in the community.
7.4.2 Analysis of Bot Account Event Changes
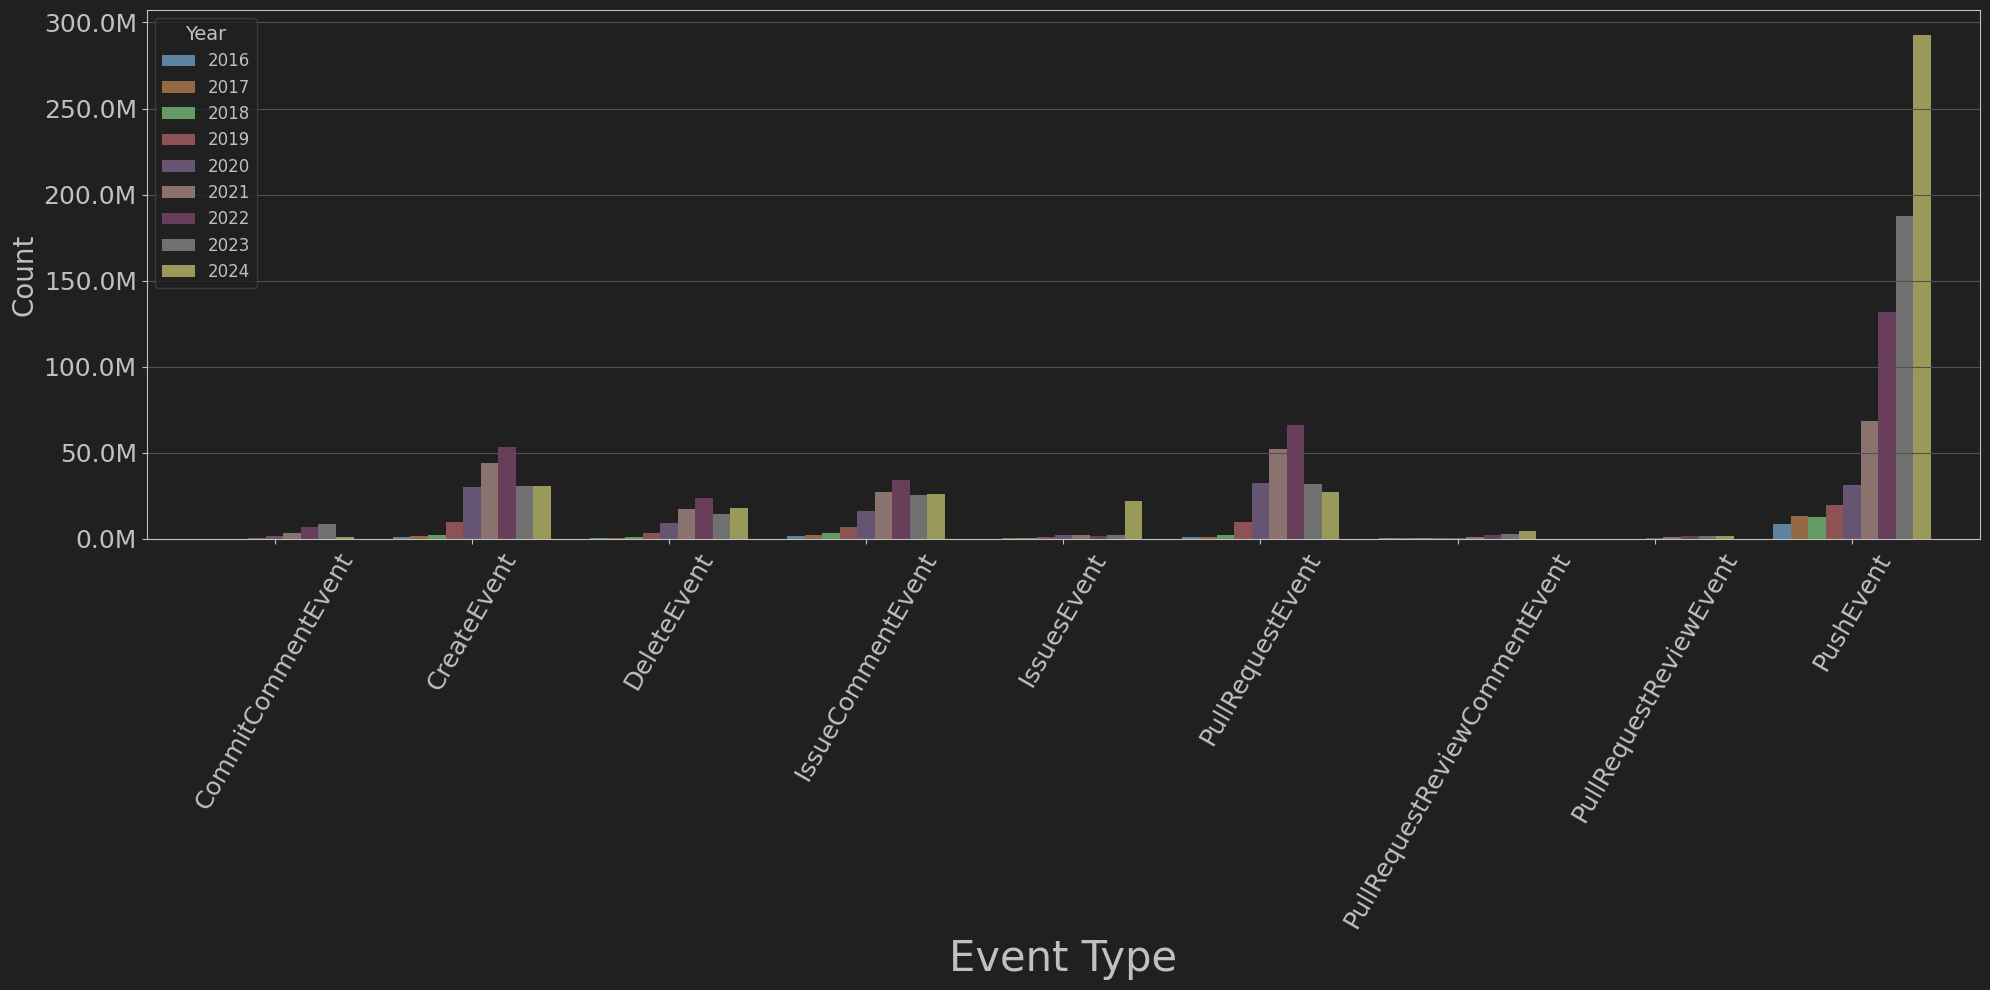
From Figure 7-10, we can observe the distribution of different event types across the years. Since bot accounts do not participate in MemberEvent, WatchEvent, ForkEvent, PublicEvent, or GollumEvent, these events have been excluded. Below are some key observations:
- PushEvent and PullRequestEvent are the most dominant event types, with their numbers far exceeding other event types.
- PushEvent reached a new peak in 2024, with the number of events approaching 300 million.
- The number of PullRequestCommentEvent has been steadily increasing.
- However, PullRequestEvent has been gradually decreasing.
The significant increase in the activity of bot accounts in code submission indicates that developers are increasingly relying on automated tools to submit code. At the same time, the number of PullRequestEvent is gradually decreasing, probably because the optimization of automated tools and processes has reduced the need for manual pull requests. The number of PullRequestCommentEvent and IssueCommentEvent continues to rise, indicating that robot accounts are more involved in code review and issue management. In addition, the number of other event types (such as CreateEvent, DeleteEvent, etc.) has also increased, reflecting the diverse activities of bot accounts in project management and maintenance.
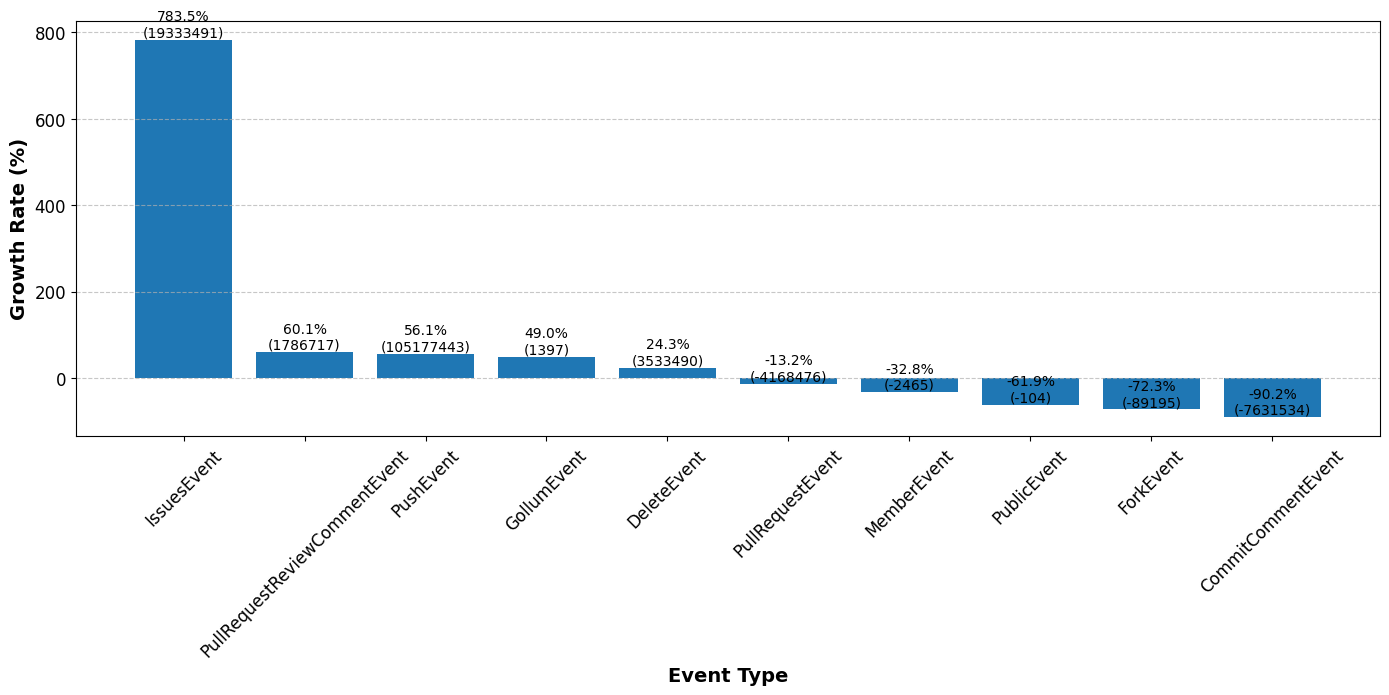
Figure 7-11 shows the change rate of each event type between 2024 and 2023:
- IssuesEvent has the highest growth rate, reaching 783.5%, an increase of 19,333,491 times. This shows that the robot's activity in handling issues has increased significantly.
- PullRequestReviewCommentEvent and PushEvent have growth rates of 60.1% and 56.1%, respectively, with an increase of 1,786,717 times and 105,177,443 times.
- GollumEvent and DeleteEvent also show growth, 49.0% and 24.3%, respectively.
- CommitCommentEvent and ForkEvent show significant decreases, decreasing by 90.2% and 72.3%, respectively.
These change rates indicate that bot accounts have become more active in certain types of events, especially in handling issues (IssuesEvent) and code submissions (PushEvent). At the same time, the decrease in certain event types (such as CommitCommentEvent and ForkEvent) may indicate that these tasks are more manually handled by developers or that there is less demand for automation of these tasks.
7.4.3 Bot Account 7x24 Hour Activity Heatmap

From the 24-hour activity heatmap, we can observe distinct patterns in the distribution of bot account activities throughout the day. Below are some key observations:
- Peak Hours: Bot account activity reaches its peak at 12:00 PM (noon) each day. This suggests that most bot events are scheduled tasks, typically programmed to run at midday.
- All-Day Activity: Although noon is the peak activity period, bot accounts maintain a certain level of activity throughout the 24-hour cycle. This indicates that bots operate around the clock, handling various automated tasks.
- Weekdays vs. Weekends: The heatmap shows that activity levels are slightly higher on weekdays (Monday to Friday) compared to weekends (Saturday and Sunday). This is likely due to increased development activity on weekdays, triggering more bot events.
This activity pattern highlights the critical role bot accounts play in automating tasks, particularly in areas like scheduled tasks and continuous integration. By executing tasks at fixed times, bots effectively reduce the workload on developers and enhance overall productivity.
8. Commercial Open Source Insights
8.1 Definition of Commercial Open Source
Commercial open source refers to a model in which companies profit commercially by providing value-added services, technical support and customised solutions based on open source software. Commercial open source is about reducing software bugs and enriching software features through the participation of more people, while at the same time preventing a few people from leaving inappropriate backdoors in the software. Companies can directly gain economic benefits through the open source business model, and open source software will eventually feed back into the economy, allowing commercial companies to provide better products for users. The main difference between it and traditional open source is that traditional open source is primarily designed to promote the free use, modification and distribution of software, and tends to be community-driven to drive technological progress. But while commercial open source also follows the principles of open source, its main purpose is still to make a profit.
8.2 Analysis of Commercial Open Source Companies
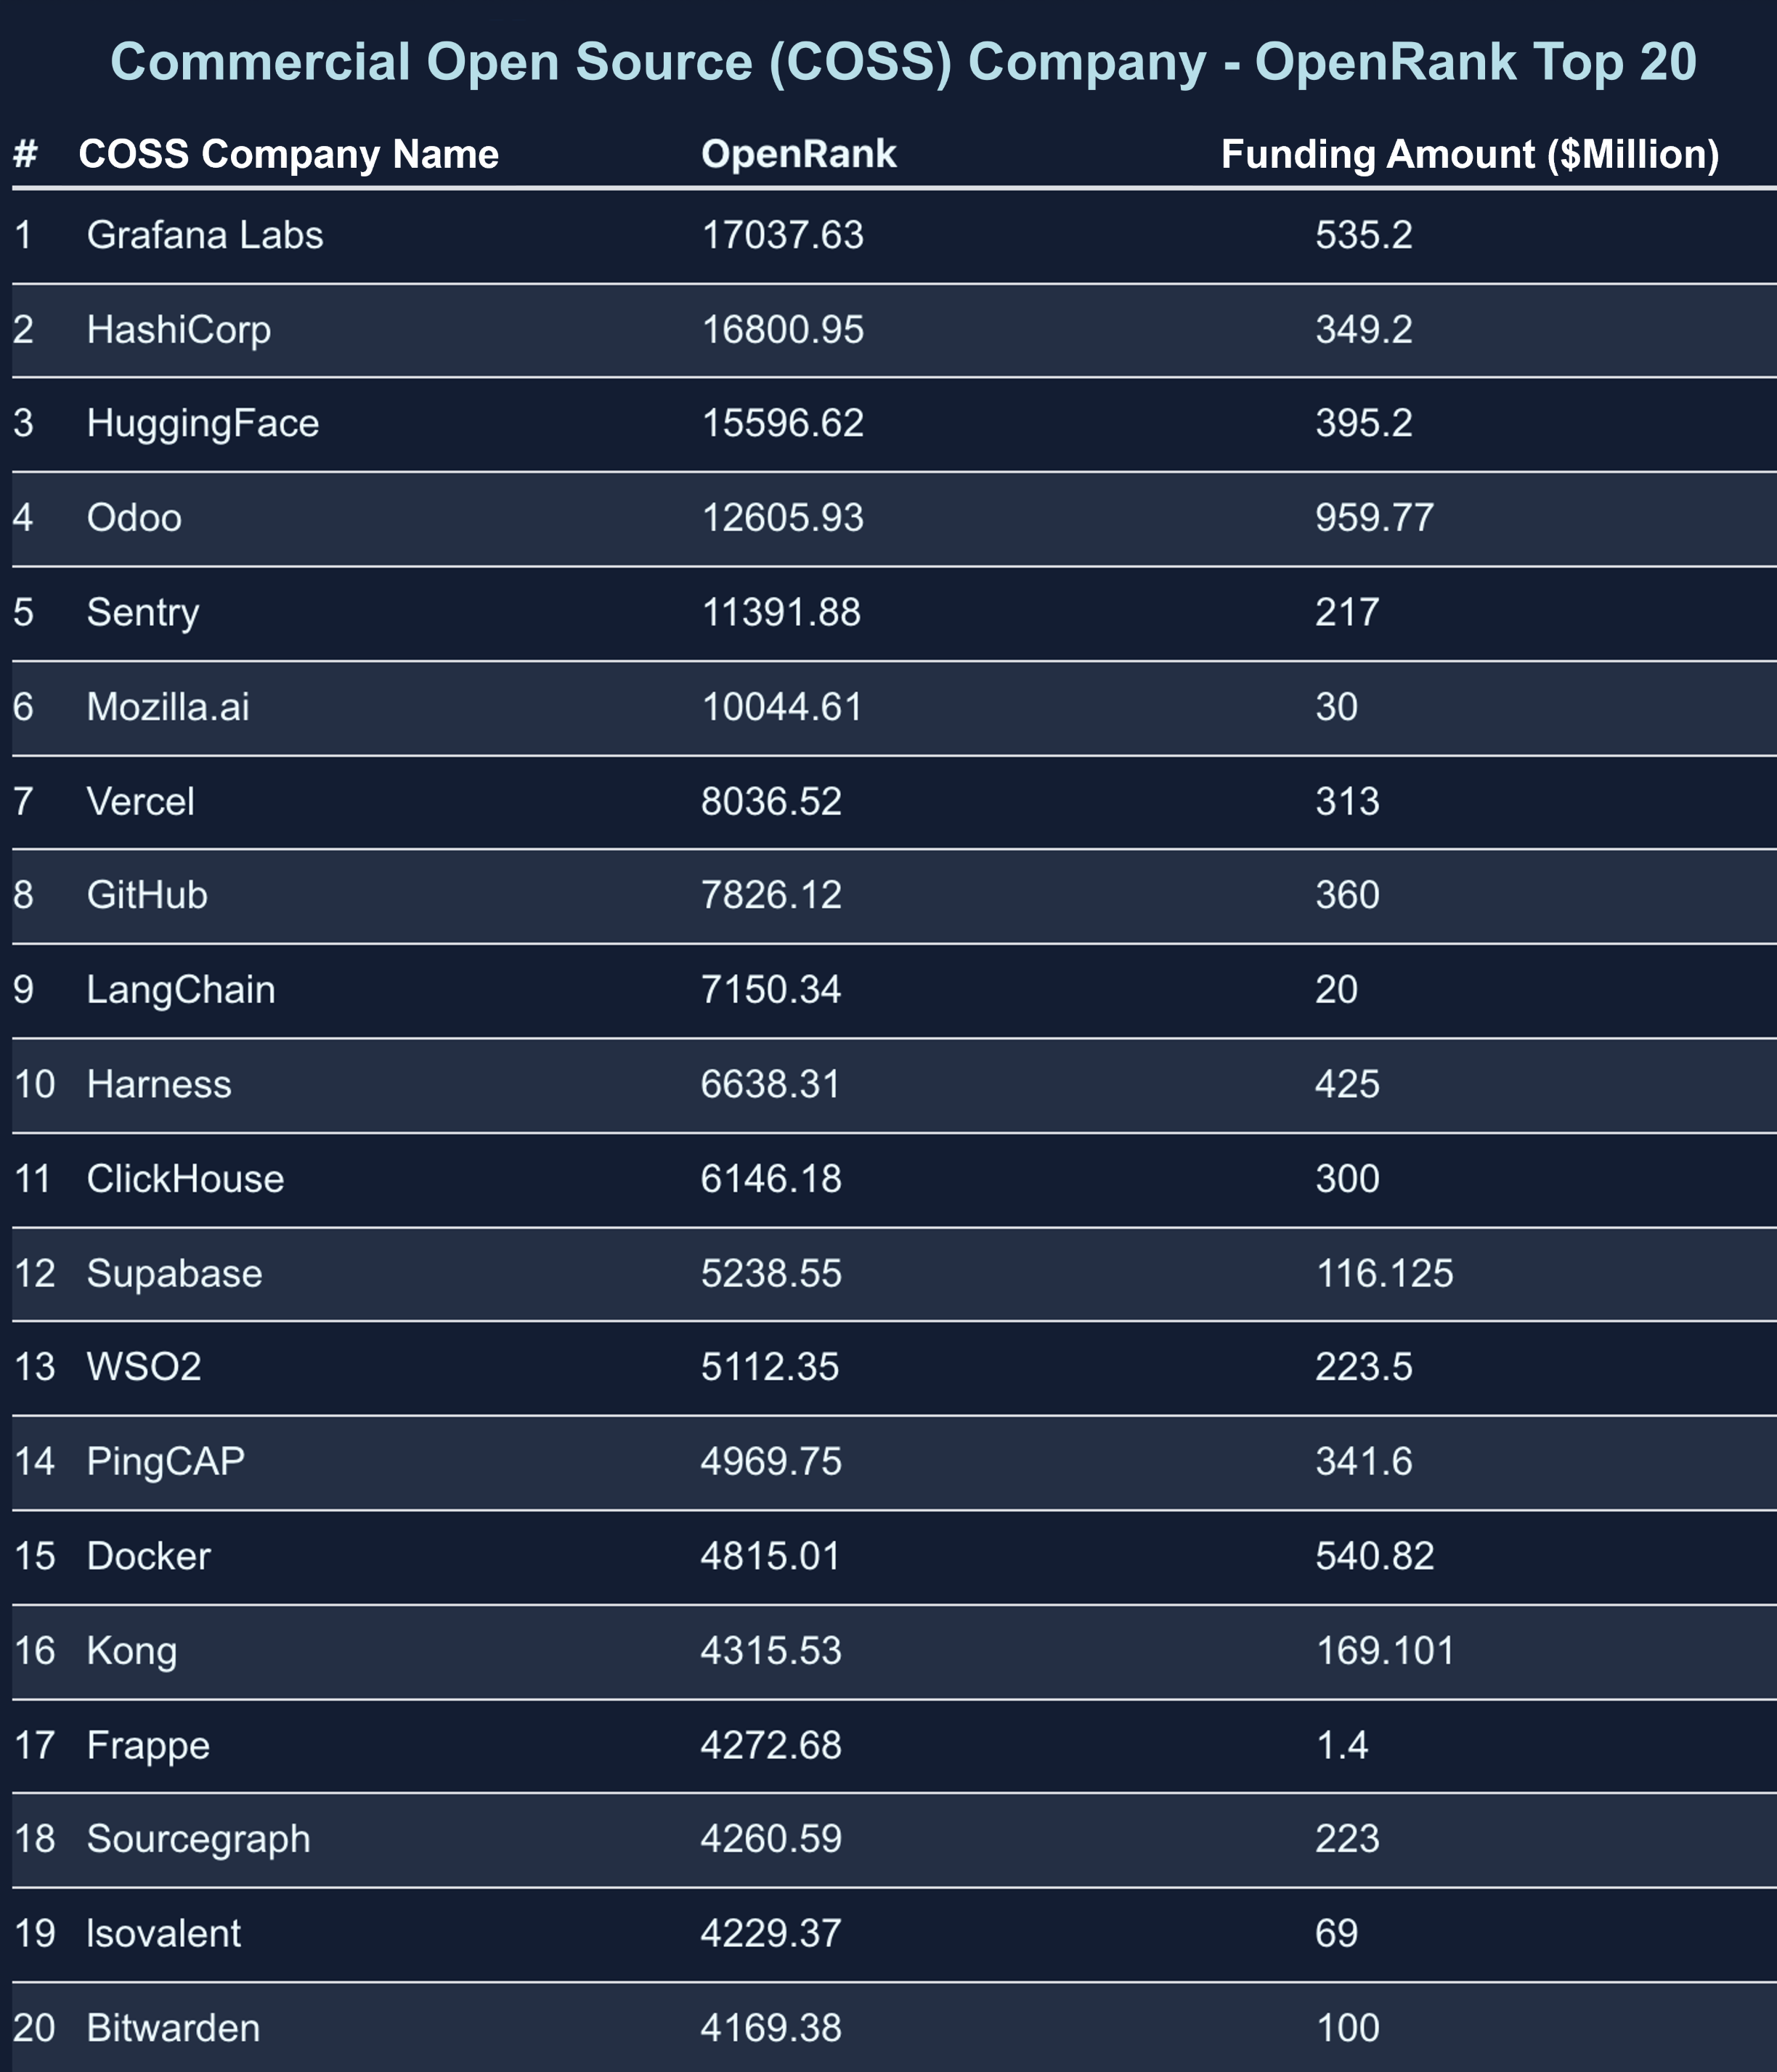
Grafana Labs, which has the Top 1 OpenRank thanks to the widespread adoption and community activity of its core product Grafana, closed a funding round in 2024 that valued the company at $6 billion.
HashiCorp holds a significant position in the open-source domain, but its funding amount is relatively low at $349.2 million. This may be due to the fact that HashiCorp's business model and monetization approach differ from those of other companies. It primarily commercializes by offering enterprise-level support, services, and commercial editions of its open-source tools.
8.3 Analysis of Commercial Open Source Projects
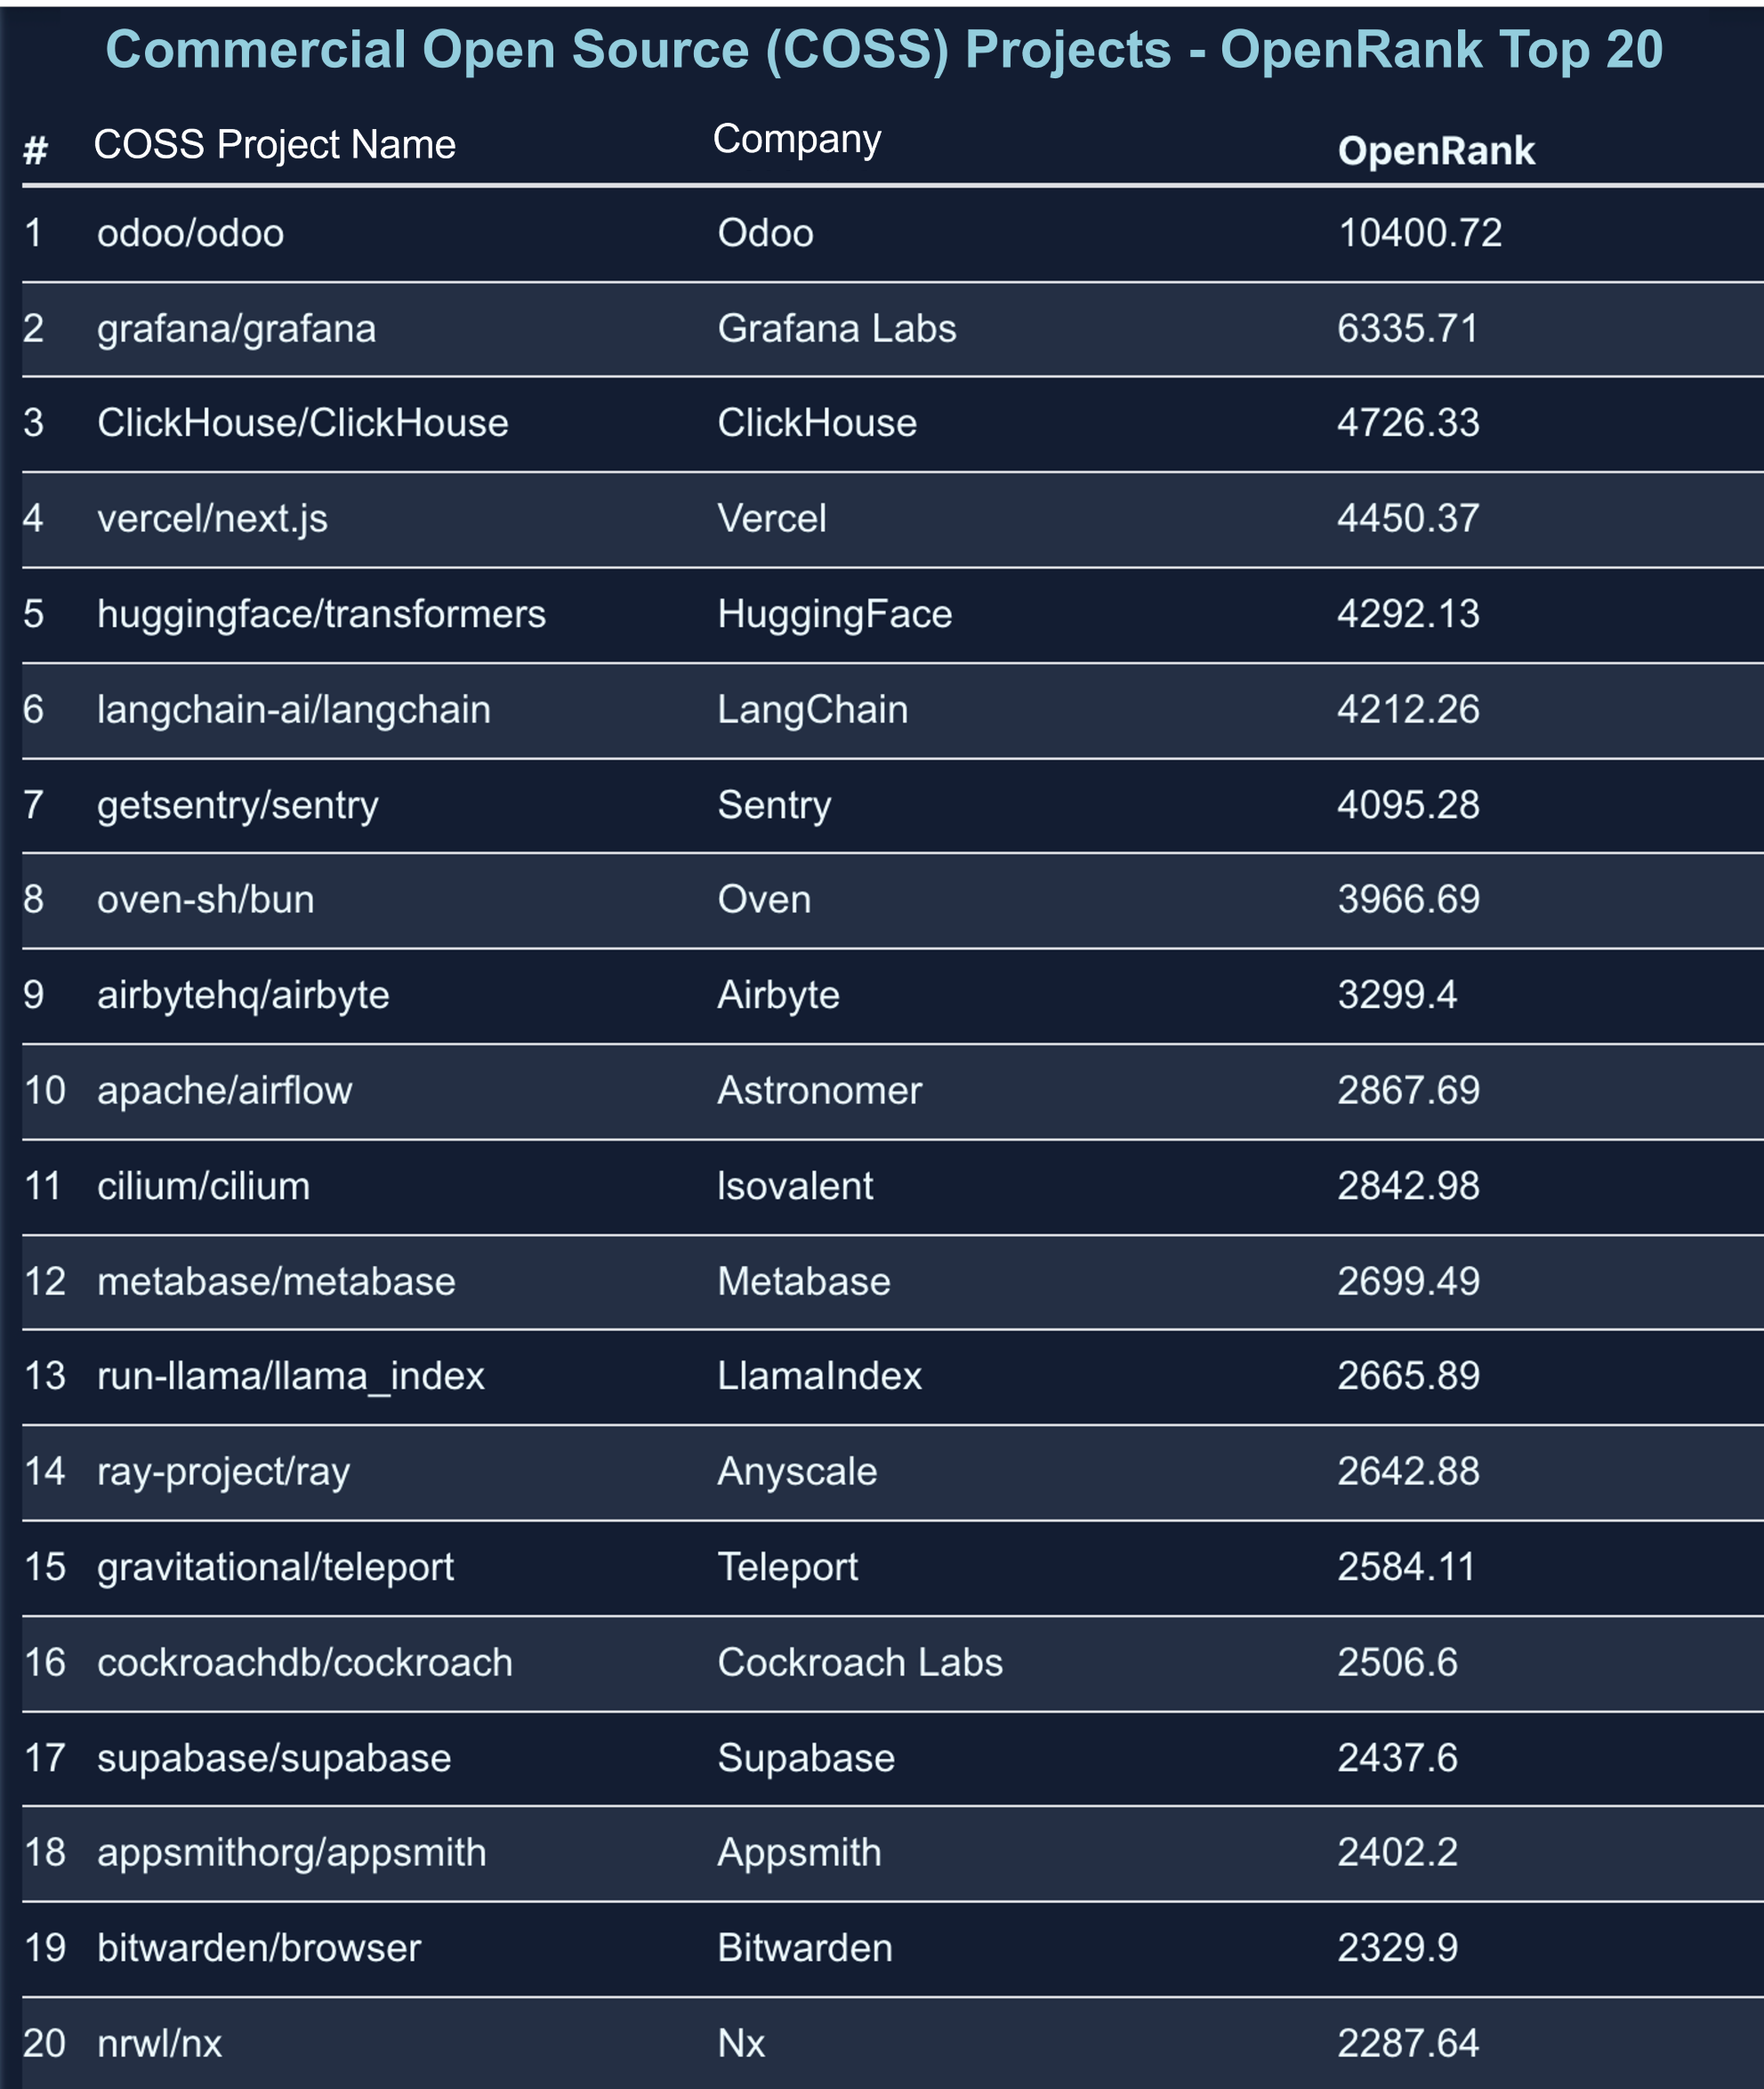
Odoo, as the world's No. 1 free and open source PLM management system, has the highest OpenRank and a high funding amount, probably because Odoo has strong community support and activity, as well as a wide range of enterprise application modules, giving it a high degree of influence and market recognition among open source projects.
Despite its technical recognition, oven-sh/bun's funding amount is relatively low, probably because the project is still at an early stage, the business model is not fully mature, or the market is still waiting to assess its business potential. As the project matures and market recognition increases, Oven's funding is expected to increase and its influence in the open source community is likely to continue to grow.
8.4 OpenRank Trends of Commercial Open Source Projects in the Last 5 Years
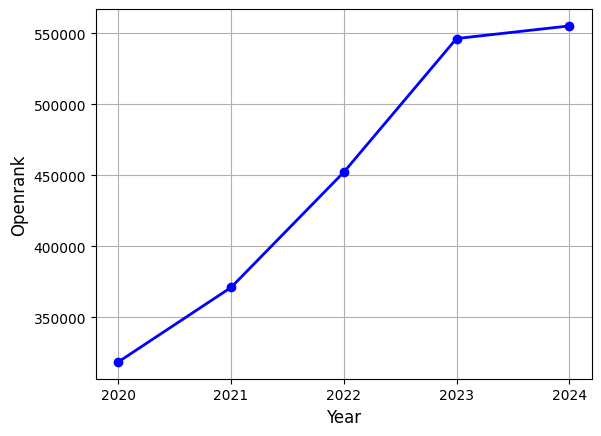
OpenRank for commercial open source projects has been on an overall growth trend over the past five years, with a rapid increase from 2020 to 2023, thanks to the prosperity of the open source ecosystem and corporate support; and a slowdown from 2023 to 2024, likely due to market saturation, project maturity and increased competition.
8.5 OpenRank Trends for Commercial Open Source Companies over the Last 5 Years
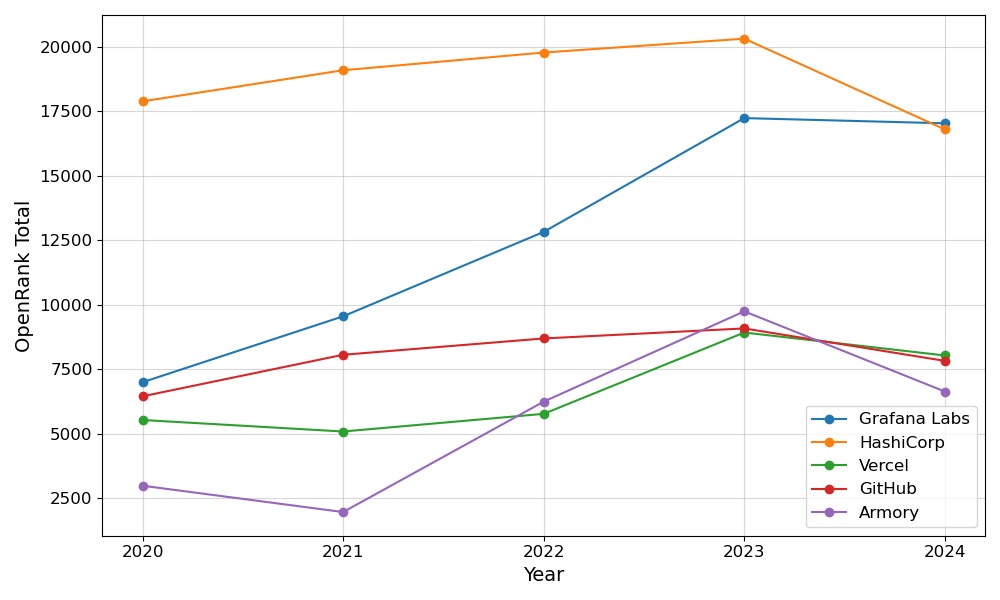
- HashiCorp's OpenRank grows steadily from 2020 to 2023, peaking and then dropping slightly in 2024.
- Grafana Labs grows significantly, gradually rising from a low ranking in 2020 to essentially tie HashiCorp in 2024.
- Vercel grows significantly, moving up from a mid-tier ranking in 2020, peaking in 2023 and then dropping back slightly.
- GitHub maintains steady growth, reflecting its importance as a core platform in the open source ecosystem.
- Armory's performance is more volatile, declining slightly from 2020 to 2021, but rebounding quickly in 2022, peaking in 2023 and then declining rapidly.
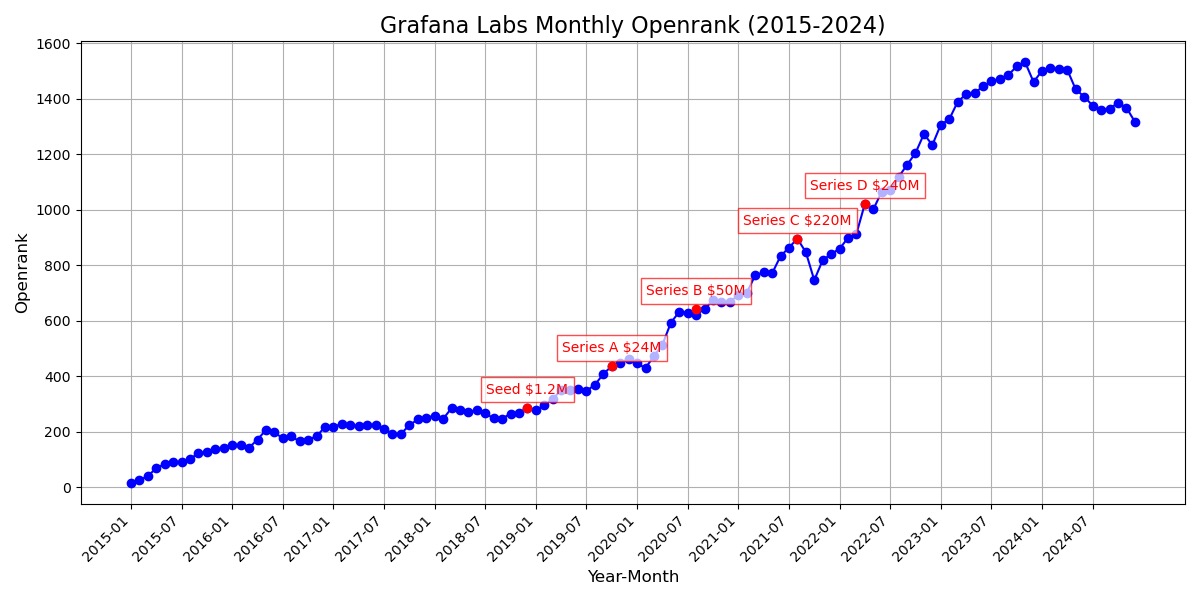
总体来看,每次融资都伴随着OpenRank的显著增长,这表明Grafana Labs能够有效地利用融资来推动公司的发展和市场地位的提升。同时,OpenRank的增长也反映了公司在开源社区中的影响力和认可度的提高。
8.6 Case Studies
In this section,we take Hangzhou FIT2CLOUD Information Technology Co., Ltd. (hereinafter referred to as FIT2CLOUD) as an example to introduce an enterprise's open source commercialization practices. FIT2CLOUD's open source commercialization practice is to leverage open source to achieve efficient “Product & Business” co-innovation, make good software products and keep selling them. FIT2CLOUD's business model is a freemium model based on open source, and the establishment of this business model needs to solve two things at the same time: 1、Continuously expanding the number of free installations;2、Continuously improving the conversion rate of paid users.
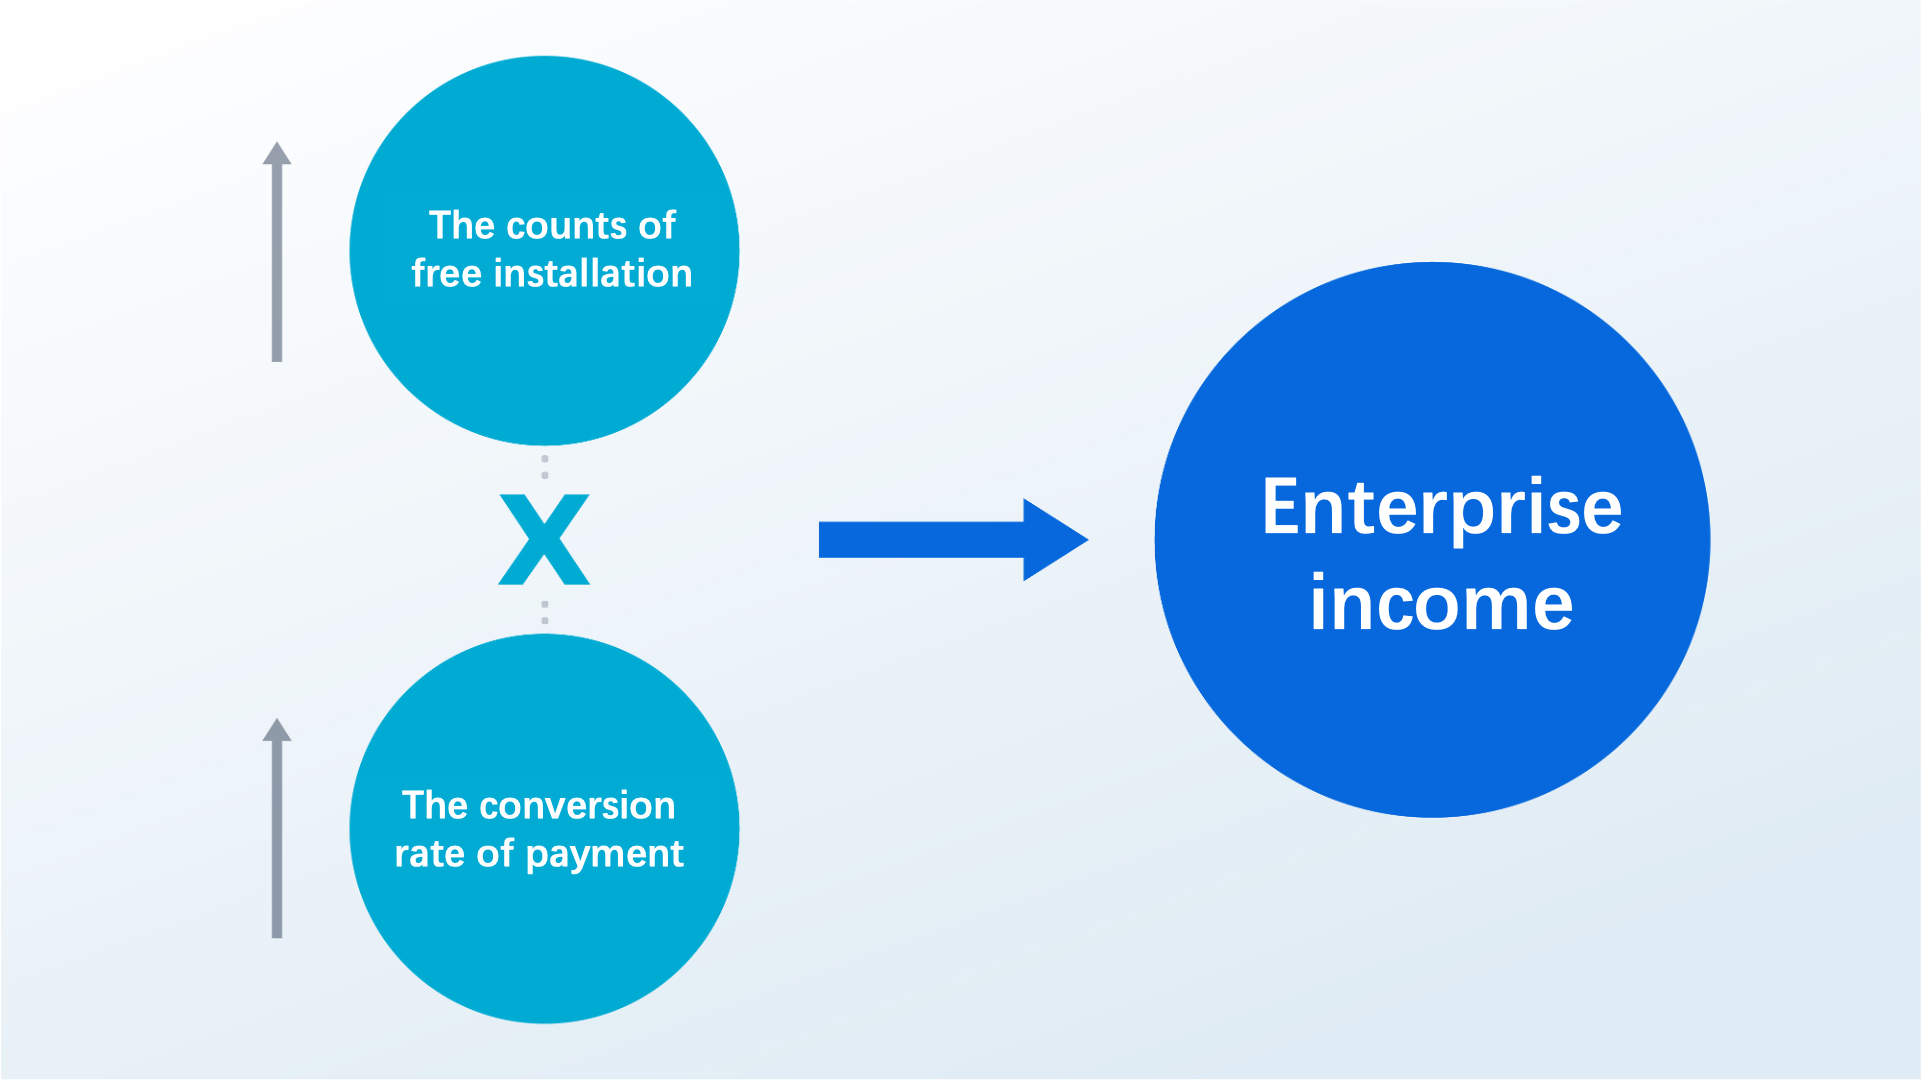
FIT2CLOUD's product philosophy is that "Good software is iterated." FIT2CLOUD leverages open source for efficient distribution, gets lots of feedback, and iteratively releases its products on a monthly basis. FIT2CLOUD's business philosophy is "Our products are bought, not sold." End-users are becoming key decision-makers in purchasing tool software products,and FIT2CLOUD enables online customer acquisition, sells standard products, and continues to increase cross-sell rates through a strong product portfolio. This cycle of "Open source attracts users - User feedback drives iteration - Iterated products attract more users - More users lead to more customers - More revenue leads to greater R&D investment" is the key to the true flywheel effect of the FIT2CLOUD business model.
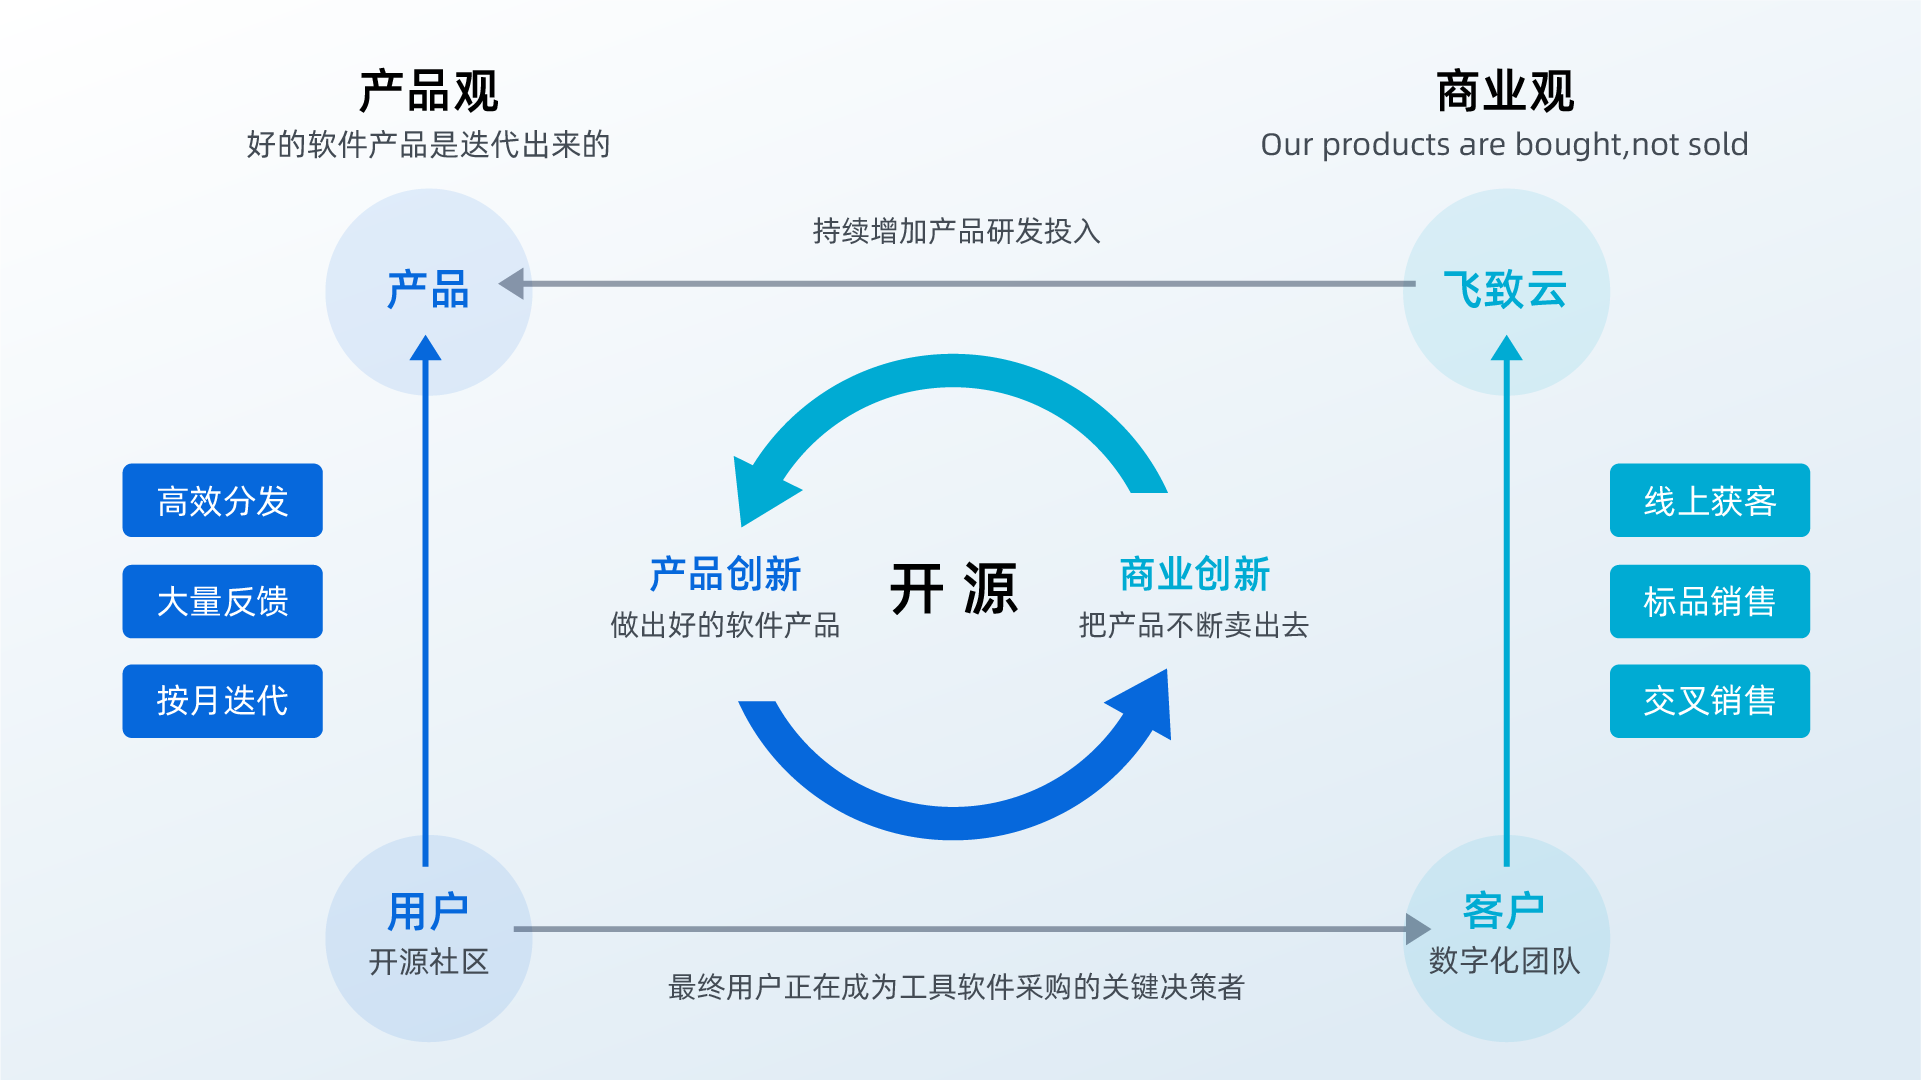
FIT2CLOUD's milestones in open source commercialisation can be verified by four figures:
- OpenRank Open Source Activity :FIT2CLOUD ranks 10th among Chinese enterprises and 47th globally in terms of OpenRank open source activity.
- OpenRank Open Source Influence:FIT2CLOUD ranks 9th among Chinese enterprises and 42nd globally in terms of OpenRank open source influence.
- Number of paying enterprises: By the end of 2024, FIT2CLOUD has served more than 3,000 enterprise customers in various industries such as finance, manufacturing, energy, transport, medical care, communications, media, real estate, Internet, education, and so on.
- Healthy Cash Flow : In 2024, FIT2CLOUD recorded 2,511 cash transactions from open source commercialization products, with annual cumulative revenue exceeding CNY 100 million (≈$14.29 million USD).
9. Open Source Insights for Higher Education
The Open Source Promotion Plan (OSPP) 2024, as a significant platform for deep interaction between universities and open source communities, has achieved remarkable results this year, effectively promoting the development of open-source technologies and the cultivation of talent in higher education. Since the inaugural OSPP, the X-lab Open Laboratory has been deeply involved. This year, we conducted the following data analysis on the relevant data for OSPP 2024.
9.1 OSPP Macro Analysis
- Overview of OSPP 2024: This year's OSPP brought together 168 open-source communities from various fields, including but not limited to operating systems, programming languages, artificial intelligence, and more. As shown in Figure 9.1, 2,537 students from universities worldwide launched 561 open-source projects, with 455 outstanding projects completed.
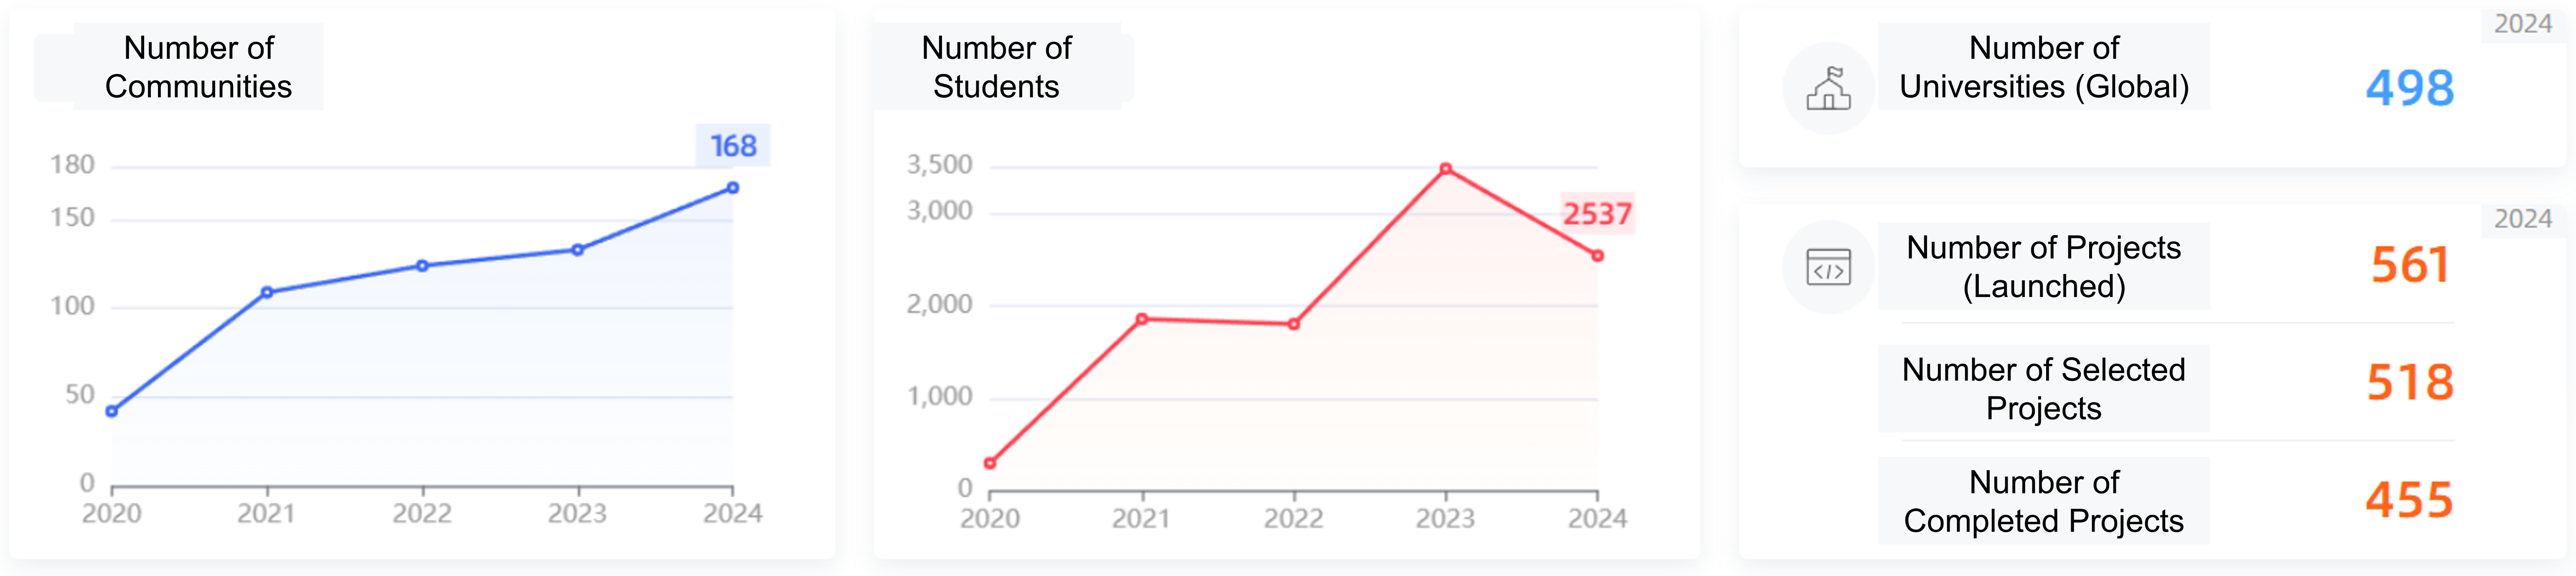
- Number of Communities: Since the inaugural OSPP, the number of communities participating in the event has shown remarkable growth each year. By 2024, the number of communities surged to 168, representing a significant increase compared to 2023. This growth trend can be attributed to several factors. On the one hand, more developers and project teams have recognized the powerful potential of open-source collaboration, attracting more communities to join the OSPP initiative. On the other hand, universities have increasingly emphasized the importance of open-source education, strengthening their collaboration with open-source communities to provide students with practical platforms.
- Number of Students and Universities: From 2020 to 2023, the number of student participants steadily increased, thanks to the gradual penetration of open-source culture in universities and the growing influence of the OSPP initiative. However, in 2024, the number of student participants slightly decreased to 2,537. This decline may be attributed to the moderate adjustments in project difficulty and requirements this year, as well as the diversion of some potential participants due to competition from other similar open-source events. As for the number of participating universities, since the launch of the event, its trend has largely mirrored that of student participation. That is, it steadily increased from 2020 to 2023 but saw a slight decline in 2024, for reasons similar to those affecting the number of student participants.
- Number of Projects: In the 2024 OSPP event, the total number of participants slightly decreased, but the number of projects still reached 561. In terms of project completion, 455 projects were successfully concluded, with the completion rate jumping from 70% last year to 81%. This outstanding completion rate can be attributed to several factors. First, the organizers optimized the project management process. At the initial stage of the projects, they provided students and mentors with more detailed and targeted guidance manuals and training courses, covering everything from project planning to overcoming technical challenges. Second, community mentors played a more active and critical role this year. They not only provided students with professional technical guidance but also shared valuable insights on time management, team collaboration, and more. Lastly, students have shown increasing dedication and commitment to open-source projects, enabling them to efficiently complete project development tasks. This has significantly contributed to the notable improvement in the project completion rate.
9.2 OSPP Annual Student-College-Related Distribution Analysis
- Geographical Distribution of Universities: The geographical distribution of participating universities in the Summer of Open Source 2024 is shown in Figure 9.2, while a comparison with the 2023 distribution is provided in Figure 9.1. In 2023, a total of 592 universities participated, including 489 domestic universities and 103 foreign universities, with foreign universities accounting for 17.4% of the total. By 2024, the total number of participating universities had decreased to 498, with domestic universities dropping to 399 and foreign universities slightly decreasing to 99. However, the proportion of foreign universities increased to 19.9%. This change indicates that while the overall scale of university participation has shrunk, the relative proportion of international collaboration has grown. As the international influence of OSPP continues to expand, it has attracted more attention from foreign universities. Despite fluctuations in absolute numbers, the rising proportion reflects a deepening trend in international cooperation. This shift is significant for fostering global open-source technology exchanges and promoting the international integration of talent cultivation. It also suggests that in OSPP’s future development, international collaboration will become a key growth driver and a distinctive highlight.
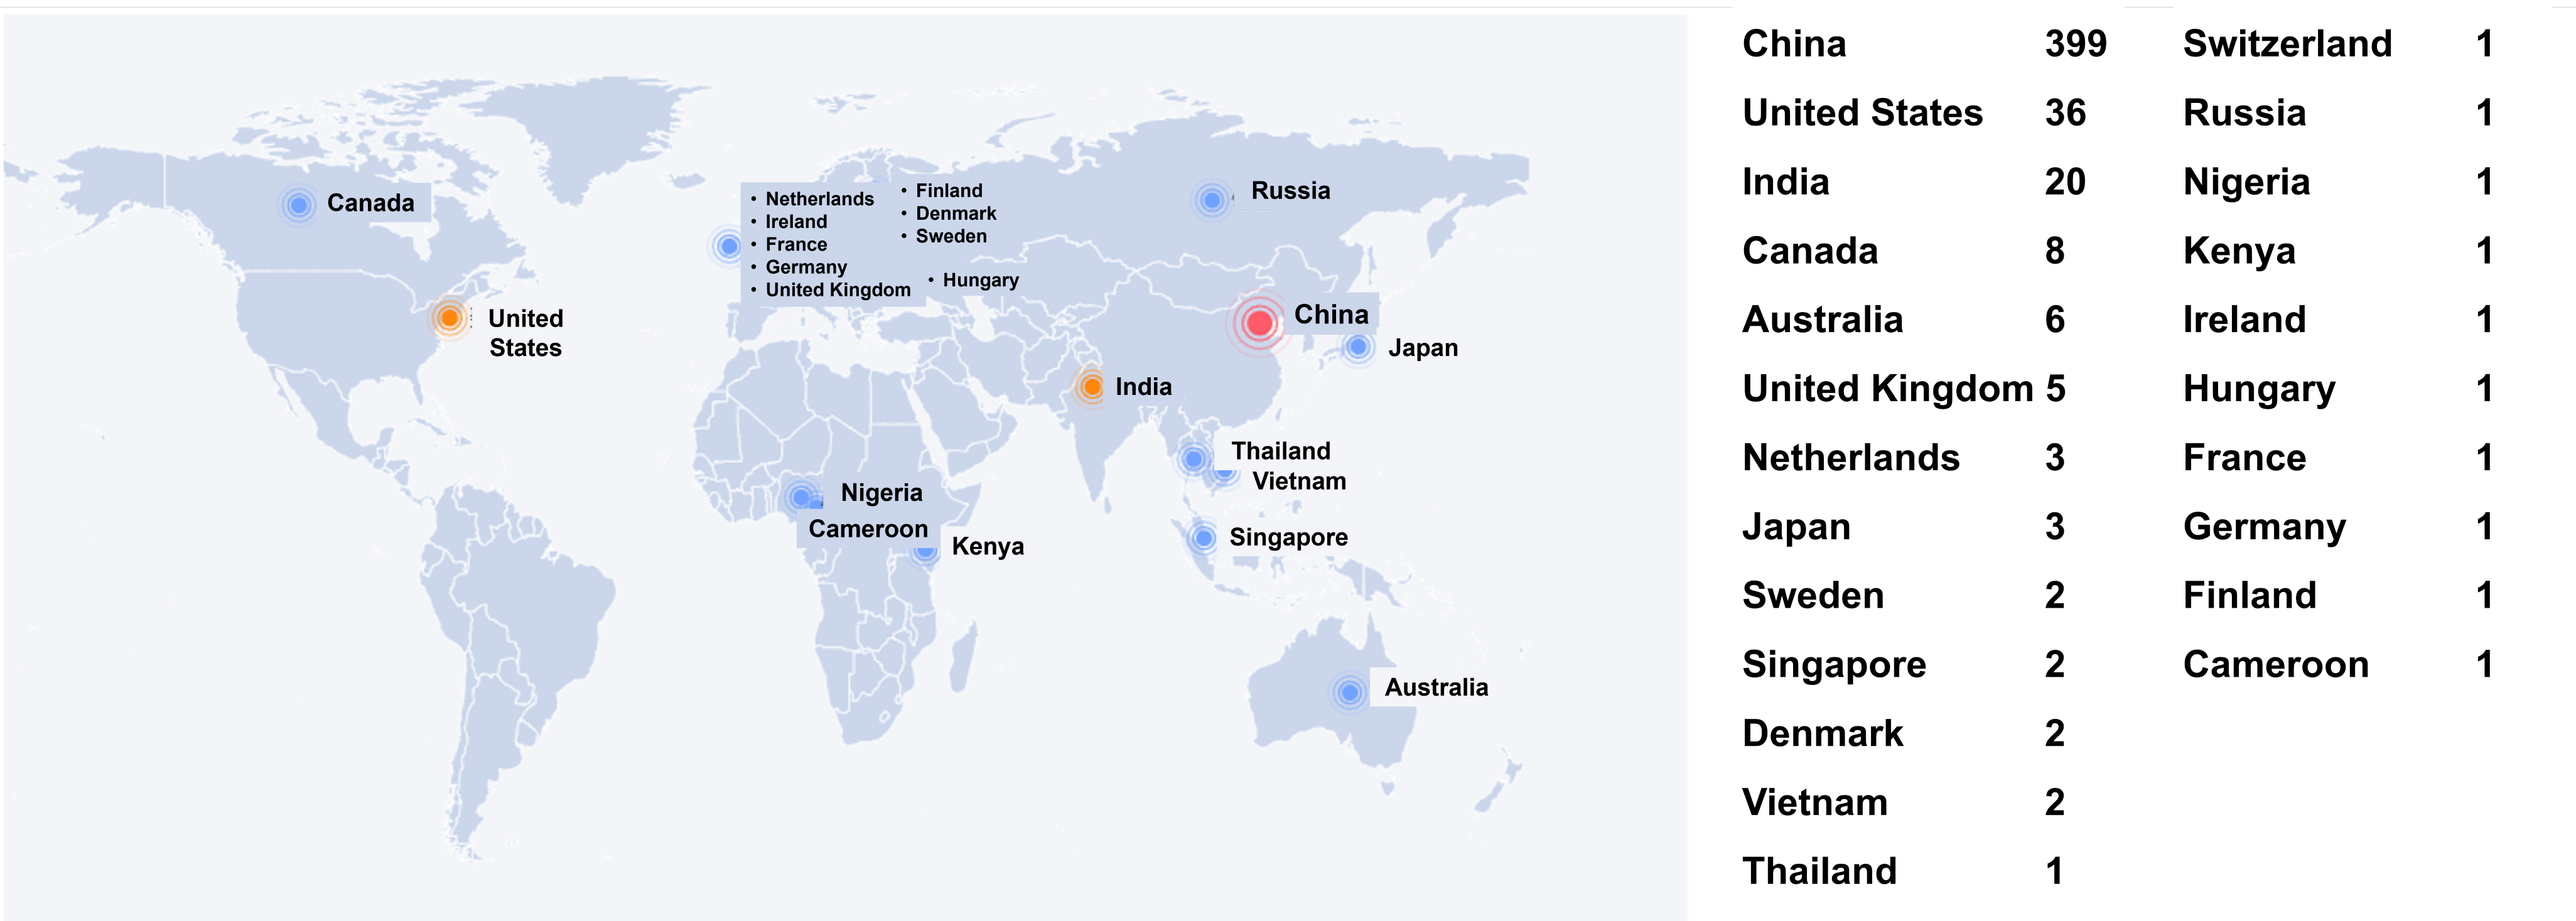
| OSPP Year | Total Universities | Domestic Universities | Foreign Universities | Percentage of Foreign Universities |
|---|---|---|---|---|
| 2024 | 498 | 399 | 99 | 19.9% |
| 2023 | 592 | 489 | 103 | 17.4% |
- Educational Background Distribution of Students: The educational background distribution of students participating in OSPP 2024 is shown in Figure 9.3, while a comparison with 2023 is provided in Table 9.2. It can be observed that, in addition to a large number of outstanding students from China, many students from various countries around the world also took part in the program. Among all participants, the majority were undergraduate and master's students, with a smaller proportion being doctoral students. Specifically, a comparison of the educational background distribution of OSPP students in 2023 and 2024 shows that the overall structure has remained relatively stable. The changes in distribution reflect that the dynamic development trend of the OSPP program among students of different academic levels remains steady, with its primary target audience still being undergraduate and master's students.
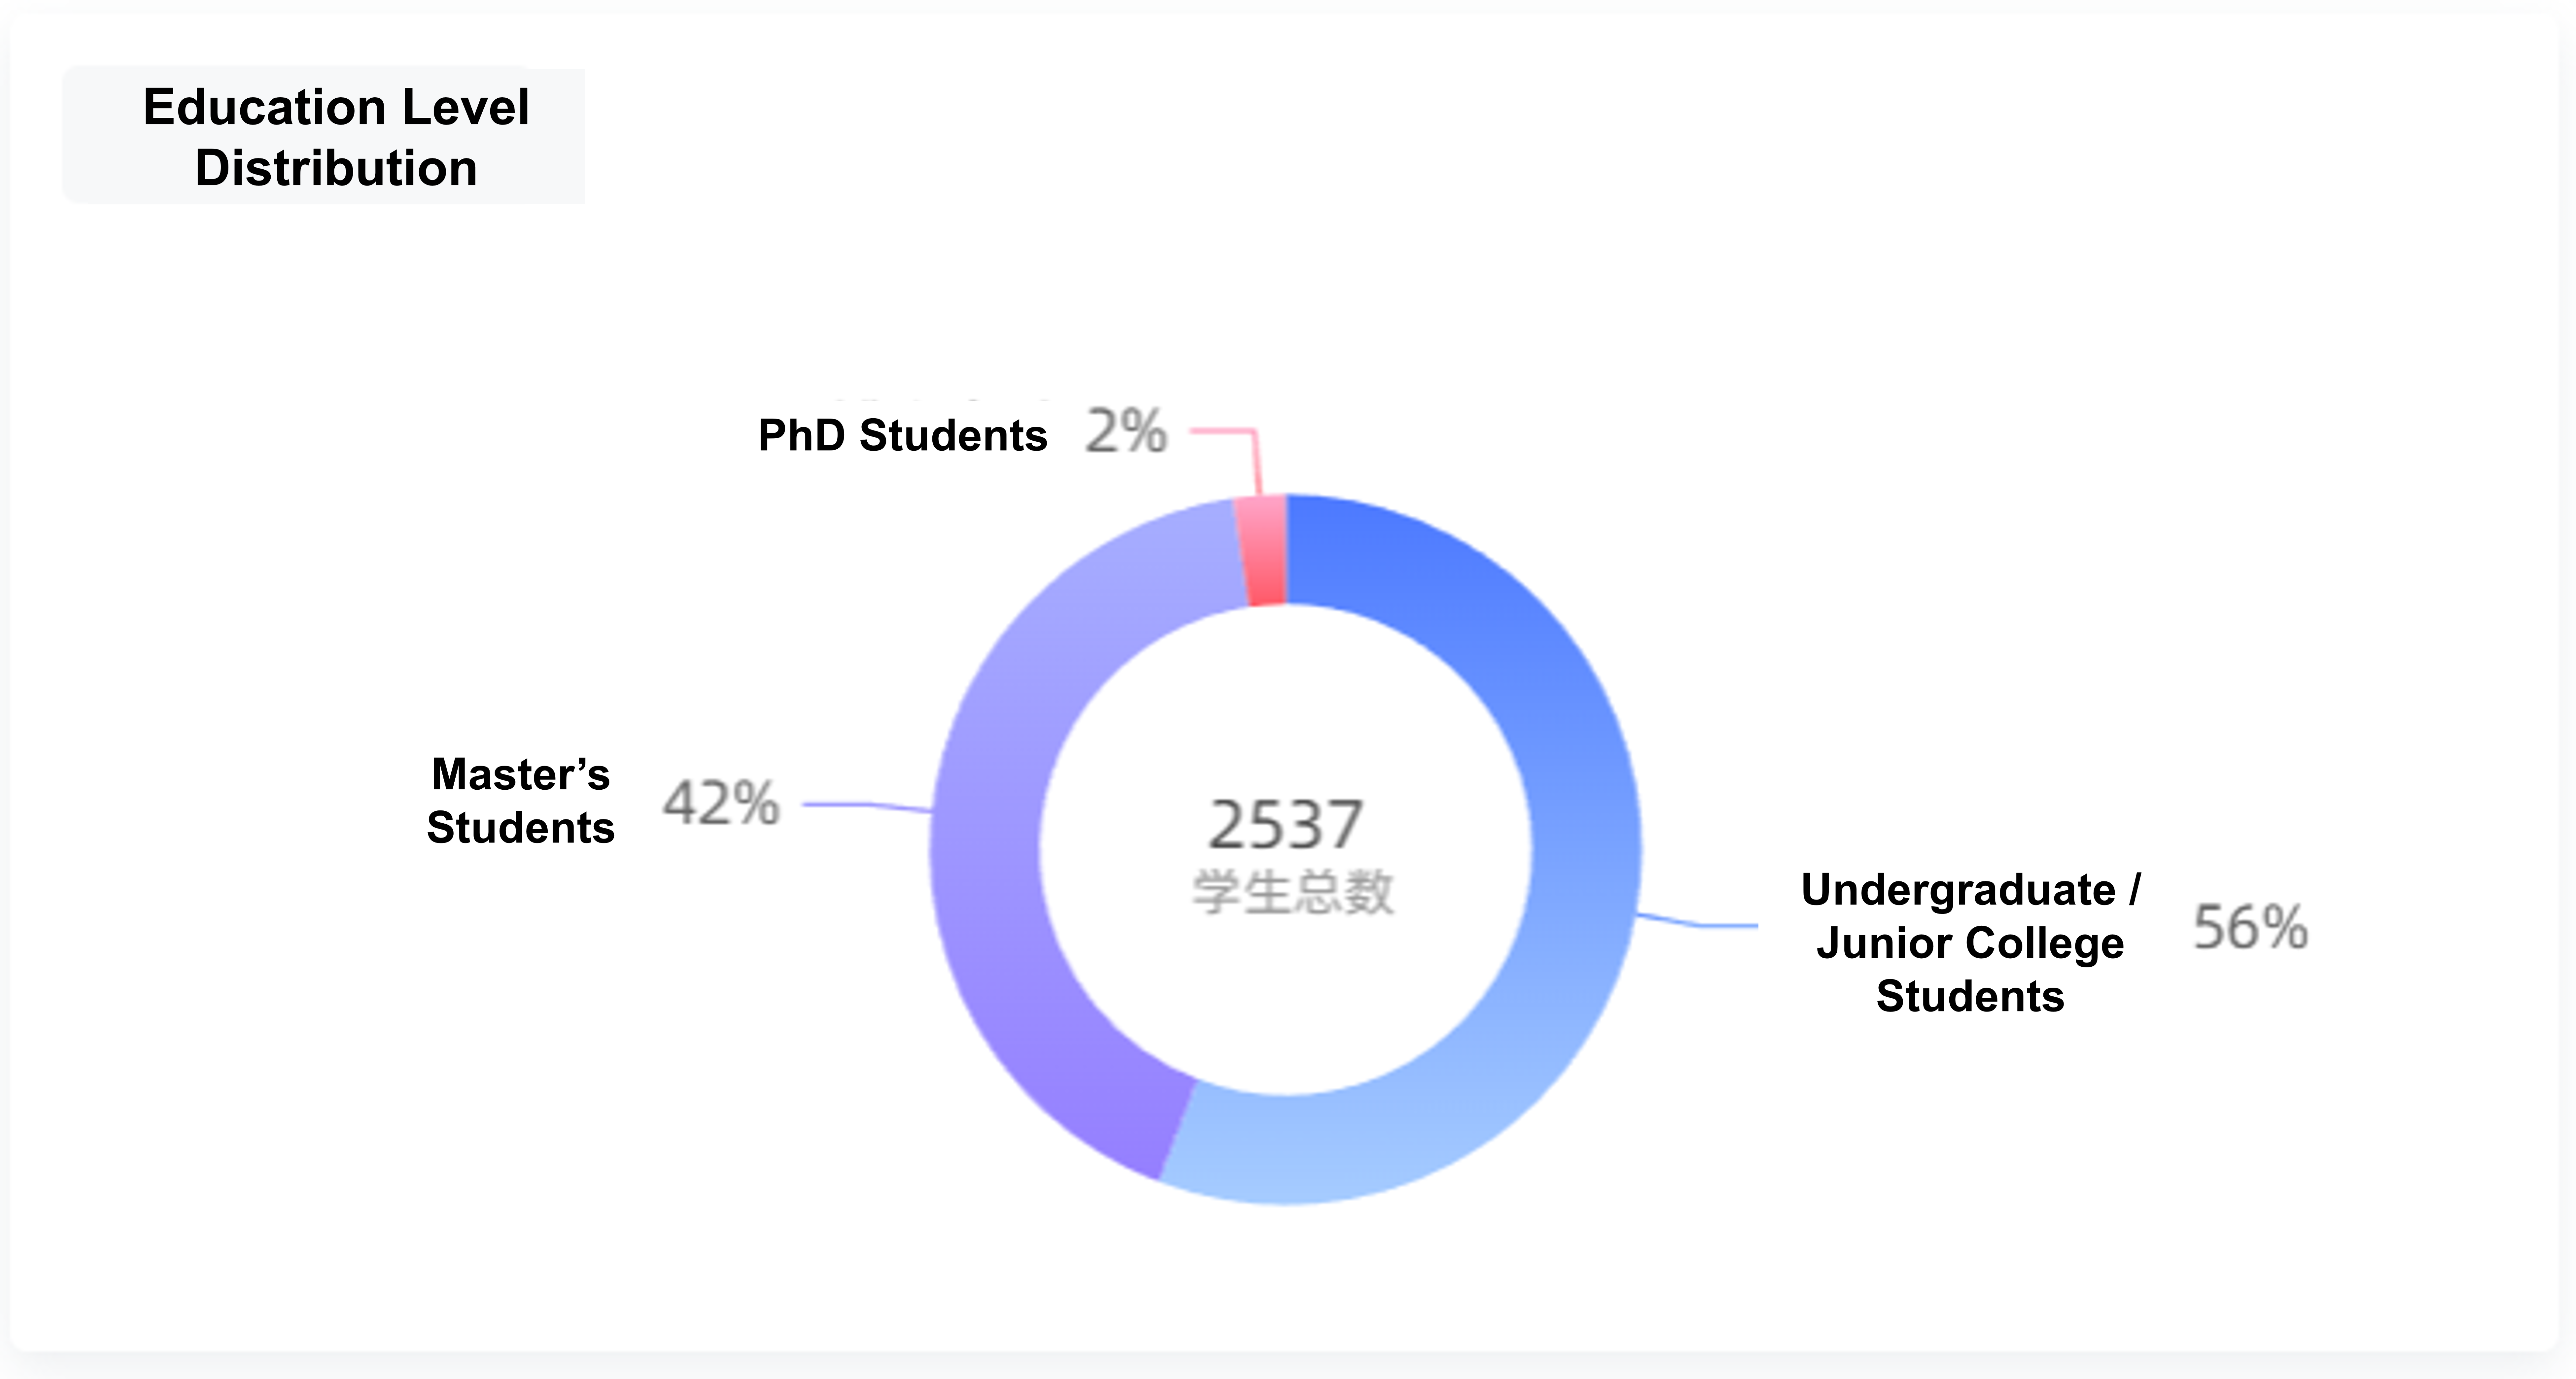
| OSPP Year | Total Students | Undergraduate/Associate Percentage | Master Percentage | Doctor Percentage |
|---|---|---|---|---|
| 2024 | 2537 | 56% | 42% | 2% |
| 2023 | 3475 | 57% | 41% | 2% |
9.3 Contribution Analysis of OSPP by Year
Based on the above statistical data, a detailed analysis of the contribution levels of participating universities and students involved in various communities over the past two years of OSPP has been conducted. This analysis integrates the annual contribution data and the community OpenRank algorithm to provide deeper insights.
9.3.1 University Contribution
The annual ranking of university contributions, calculated using the OpenRank algorithm, is shown in Figures 9.4 and 9.5. Figure 9.4 presents the top 20 universities with the most significant contributions in OSPP 2024, while Figure 9.5 displays the corresponding university rankings for OSPP 2023.
In the 2024 rankings, Xi'an University of Posts and Telecommunications topped the list with an OpenRank score of 85.13, involving 15 students, with an average OpenRank of 5.68 per student. Not only did its OpenRank score see a significant increase, but the number of participating students was also considerable, indicating a substantial overall contribution to OSPP. Longdong University ranked second with an OpenRank score of 61.37, but it had only one participating student, resulting in an exceptionally high per-student OpenRank of 61.37. This suggests that the student possessed unique technical expertise or innovation capabilities, allowing them to independently complete high-value project tasks. Similarly, Shanghai University secured third place with an OpenRank score of 42.21, with only two students participating in the program.
In the 2023 rankings, the top three universities were Huazhong University of Science and Technology, Zhejiang University, and Beijing University of Posts and Telecommunications. It can be observed that these universities had relatively high overall contributions to OSPP. Among them, although Huazhong University of Science and Technology did not have the highest number of participating students, its outstanding per-student OpenRank performance allowed it to achieve the highest total OpenRank score. On the other hand, universities like Fudan University, Longdong University, Wuhan University, and Chengdu University of Information Technology may not have had the largest number of students, but the high contributions of individual students helped these universities secure higher final rankings.
- OSPP University Contribution Ranking 2024:
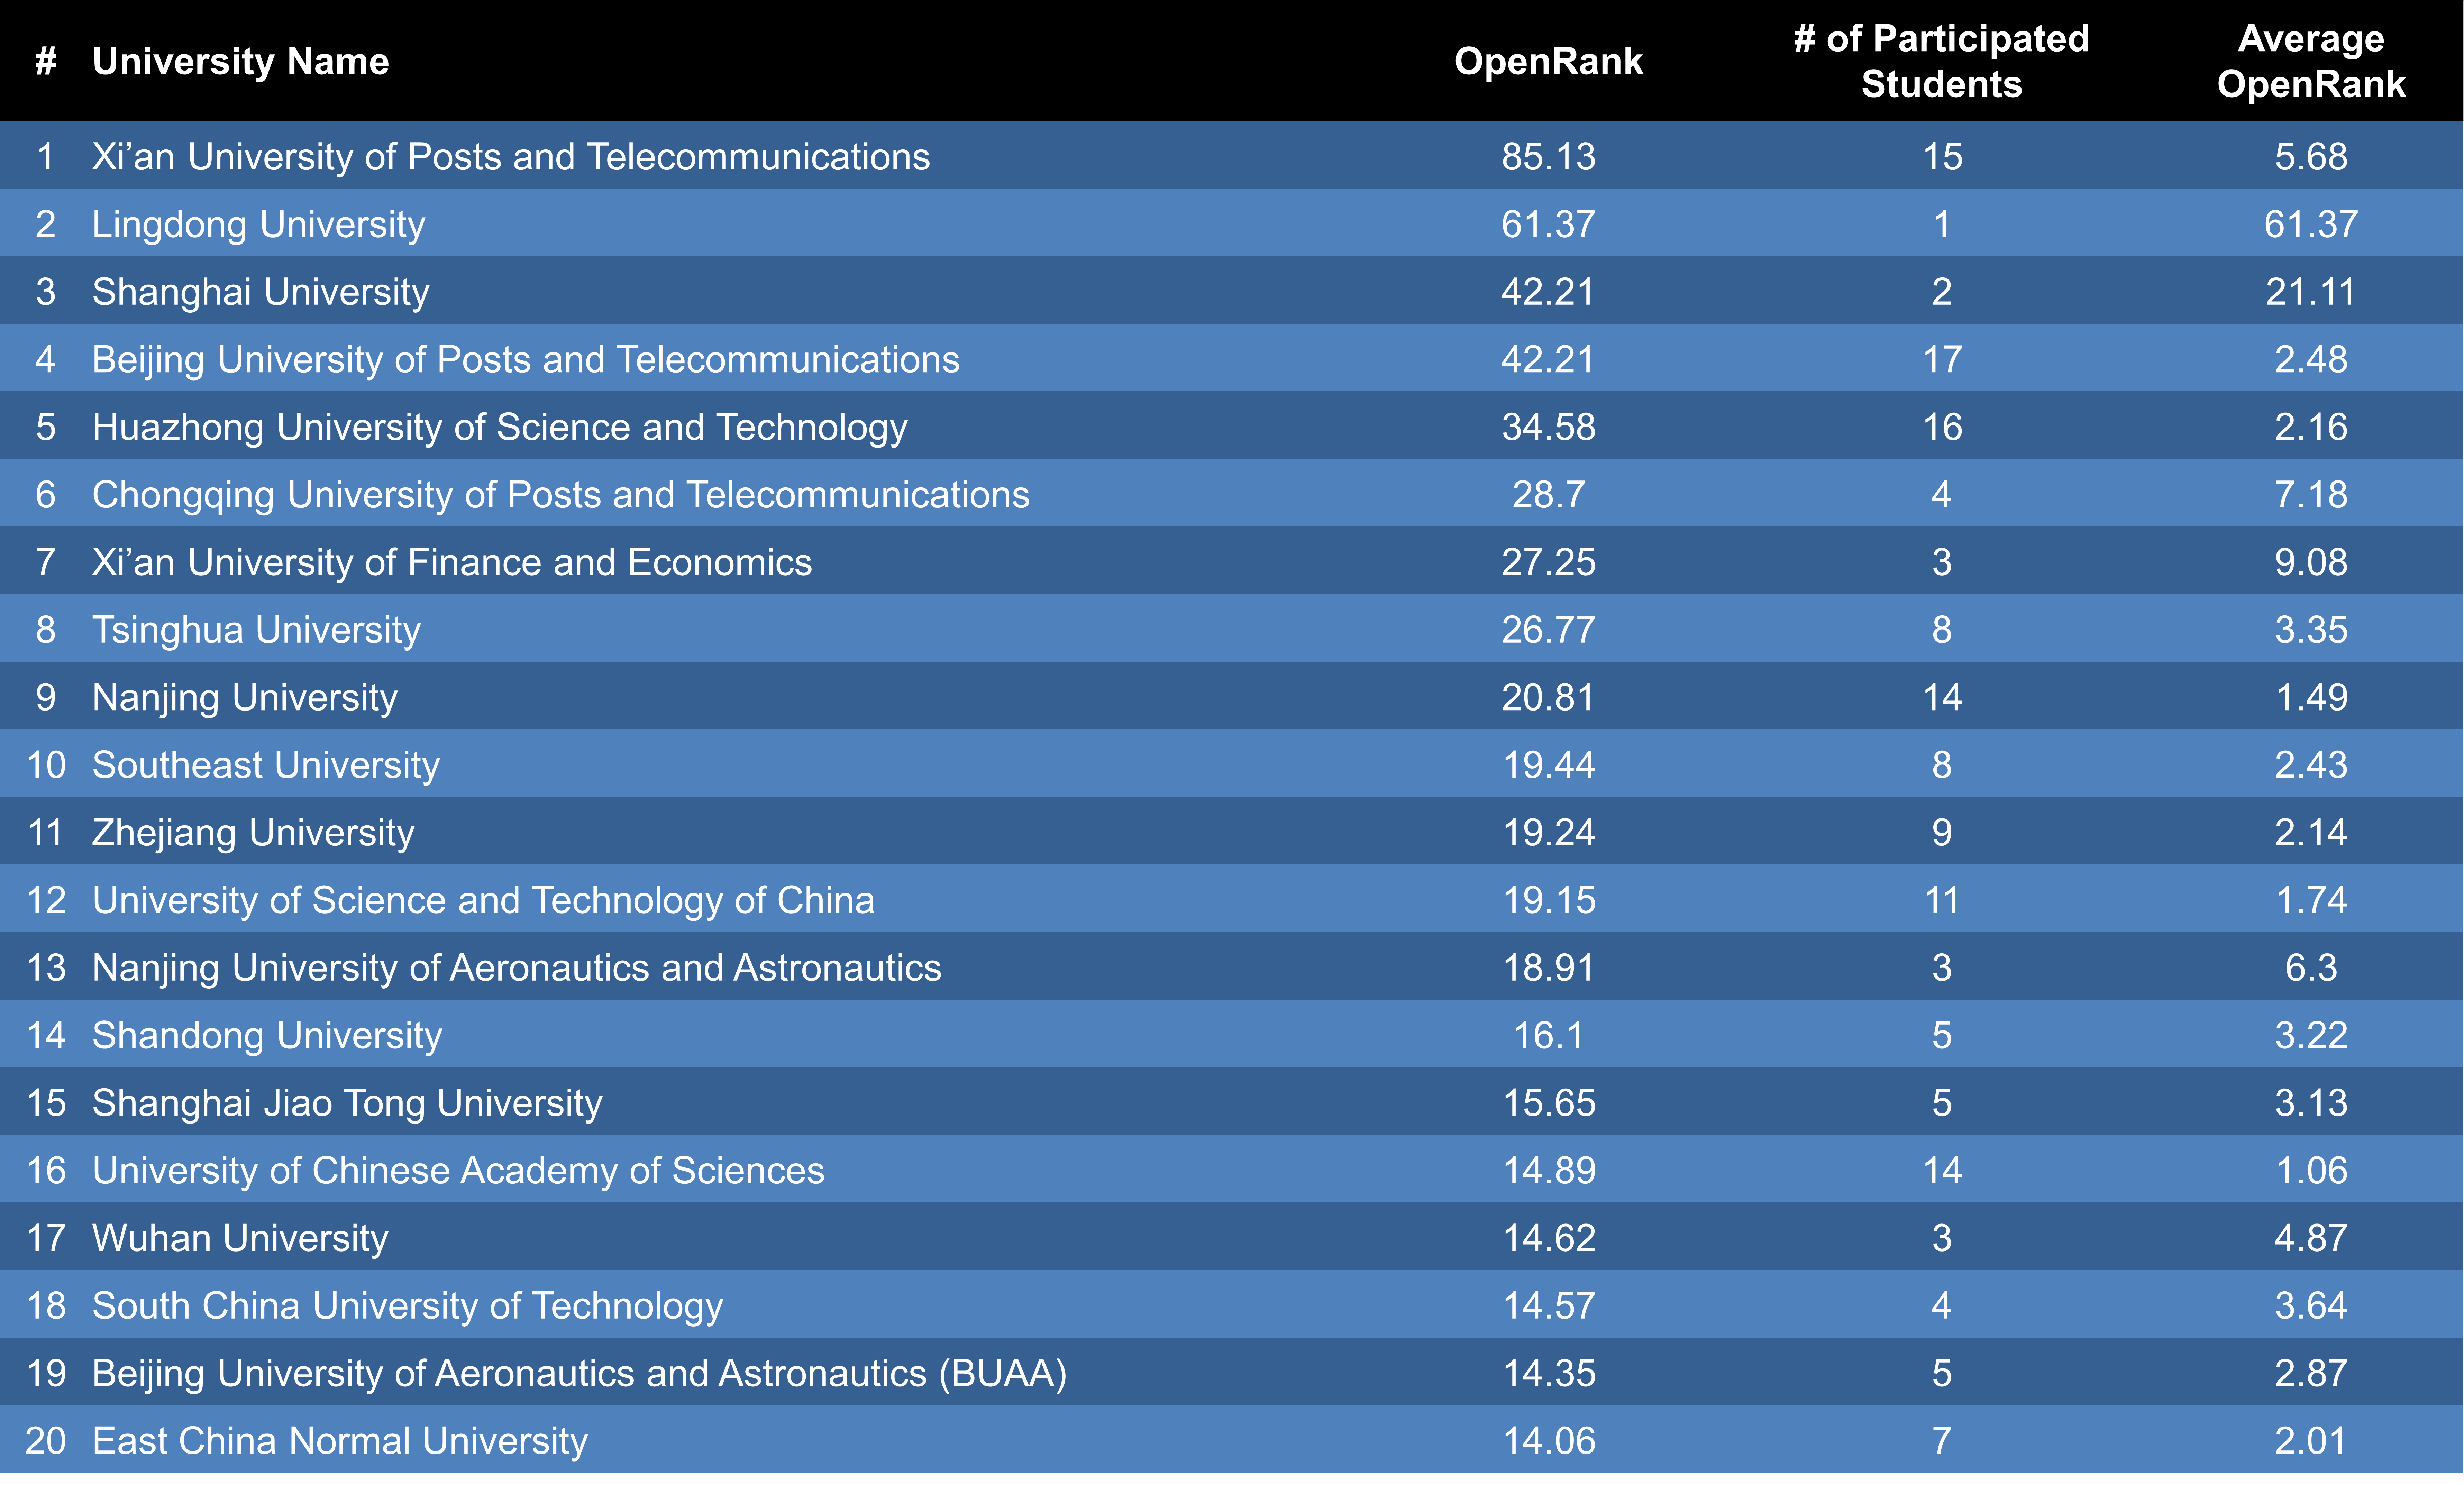
- OSPP University Contribution Ranking 2023:
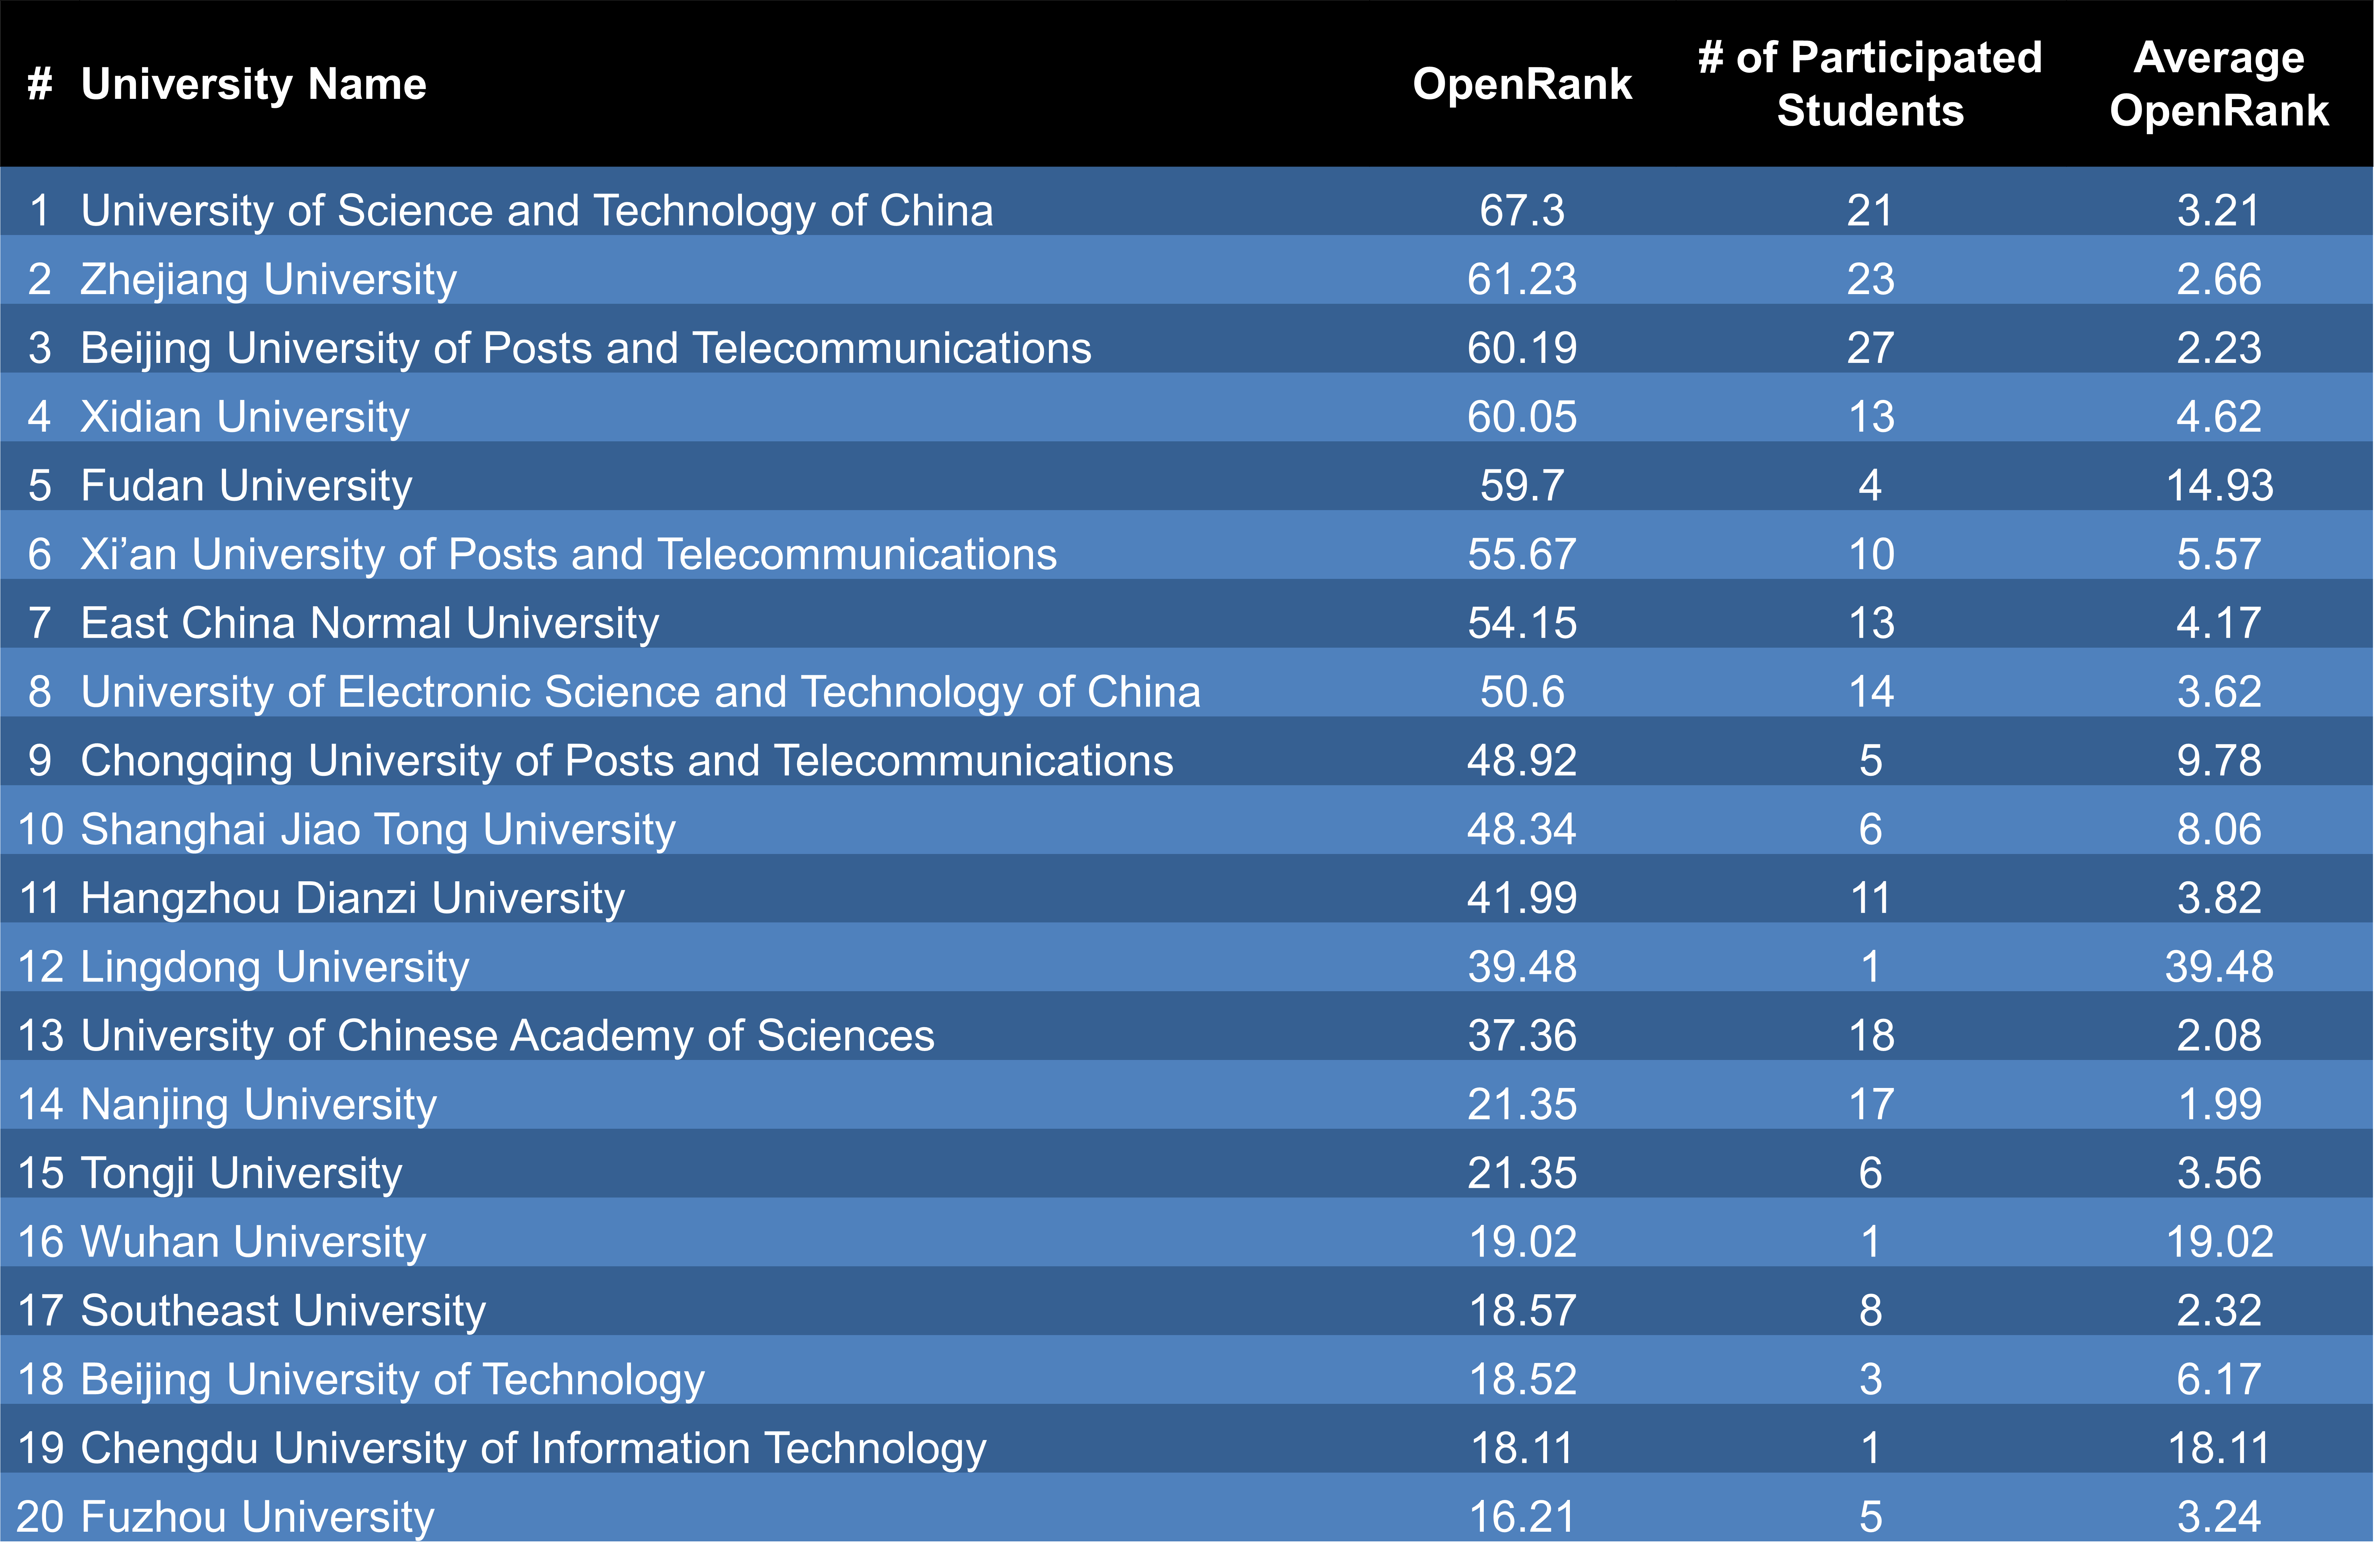
By comparing the university contribution rankings in 2023 and 2024, the changes in the rankings from multiple perspectives, such as ranking place and contribution, were also analyzed.
First, in terms of ranking changes, Xi'an University of Posts and Telecommunications and Longdong University have risen significantly. The former has risen from sixth place in 2023 to first place in 2024, making a huge leap. This ranking improvement reflects the school's rapid development and aggressiveness in open source project practice; while the latter has risen from twelfth place in 2023 to second place in 2024, and its ranking increase is also remarkable. Although only one student from the university participated in the project in 2024, the student made a very high contribution.
9.3.1 Student Contribution
This section will provide a detailed analysis of the student contribution ranking data for OSPP 2023 and 2024, along with the changes observed. From the perspective of participating communities, the open-source communities students engaged in were highly diverse. These communities included a range of types, such as Apache Hadoop, MatrixOne, Spring Cloud Alibaba, and more. This reflects the broad technical scope of the OSPP project, offering students opportunities to engage in open-source practice across different areas. The specific rankings are shown in Figures 9.6 and 9.7.
- OSPP Student Contribution Rankings 2024:
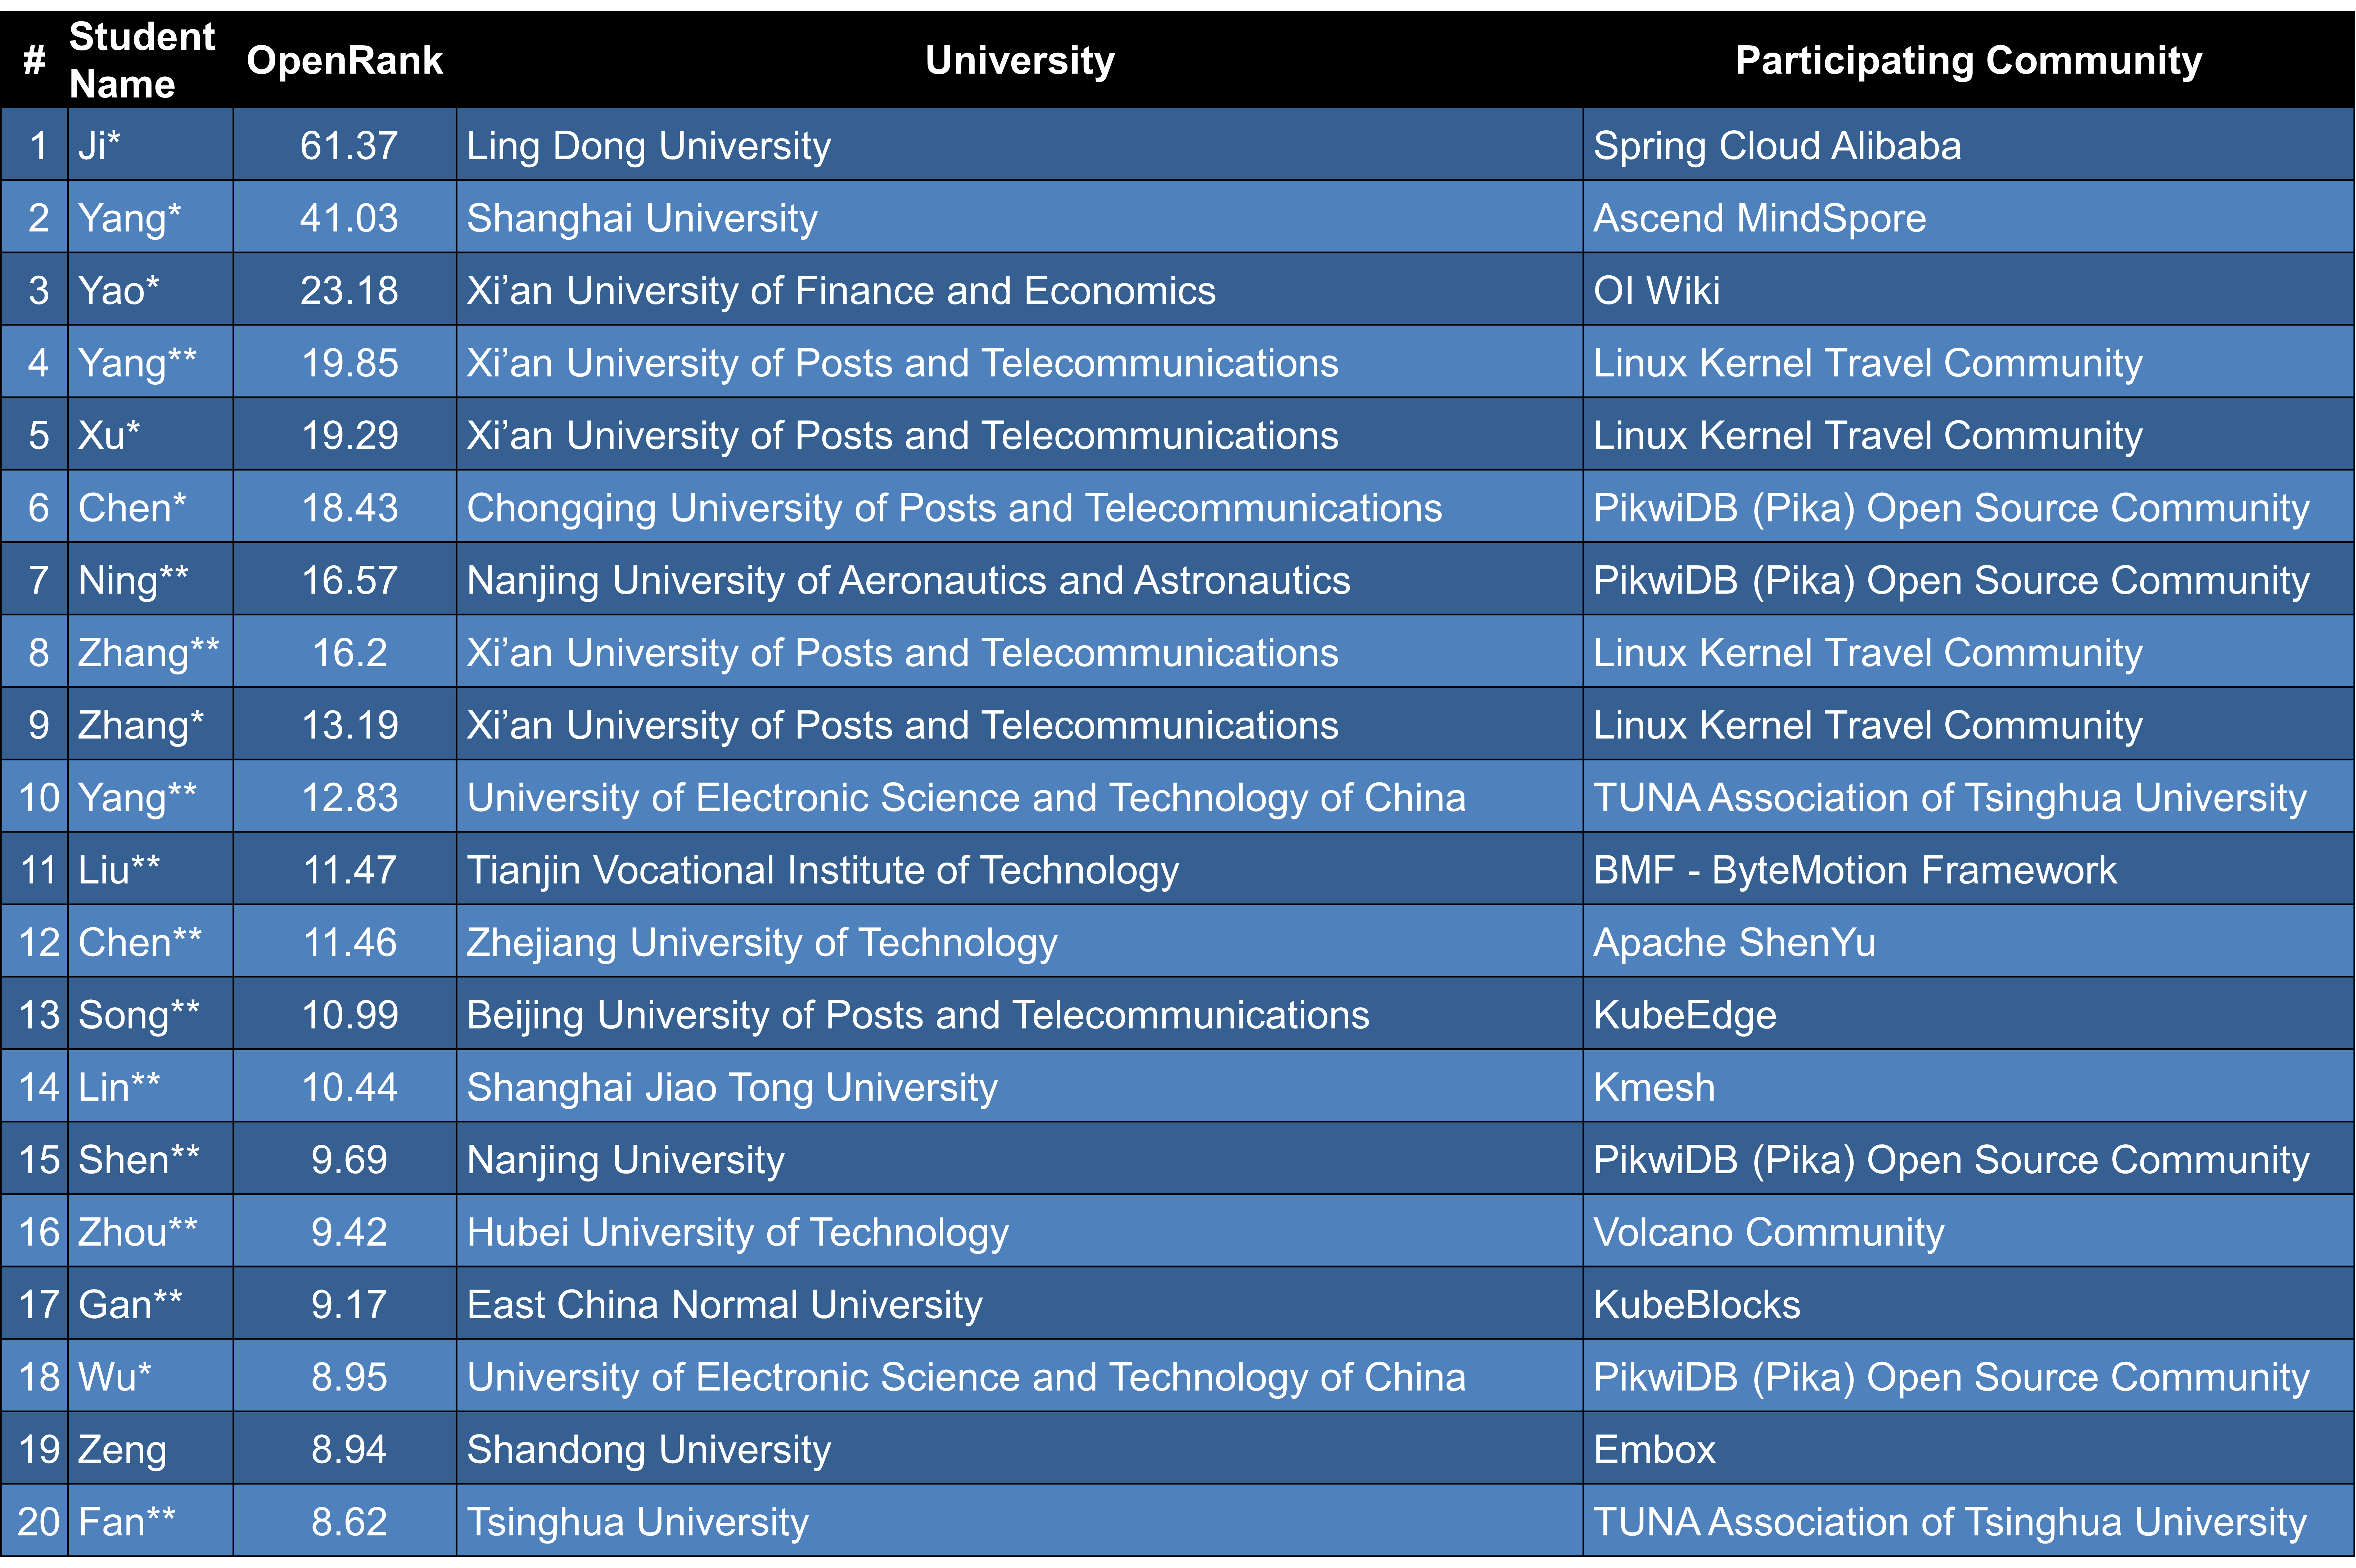
- OSPP Student Contribution Rankings 2023:
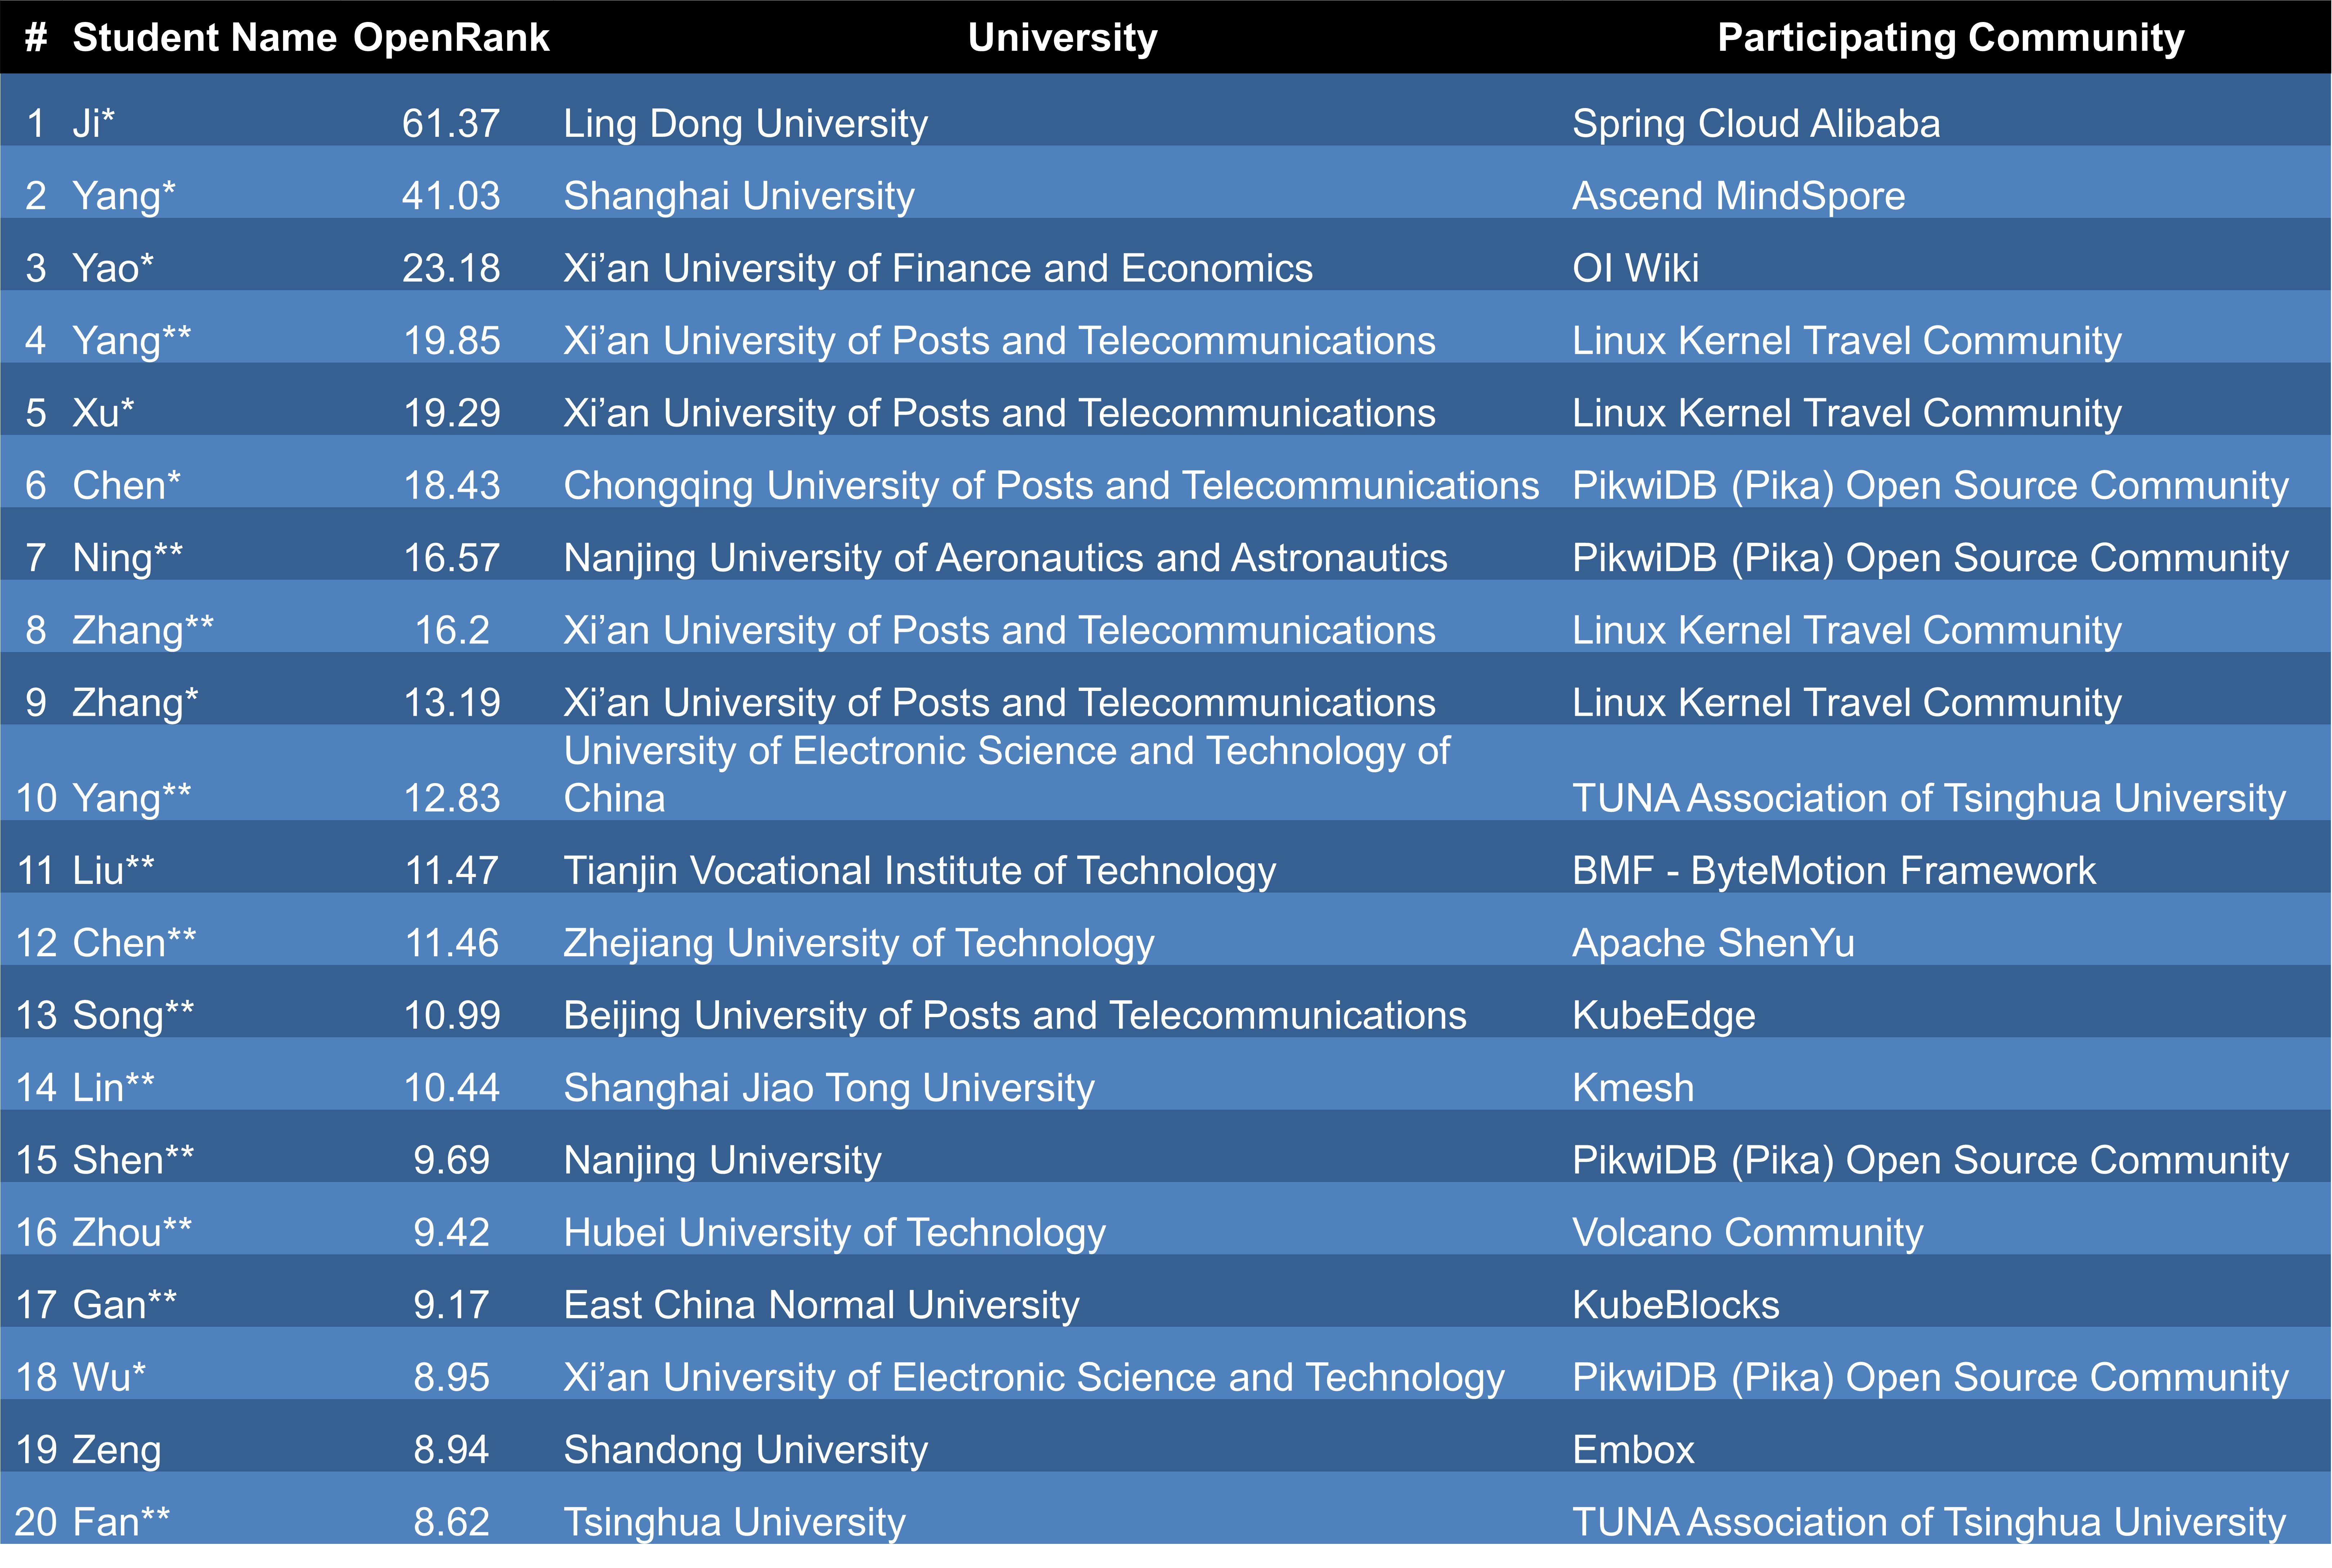
By comparing the student contribution rankings of 2024 and 2023, it can be observed that universities such as Longdong University, Shanghai University, and Xi'an University of Finance and Economics had students who ranked high in 2024. This indicates that in open-source projects, it is not only students from traditionally dominant universities who can achieve high contribution levels; students from relatively lesser-known universities, if they have sufficient skills and commitment, can also stand out in the rankings.
Regarding the communities participated in, this year's OSPP situation is similar to 2023, with students still engaging in a diverse range of communities. However, in some specific communities, such as Spring Cloud Alibaba and MindSpore, there has been a significant increase in student contributions. This could be related to the project demands and development directions of these communities in 2024, as well as growing student interest in related technologies. On the other hand, the concentration of contributions in this year's OSPP has changed. While there are still some students with OpenRank scores far above the average, the overall gap has narrowed compared to 2023. This could be due to the promotion and development of the OSPP project, where more students have acquired effective methods for participating in open-source projects, thereby improving their contributions. As a result, competition among high-contribution students has become more intense.