 2025 COSR
OSS Questionnaire
1. Background of the Report
Since the release of the "2015 China Open Source Community Participation Survey Report" at the beginning of 2016, Kaiyuanshe has continuously published annual open source developer survey reports, aiming to present the current status and trends of China's open source development from multiple dimensions. In 2025, we continued this tradition, drawing on data analysis methods and survey tools to further map China’s open-source landscape and to help open-source communities, developers, and industry professionals understand how the domestic ecosystem is evolving.
This section continues to examine participation at every level of the open source community. Through a multidimensional set of questions, it seeks to develop a detailed understanding of respondents’ personal backgrounds, employment, involvement in open-source communities, and technical profiles. The survey defines a series of role tiers according to depth of engagement — users, participants, contributors, maintainers, and ecosystem operators — with the aim of capturing the participation and influence of each tier within the community. The definitions are as follows:
User: A user who has used one or more open source products.
Participant: A user who interacts with the open source community (for example, engaging in communication with the open source community, participating in community-organized activities, etc.).
Contributor: A user who has made substantial contributions to the open source community (including code and non-code contributions).
Maintainer: A user mainly responsible for the daily operation of the open source community (including project maintainers, PMC members, etc.).
Additionally, ecosystem operators are users primarily responsible for the daily operation of open source communities. They rank above participants and, together with maintainers, are collectively referred to as operators.
As in previous years, the survey goes beyond basic information to include questions tailored to the characteristics of each role group, in order to better understand the motivations, contribution patterns, and influence of respondents at each level.
The survey parameters are as follows:
Respondents: Developers, community members, contributors, students, managers from government and industry
Survey Content: Mainly covers personal information, employment status, open-source community participation, and developers’ technical background
Survey Method: Sample and data collected via online questionnaire, analyzed using cross-tabulation
Distribution Channels: circulated online through Kaiyuanshe’s own online channels and reposts by CSDN's WeChat official account, and distributed offline at Kaiyuanshe events and the 10th China Open Source Conference (COSCon’25).
Question Types: Single-choice, multiple-choice, and open-ended
Number of Questions: 37
Sample Size: 350
2. Survey Findings at a Glance
Respondent Profile
Age and Gender. The survey collected 350 valid responses. Respondents’ age ranged from under 21 to over 50, with the 21–30 cohort forming the largest group by a clear margin. Men accounted for 258 respondents, roughly three-quarters of the sample, and women for 92, roughly one-quarter. Open-source participation thus remains predominantly male, though the share of women is by no means negligible.
Education. Respondents were highly educated overall: the great majority held a bachelor’s degree or above. Bachelor’s degrees accounted for just under half and master's degrees for close to 40%, while doctorates and above made up only a small fraction. Junior-college and high-school-or-below qualifications together came to less than 10%. This indicates that the sample is heavily concentrated among technical and research professionals with a university education.
Occupation. By occupation, back-end and full-stack developers were the two principal technical roles, together accounting for roughly two-thirds of respondents; students formed the next largest group, at a share that was itself substantial. The remainder spanned a long tail of roles — academic researchers, front-end developers, embedded and desktop developers, managers and executives, AI and large-model engineers, open-source community operators and maintainers, QA engineers, designers, and developer-relations professionals — together forming a reasonably well-rounded picture of open-source occupations.
Location. By region, eastern China was home to the largest share of respondents, at roughly 60%, followed by northern China at nearly 30%; the central and western regions together represented just over 10%. Respondents were thus heavily concentrated along the seaboard and the Bohai Rim, suggesting that participants cluster more readily in regions where universities and the internet industry are concentrated.
Participation in Open Source
Tenure in Open Source. Respondents’ involvement duration in open source ranged from less than one year to more than a decade, indicating a mix of newcomers and veterans within open-source communities.
Reasons for Using Open-Source Software. Respondents pointed to four main reasons for choosing open-source software: that it is free of charge, that it can be modified and built upon, that it comes with a healthy community, and that it is well maintained.
Ways of Finding Open-Source Products. Most respondents discover open-source products through code hosting platforms, search engines, technical communities, and technical documentation.
Contribution to Open Source
Contribution Platforms. GitHub was the platform respondents most often used to contribute to open-source projects, followed by domestic platforms such as Gitee.
Forms of Contribution. Respondents took part in open-source projects primarily through code contributions, documentation work, and open-source advocacy.
Motivating Factors. Prestige, social connection, and career development emerged as important factors shaping respondents’ decisions to contribute.
Community Operations Survey
Roles in the Community. Respondents occupied a range of roles within open-source communities, including users, participants, contributors, and maintainers.
Channels of Communication. Within open-source communities, respondents communicated primarily through international messaging tools, domestic messaging tools, and asynchronous channels.
Community Activity Level. The number of active users and developers varied considerably across respondents’ communities, ranging from fewer than 50 to more than 500.
Open Source in China
Enterprise Adoption. Most enterprises use community editions of open-source software, and have established corresponding usage requirements and management policies.
Open Source in Higher Education. Many universities now offer open-source-related courses and support the infrastructure and resources needed for such projects.
Open Source Programs. Respondents took an active part in a range of open-source programs, including Google Summer of Code (GSoC) and the Open Source Promotion Plan (OSPP).
Commercialization of Open-Source Projects. Most respondents viewed the commercial use of open-source projects favorably, pointing to a growing convergence of open source and commercial activity.
Key Open Source Terms in 2025
Based on the 2025 open-source keyword cloud, we can summarize the themes respondents are most concerned about in the new year:
Technological innovation. High-frequency terms such as AI, model, intelligence, large model, innovation, and agent indicate that respondents are closely attuned to developments in artificial intelligence and large-models. Technological innovation remains central to discussion within open-source communities and across the industry.
Open-source ecosystem. Terms such as open source, sharing, openness, ecosystem, project, and exploration highlights the role open-source communities play in advancing technology and disseminating knowledge, and reflect respondents’ hope that collaboration and community contribution will lead to technical breakthroughs.
Security and application. The appearance of keywords such as security, application, and MCP indicates that respondents look beyond the technology itself to questions of implementation and security, hoping that open-source technology can be deployed safely and efficiently in practice.
3. Survey Analysis
3.1 Respondent Profile
By examining respondents’ age, gender, education, city of residence, industry, and occupation, we can sketch the basic demographics of those taking part in open-source communities. This helps us understand how individuals of differing backgrounds engage with those communities, and provides a basis for developing targeted community-building strategies.
3.1.1 Age, Gender, Education, and Location
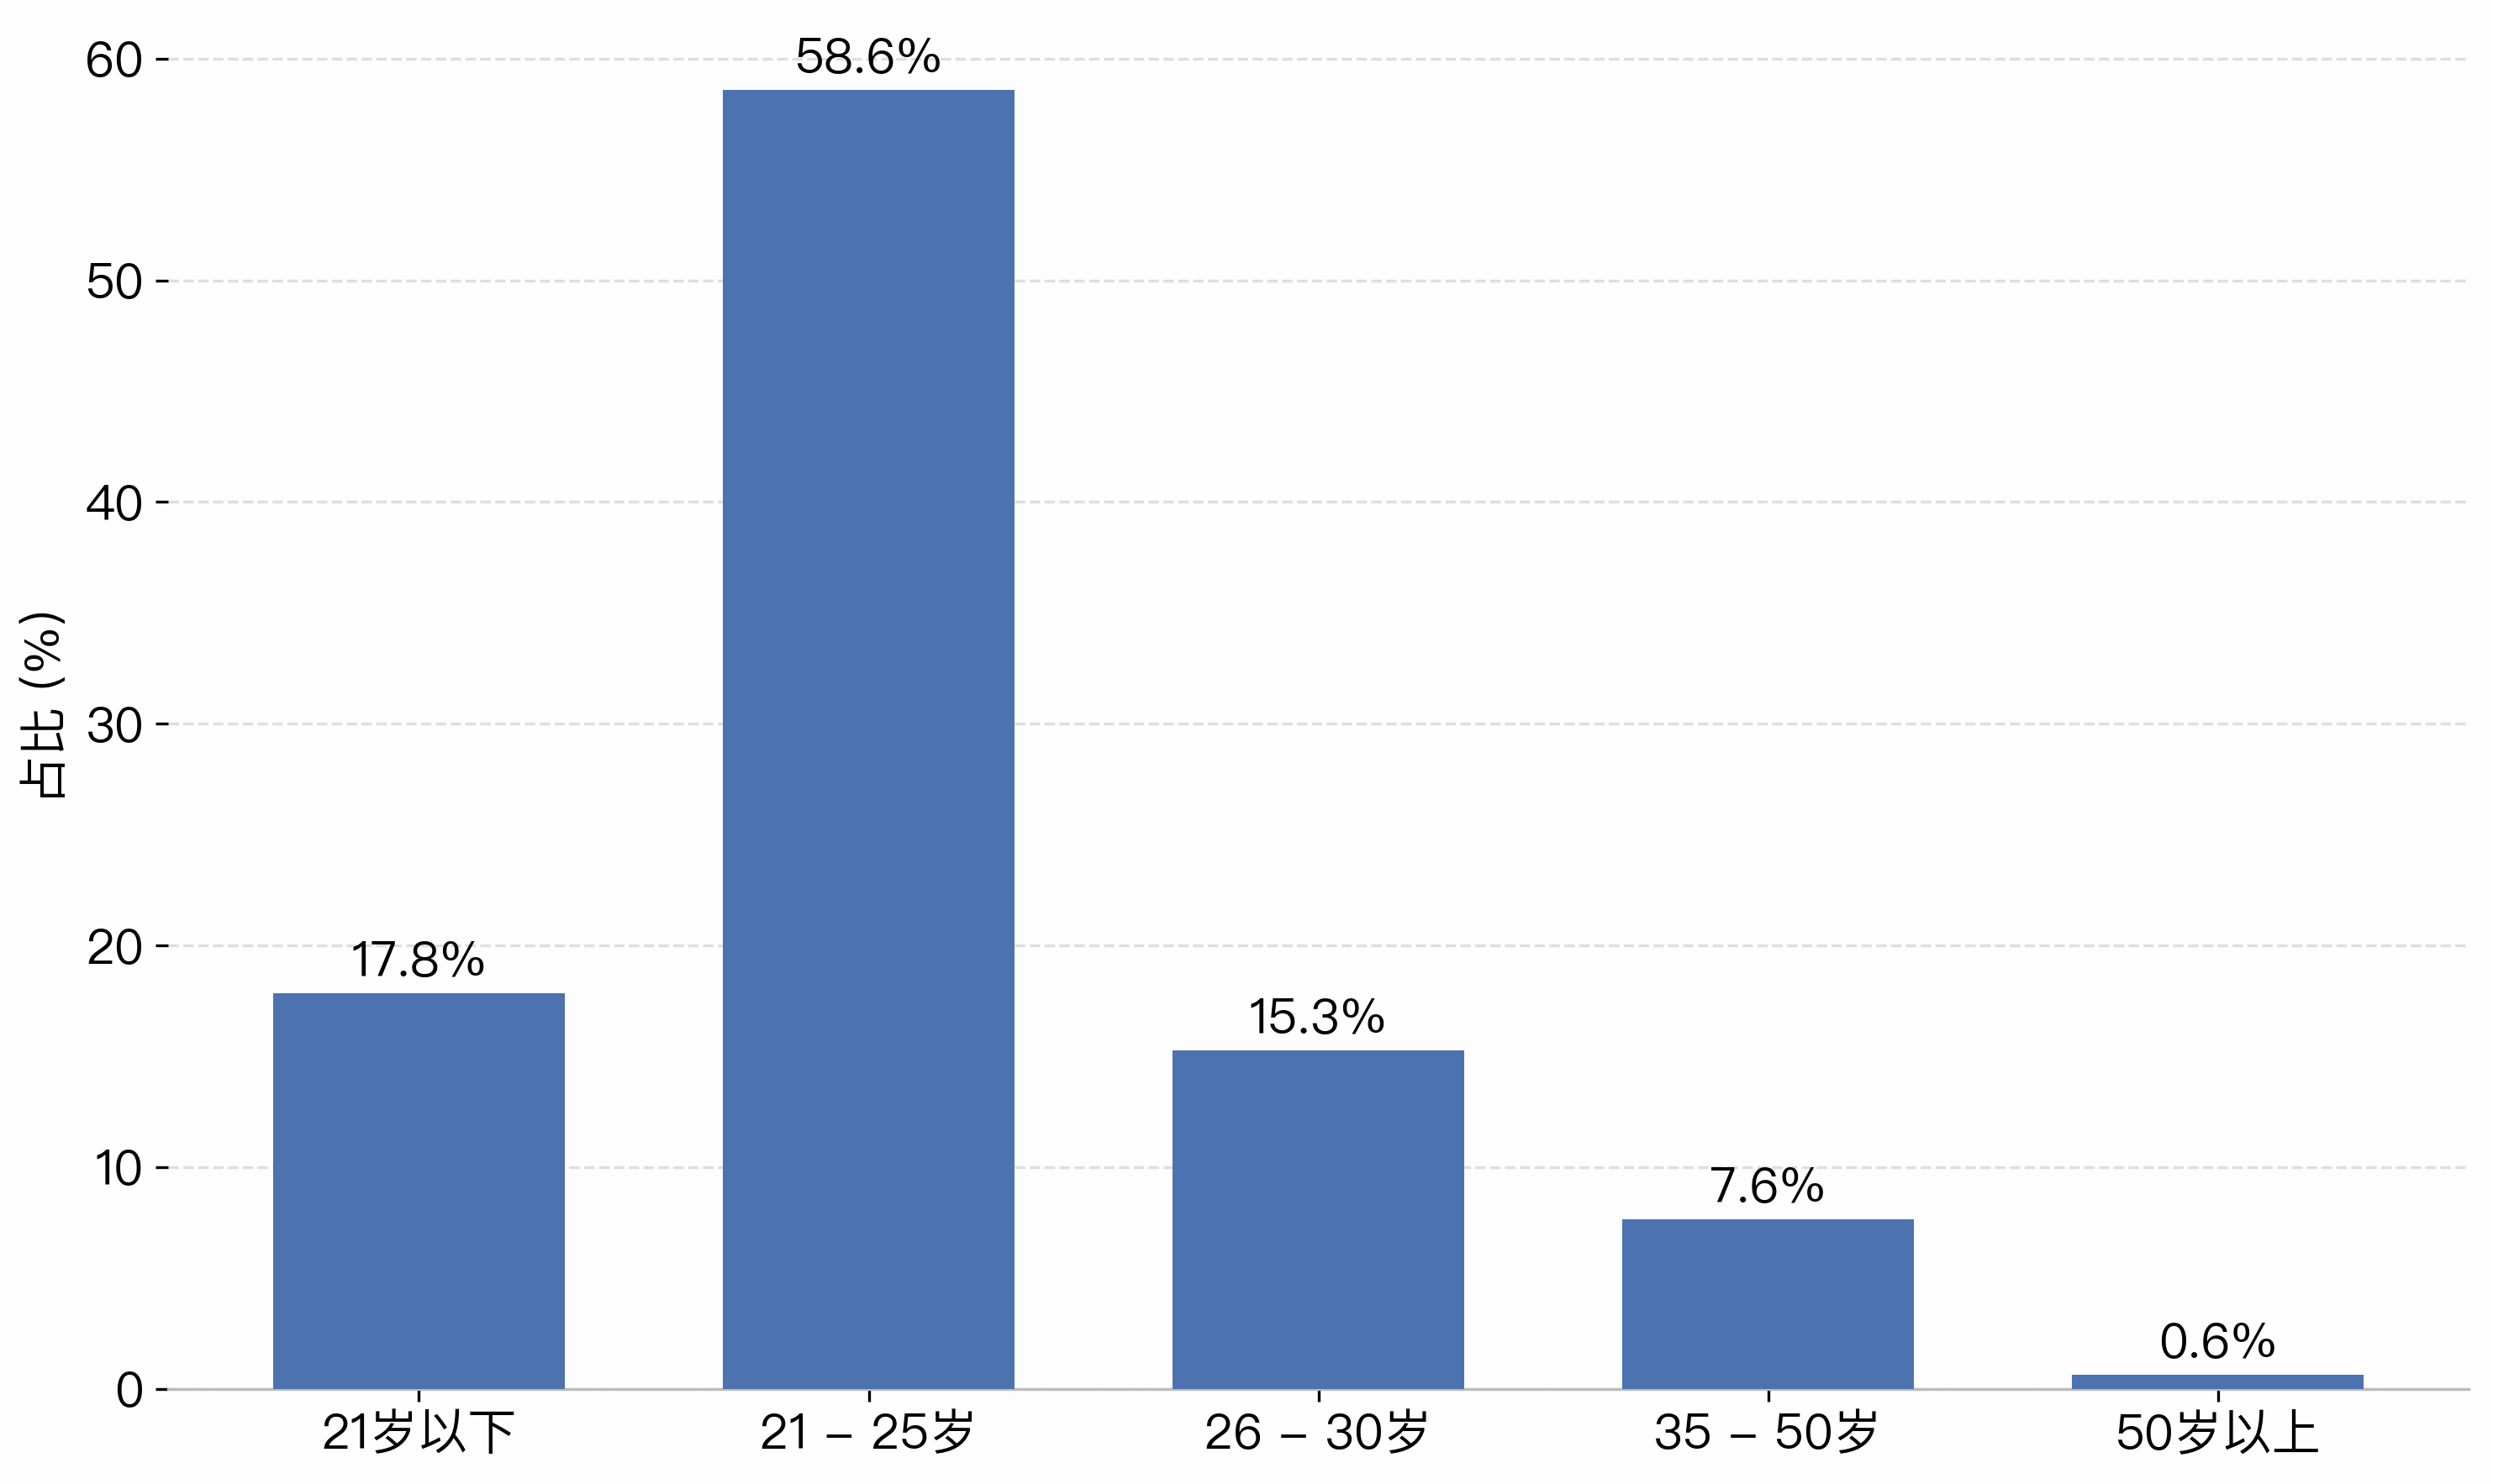
Figure 1-1 Age
The survey data show that respondents were concentrated in the 21-30 age group, with those aged 21-25 forming the largest share, followed by those aged 26-30. This indicates that open-source communities draw primarily on a younger population, particularly adults in the early stages of their careers, who may take a greater interest in new technologies and open-source projects and be more willing to participate and contribute.
On gender, men accounted for roughly three-quarters of respondents in this year’s survey and women for one-quarter. This suggests that the gender balance in open-source communities remains uneven, though women’s participation has risen compared with previous years.
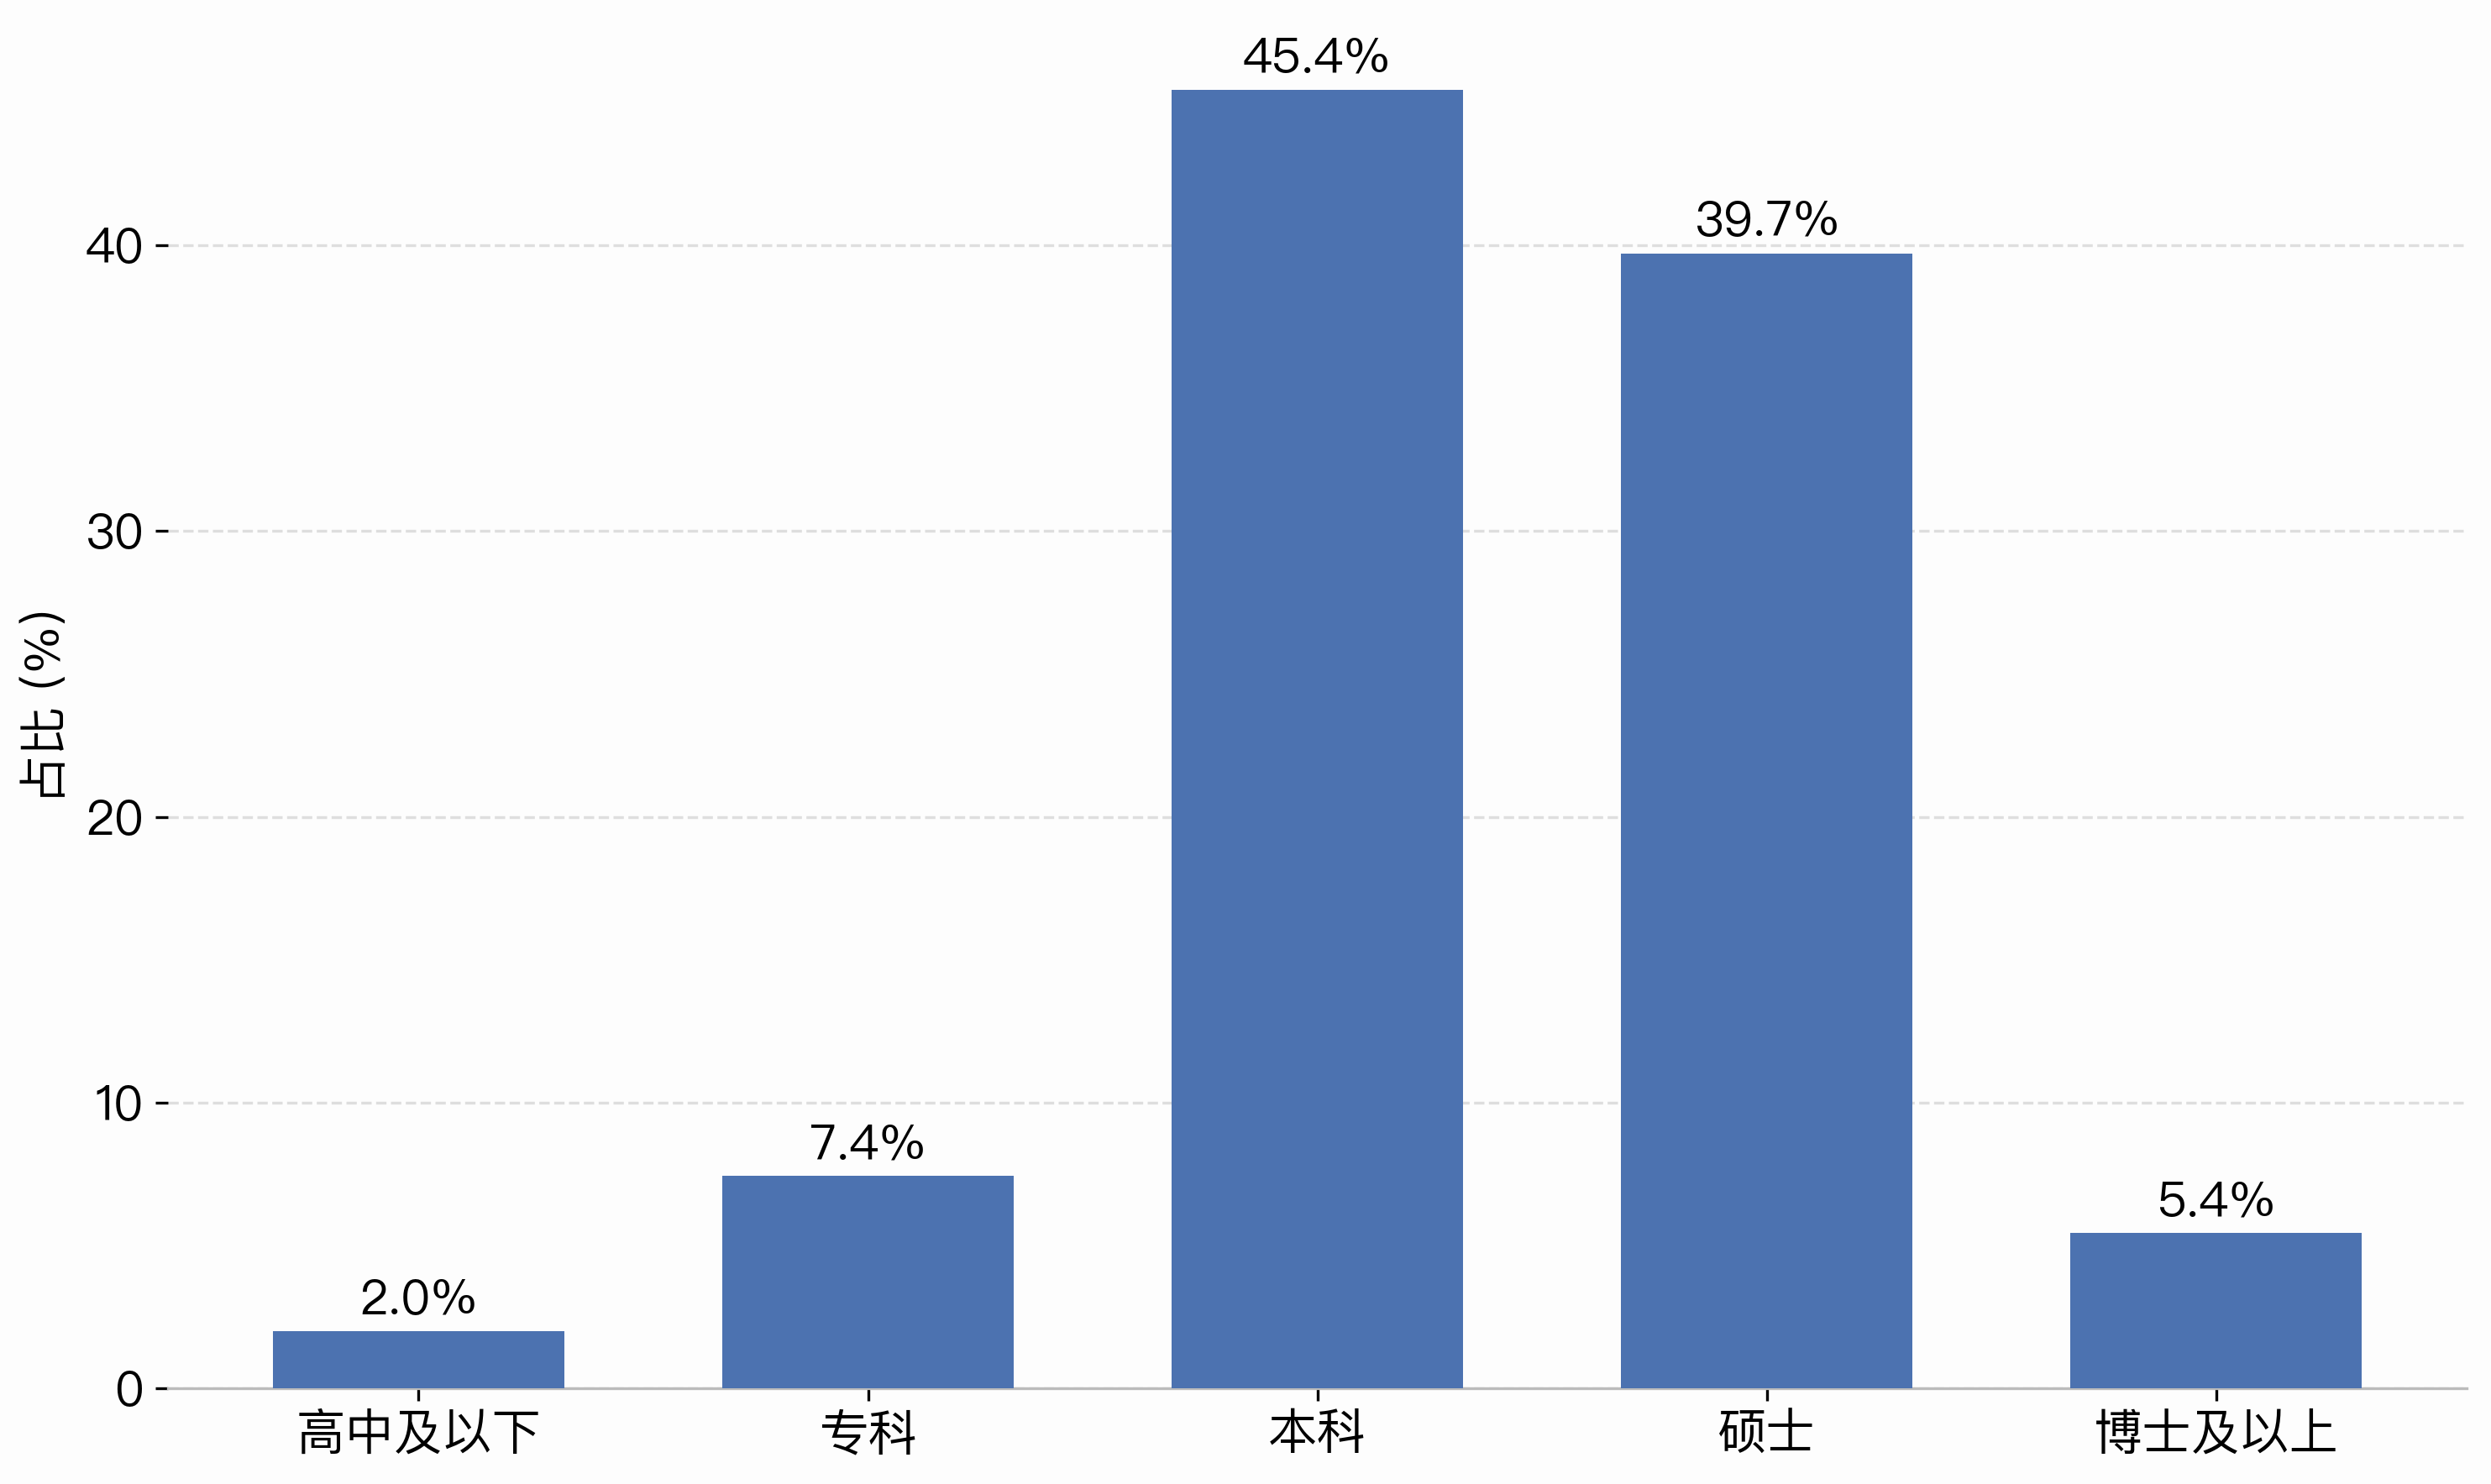
Figure 1-2 Education
Respondents were generally educated to bachelor’s level or above. Bachelor’s degrees accounted for the largest share, followed by master’s degrees; doctorates and above made up a smaller proportion, while junior-college and high-school-or-below qualifications together came to only a small minority. The sample thus skews toward higher levels of educational attainment.
By region, respondents in eastern China accounted for close to 60%, those in the north for around 30%, and those in the central and western regions for just over 10% combined. Beijing, Shanghai, and Guangdong Province, along with other first- and new-first-tier cities accounted for a substantial share of the sample, a pattern closely tied to the distribution of offline events and of the channels through which the survey was circulated.
3.1.2 Industry and Occupation
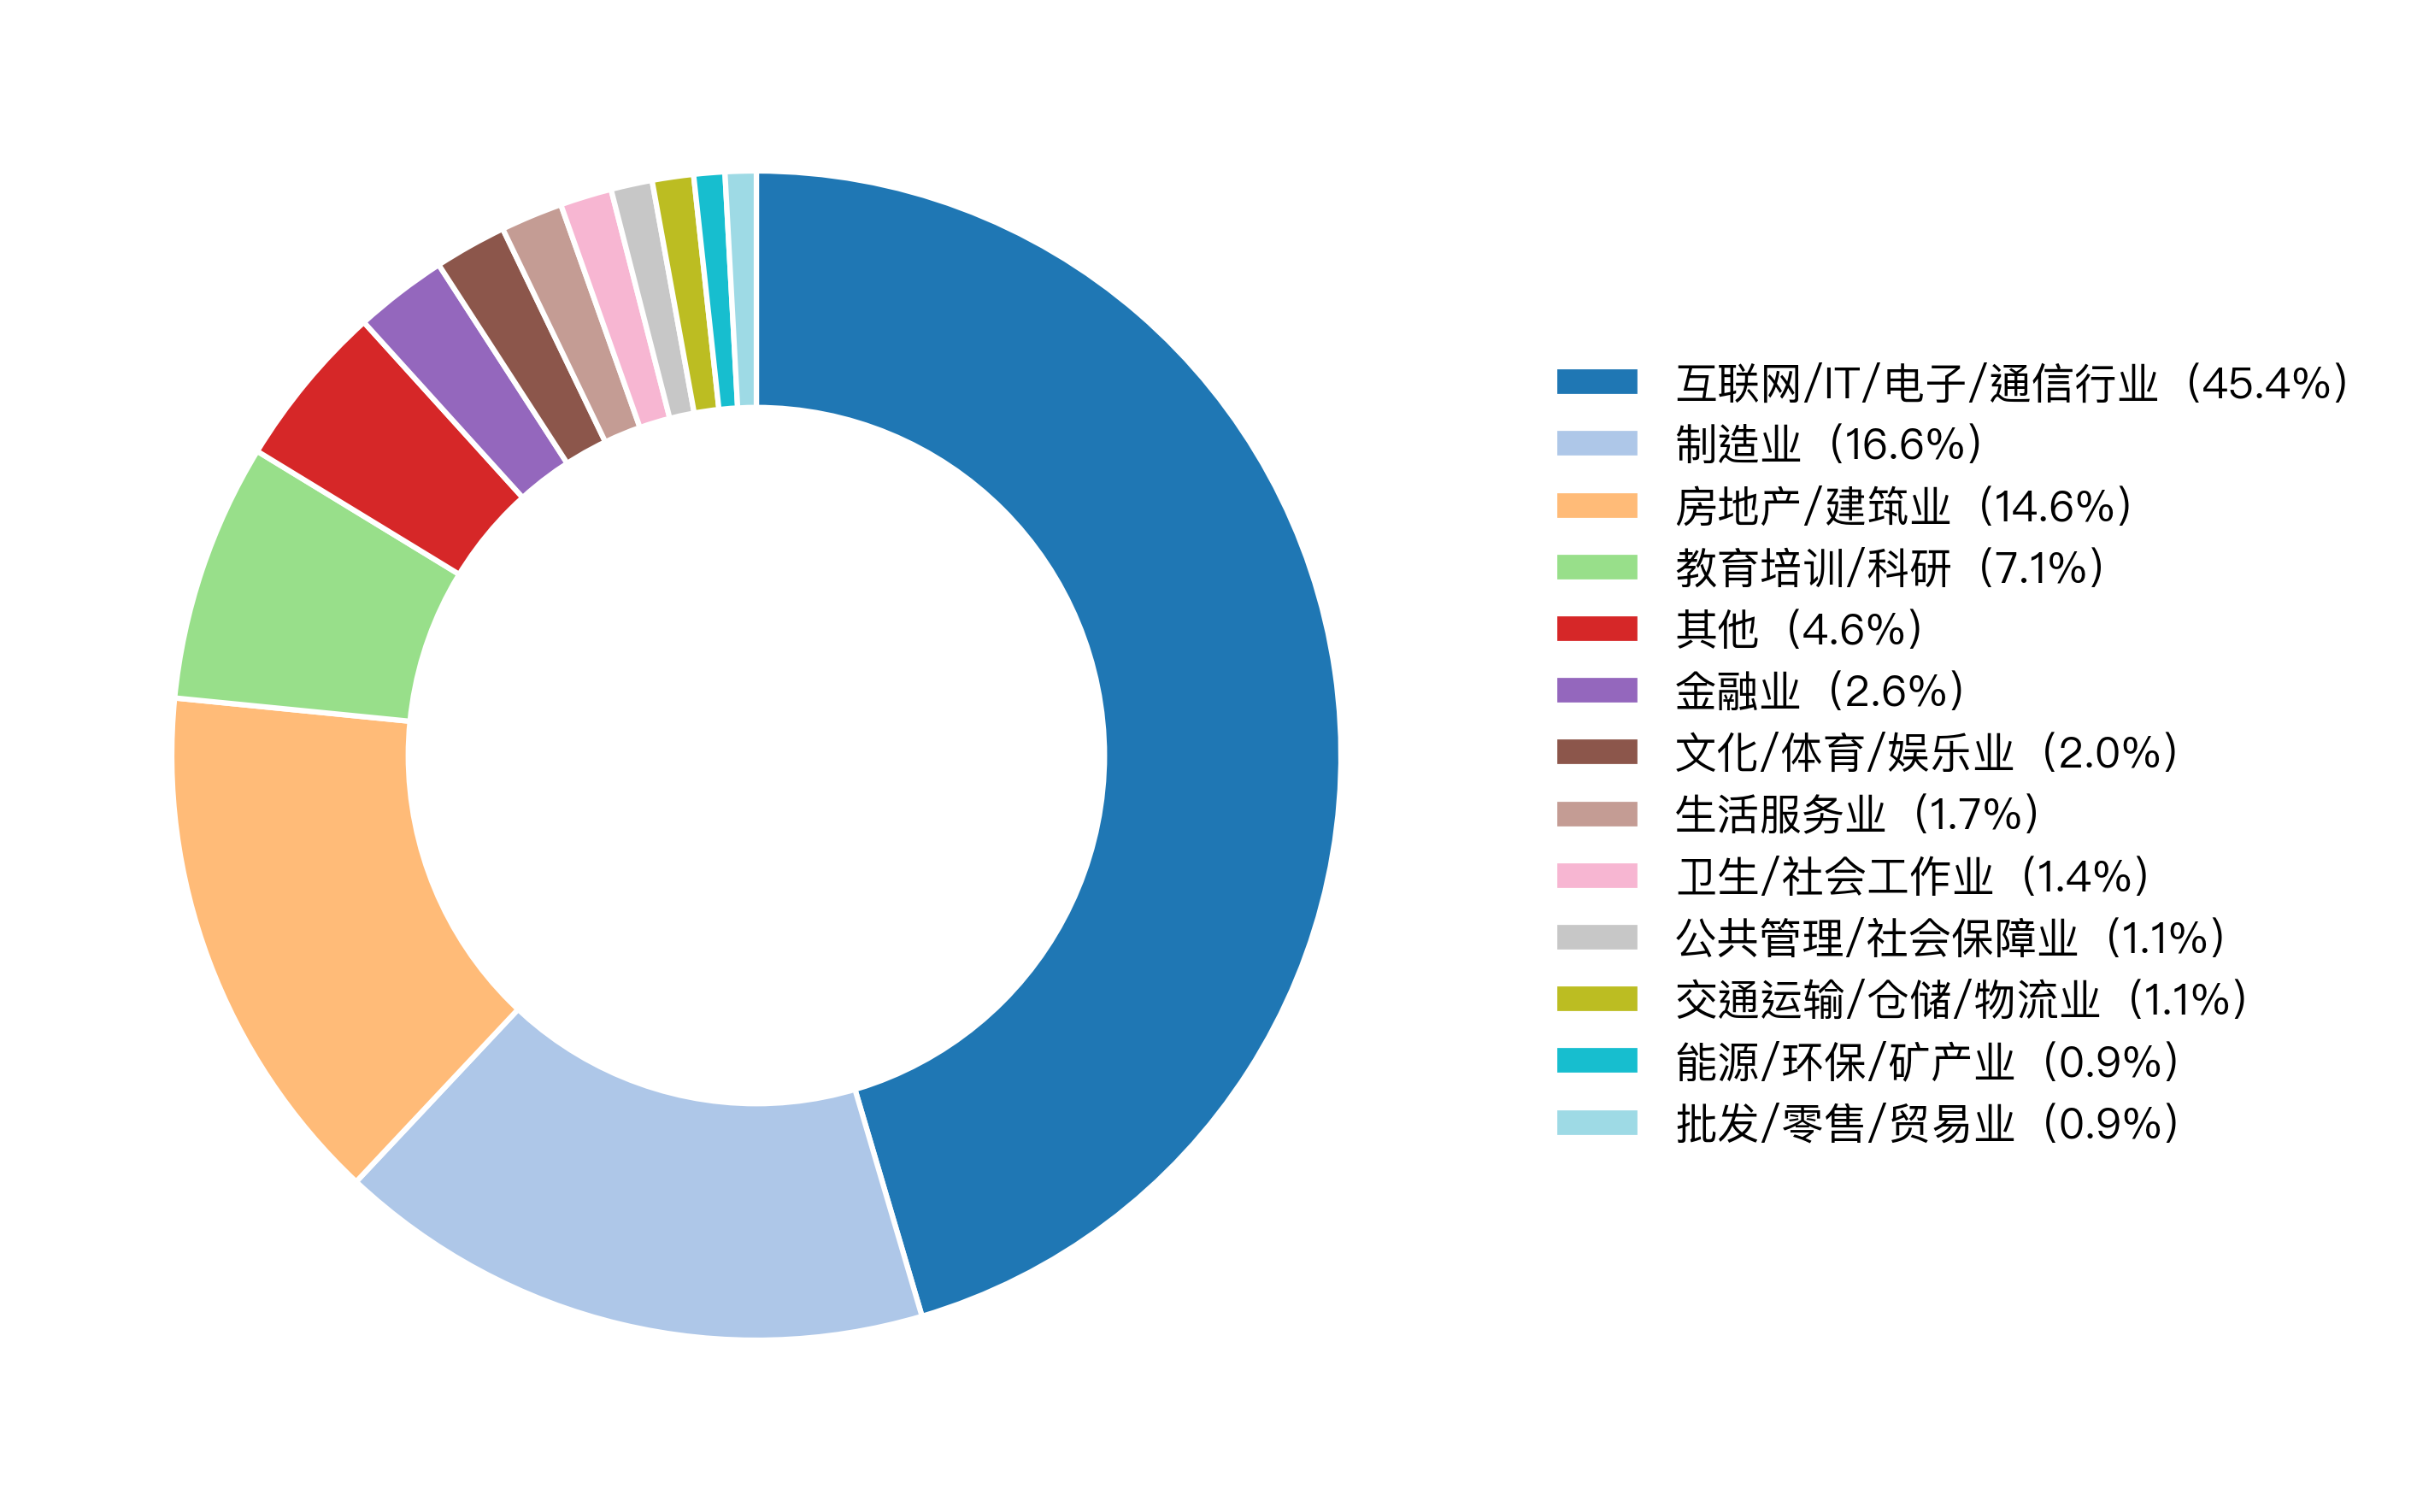
Figure 1-3 Industry
Respondents worked predominantly in the internet, IT, electronics, and telecommunications sector — 159 people, close to half the total — indicating that this year’s sample was heavily concentrated in fields related to digital technology and software. Manufacturing and real estate/construction followed, together accounting for around 30%, while education, training, and scientific research came in slightly below 10%. Finance, culture/sports/entertainment, public administration and social security, transportation and logistics, and energy and environmental protection made up a smaller but varied long tail, indicating that open-source practice has gradually permeated a range of industry settings.
By occupation, back-end developers, full-stack developers, and students formed the core of the sample, each accounting for a considerable share. They were followed by academic researchers; front-end, QA, desktop, and embedded developers; and managers and executives. At the same time, roles such as AI and large-model engineers, open-source community operators and maintainers, technical evangelists, developer relations professionals, and content creators have reached a certain scale — an indication that alongside developers who write code, a more varied set of occupations built around operating, communicating, and teaching open source continues to grow.
3.2 Participation in Open Source
This section summarizes the frequency, motivations, and forms of respondents’ participation in open-source projects, along with the obstacles they encounter. It sheds light on how actively they engage with open-source communities and on the factors that shape that engagement.
3.2.1 Depth of Participation in Open-Source Communities
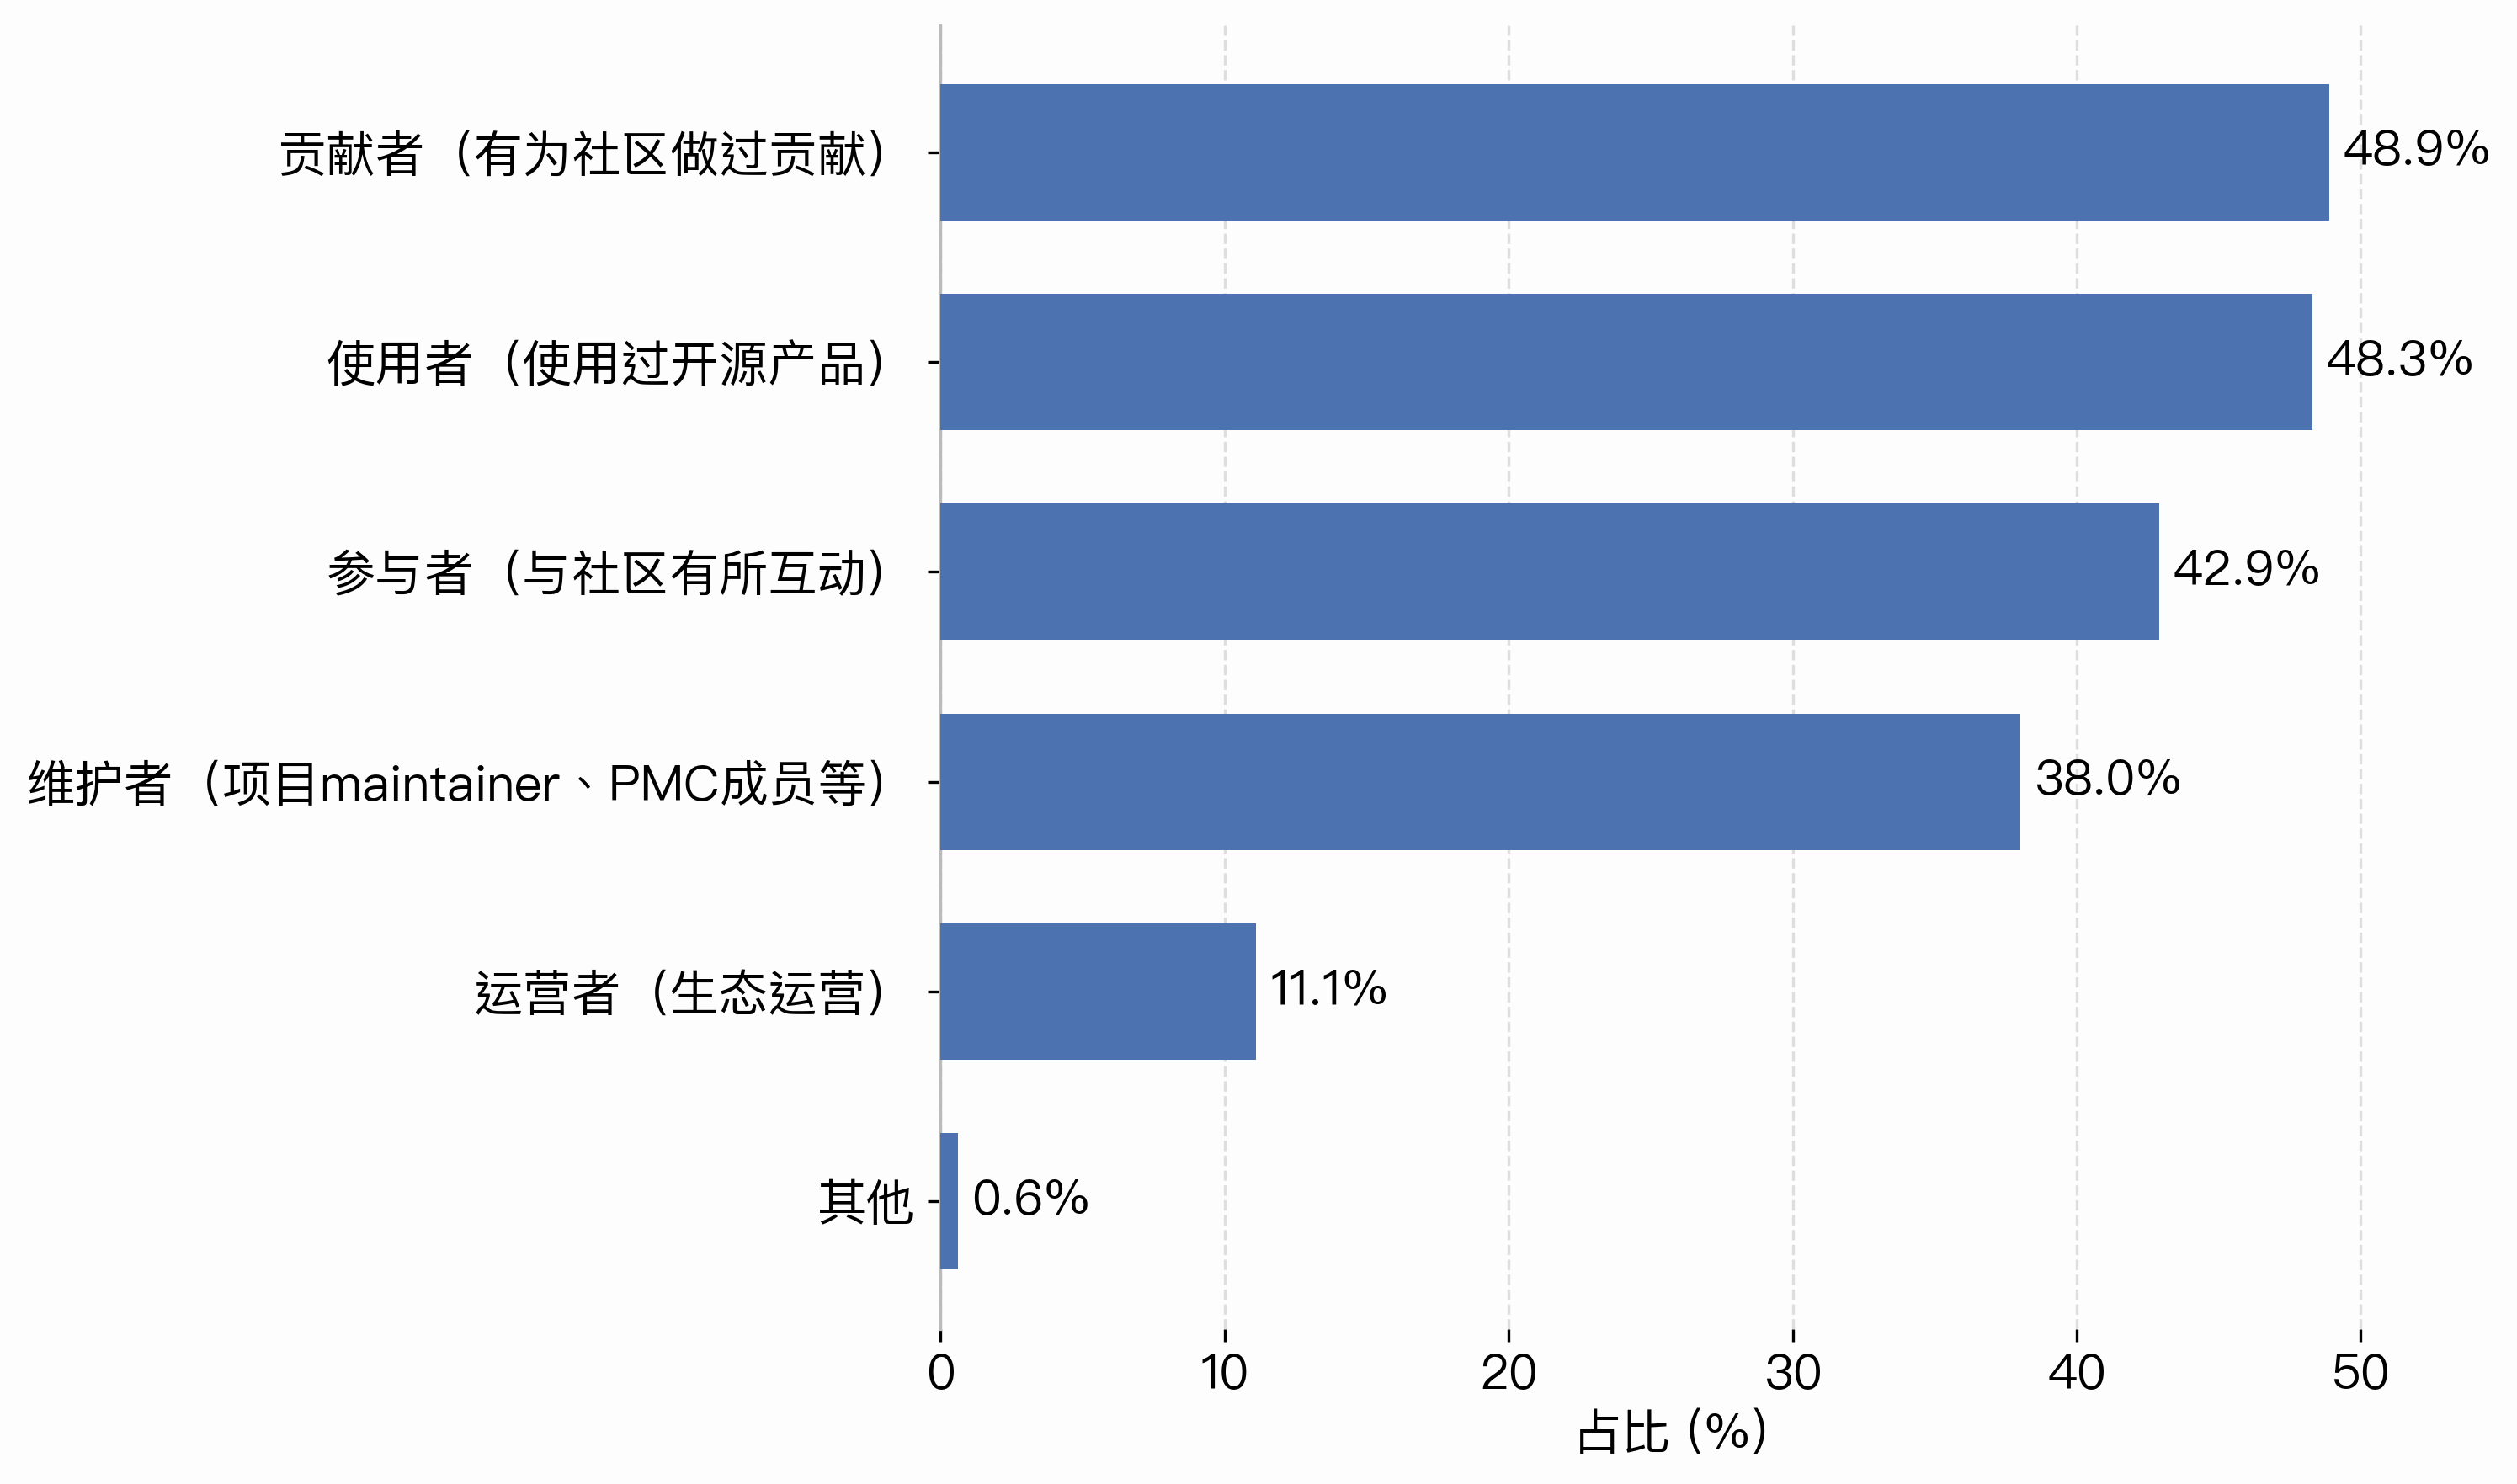
Figure 1-4 Roles in the Open-Source Community
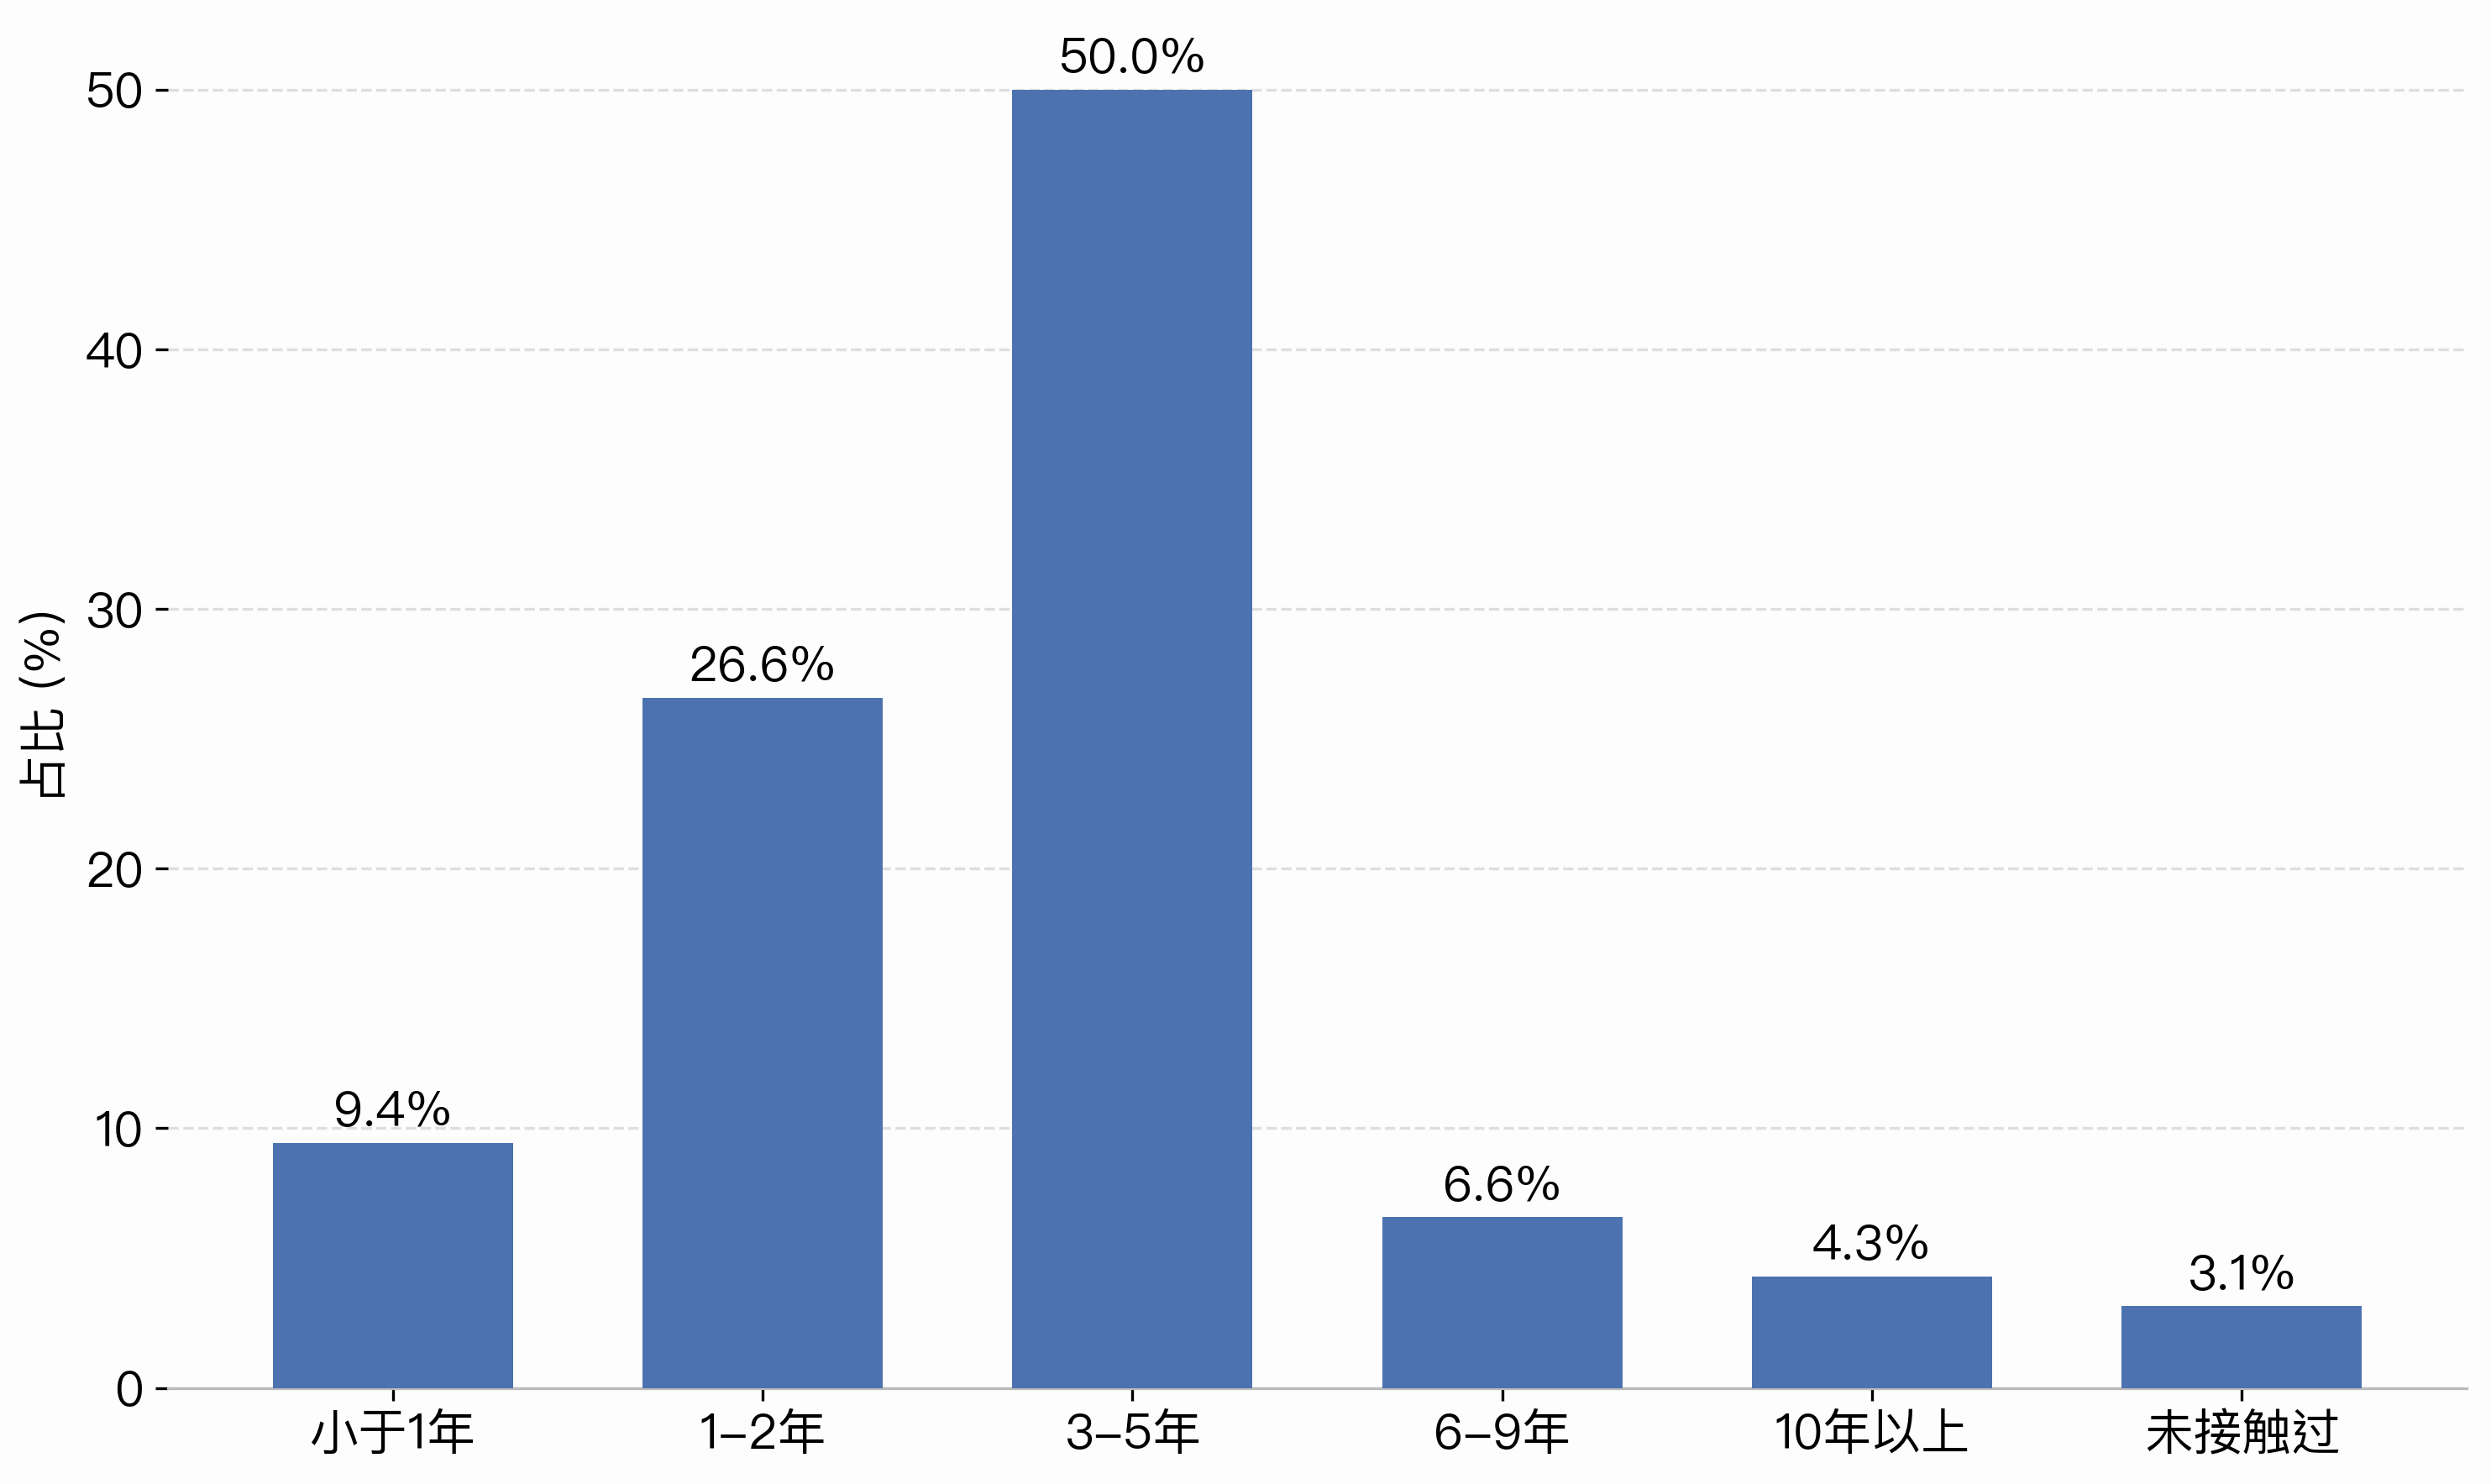
Figure 1-5 Tenure in Open Source
The survey shows that users and contributors were the two leading roles in open-source communities: respondents who had contributed to a community and those who only used open-source products each accounted for close to half, with contributors slightly ahead. This indicates that a substantial share of users has moved beyond simply using open-source software to making actual contributions. Participants, who interact with communities, and maintainers, including project maintainers and PMC members, each accounted for a considerable share as well, while ecosystem operators made up around 10%. The result is a tiered structure of roles spanning use, participation, contribution, maintenance and operations.
As for time spent in open source, newcomers with less than a year’s involvement accounted for under 10%, and roughly a quarter of respondents had been involved for one to two years. Those with three to five years of experience approached half the sample, and together with veterans of six to nine years and more than a decade, over 60% of respondents had three years or more of involvement. Only a small minority reported no real engagement with open source, suggesting that within this sample, open source has become a relatively widespread technology and mode of collaboration.
The questions that follow are addressed to respondents at the level of user or above.
3.2.2 Use of Open-Source Products
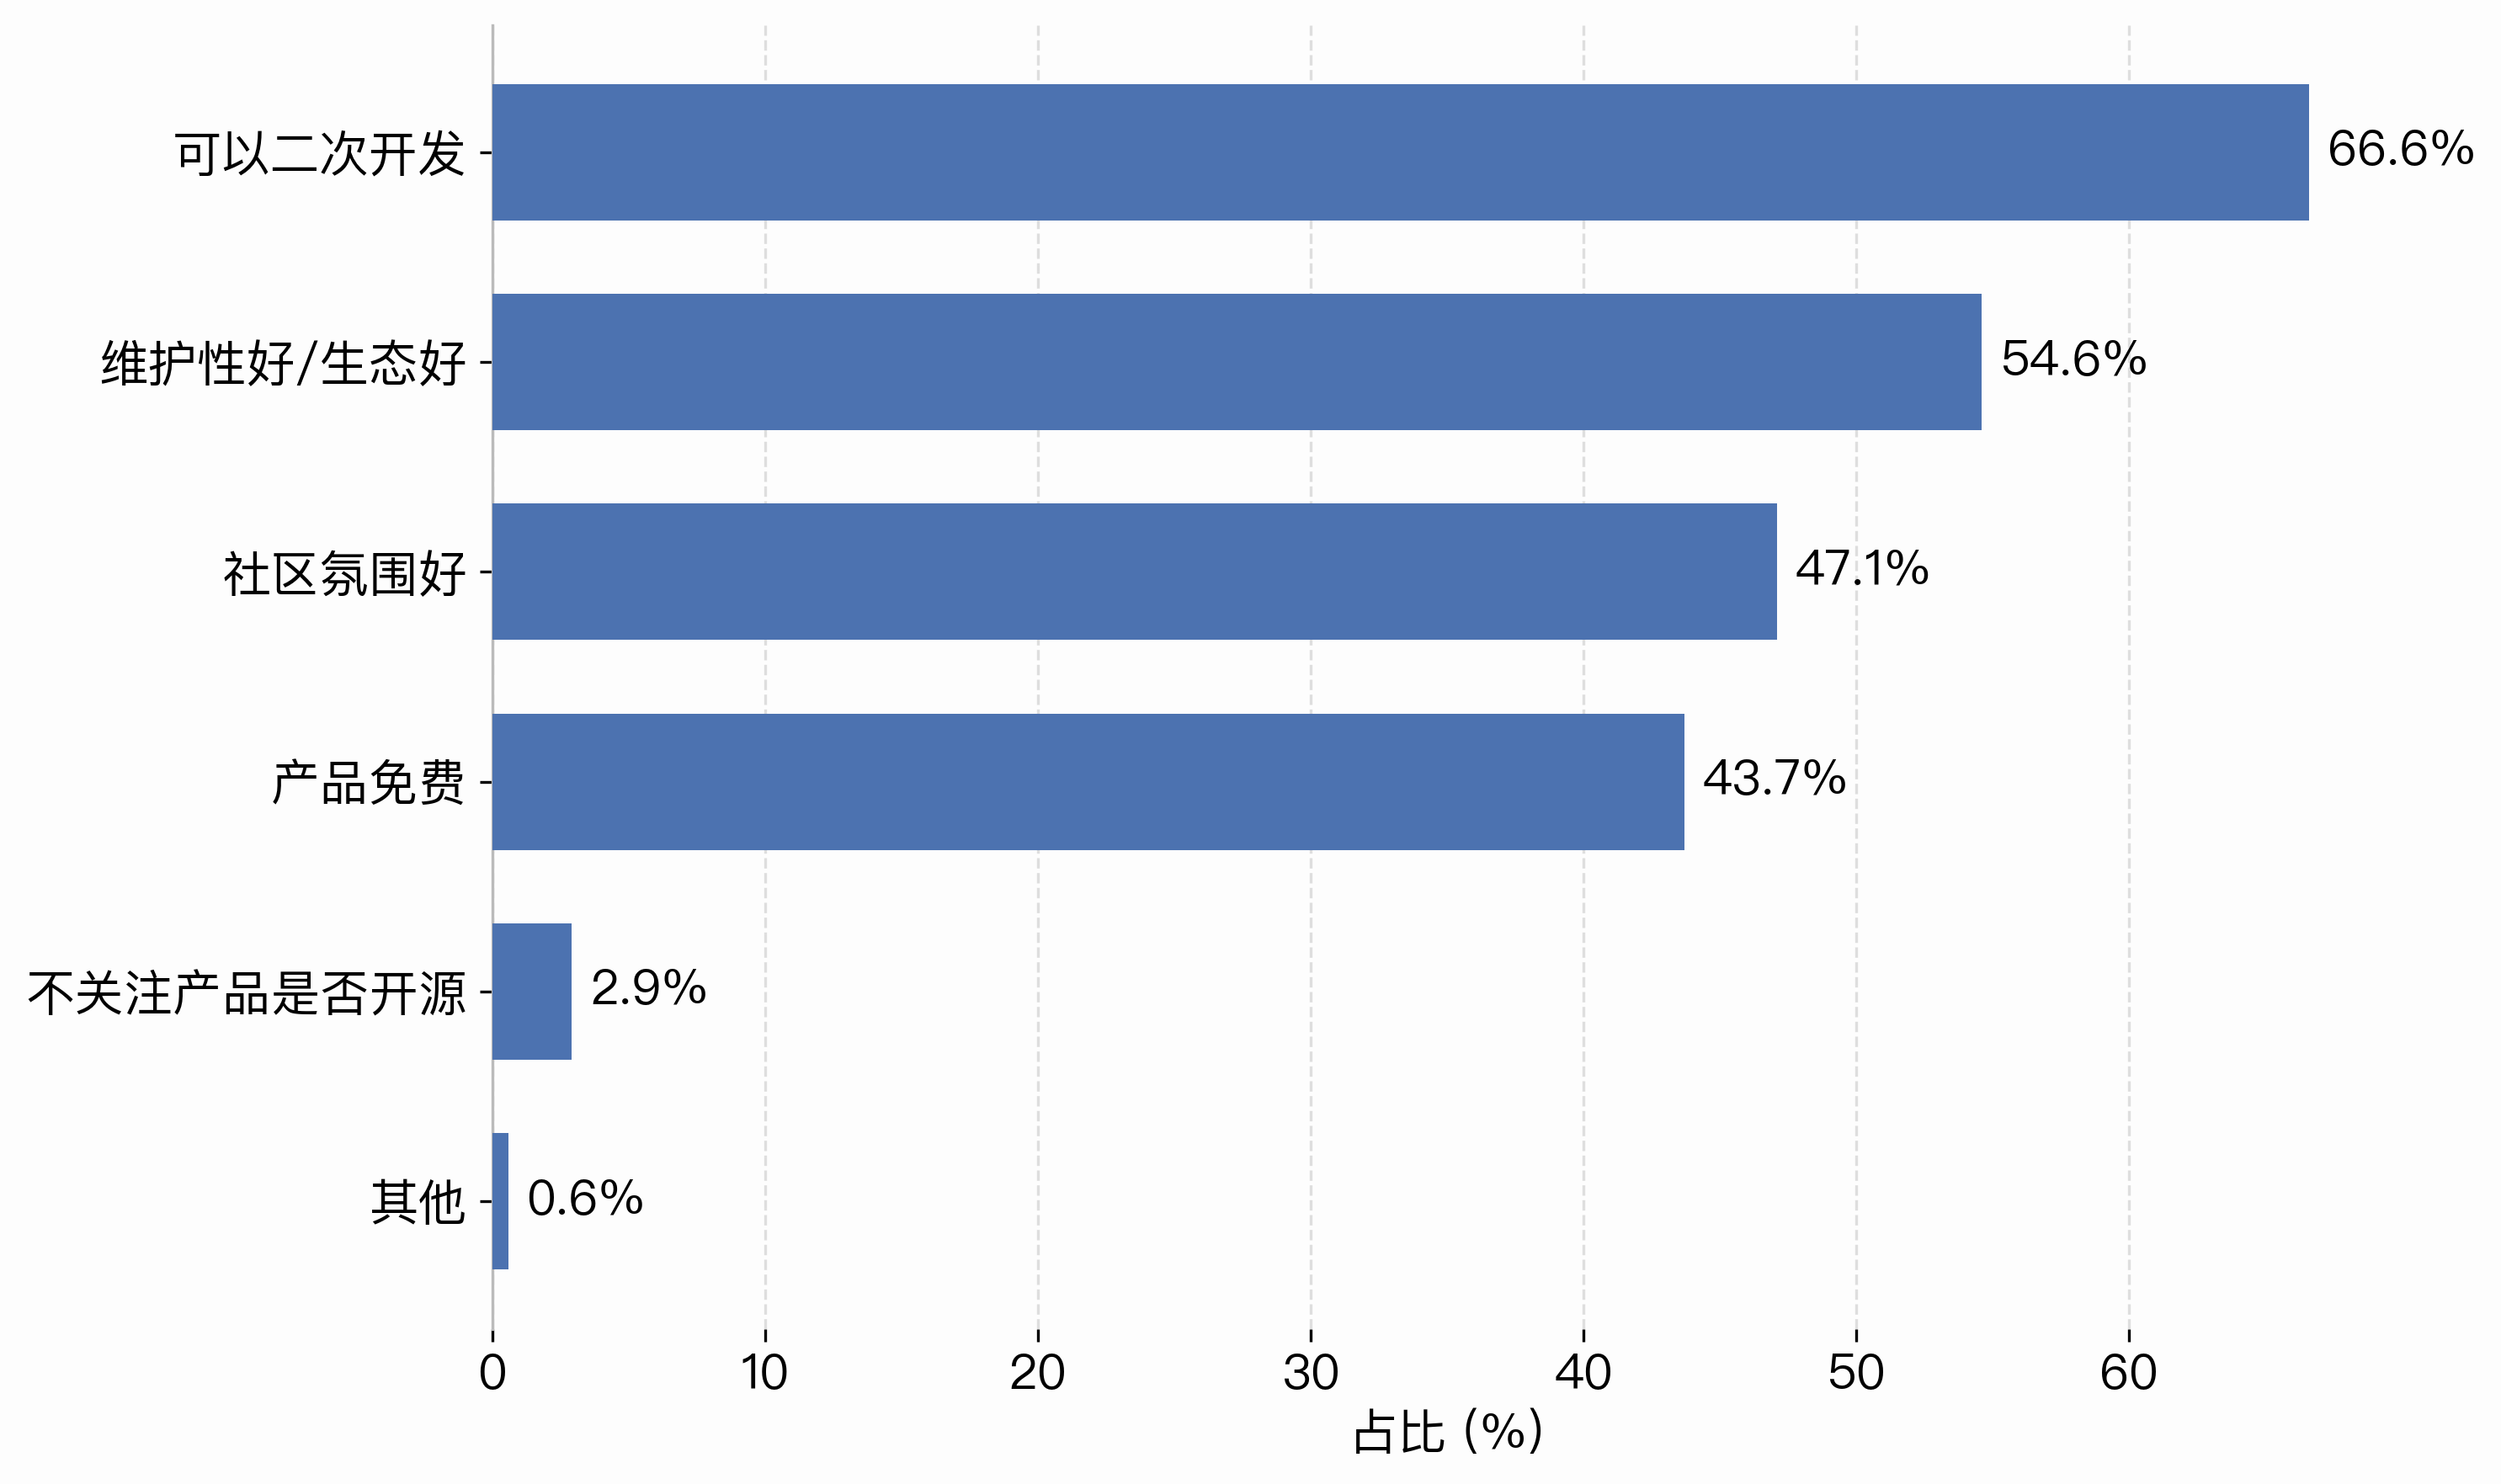
Figure 1-5 Reasons for Choosing Open-Source Products
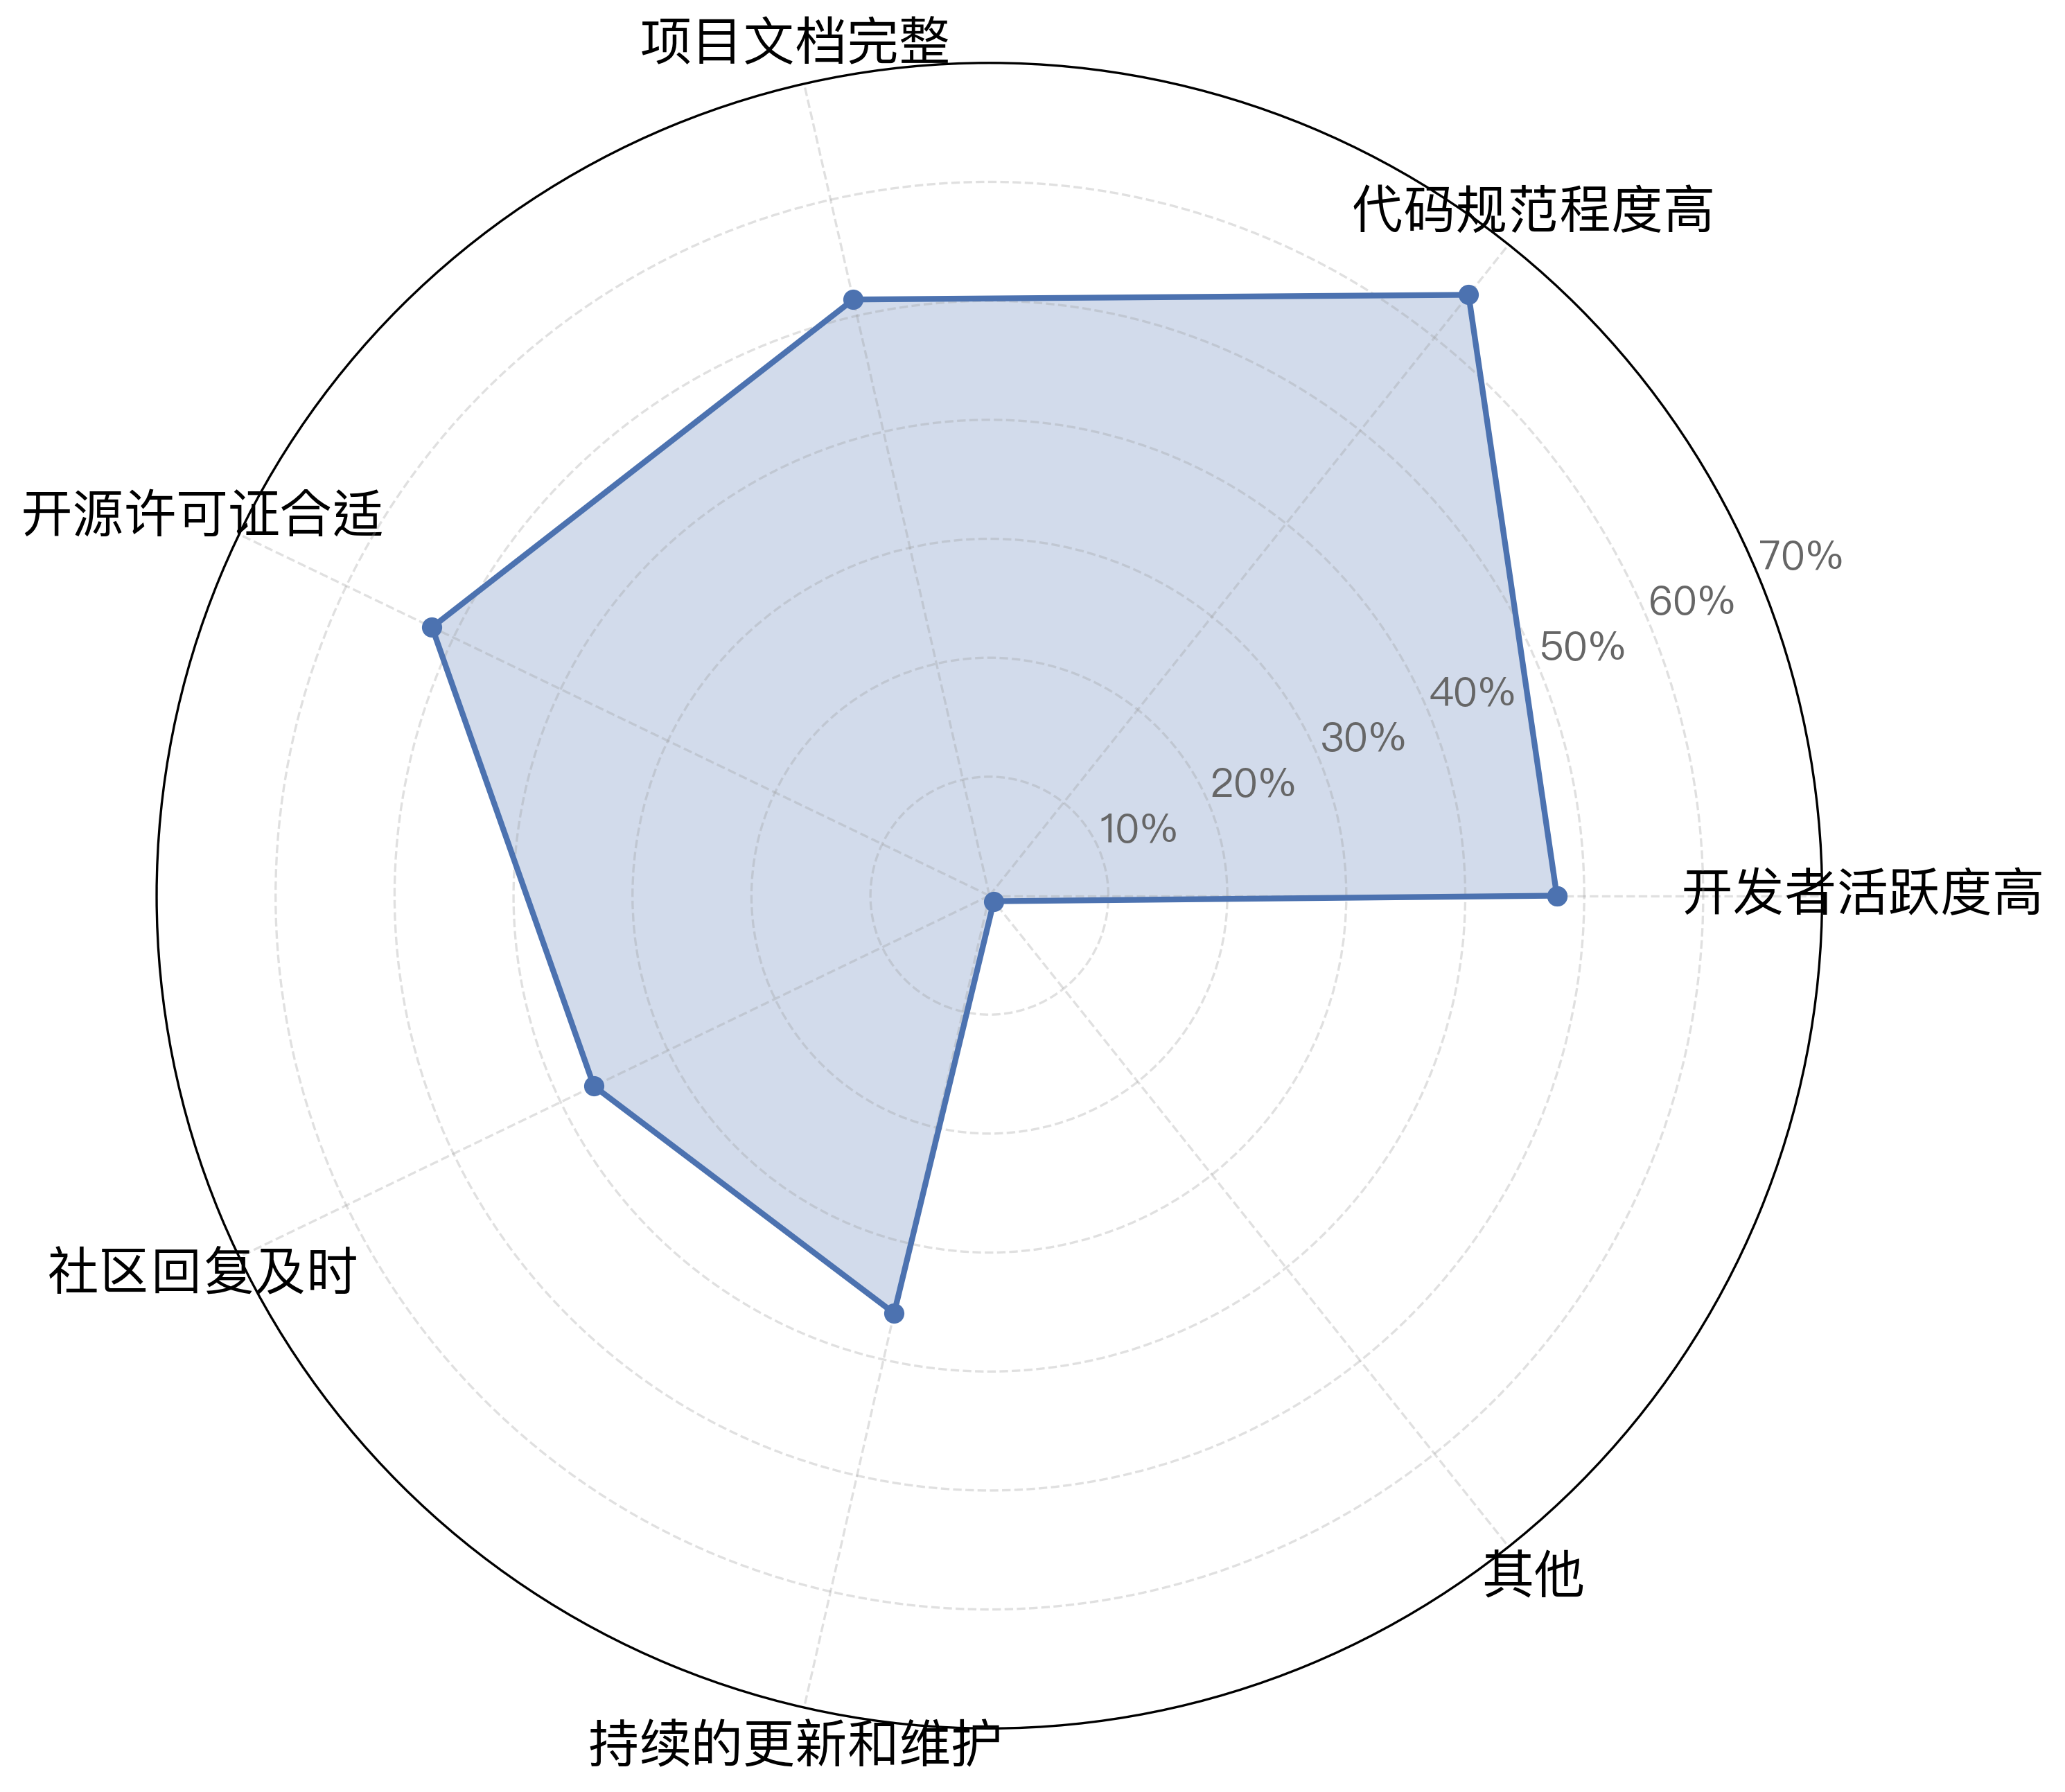
Figure 1-6 Factors Influencing Choice
The statistics show that the ability to modify and build on the code was the leading motivation, cited by around two-thirds of respondents, followed by strong maintenance and a healthy ecosystem, and then a good community atmosphere. Being free of charge still mattered, though it ranked slightly below the top three. This suggests that in today’s open-source adoption decisions, the capacity for modification and the prospect of long-term maintenance carry more weight than cost alone.
When it comes to choosing specific projects, respondents placed the greatest value on well-structured code, followed by a suitable open-source license and complete project documentation, with a high level of developer activity close behind. This suggests that compliance and maintainability — standards, documentation, and licensing — together with community activity form the principal criteria by which developers assess the quality of an open-source project.
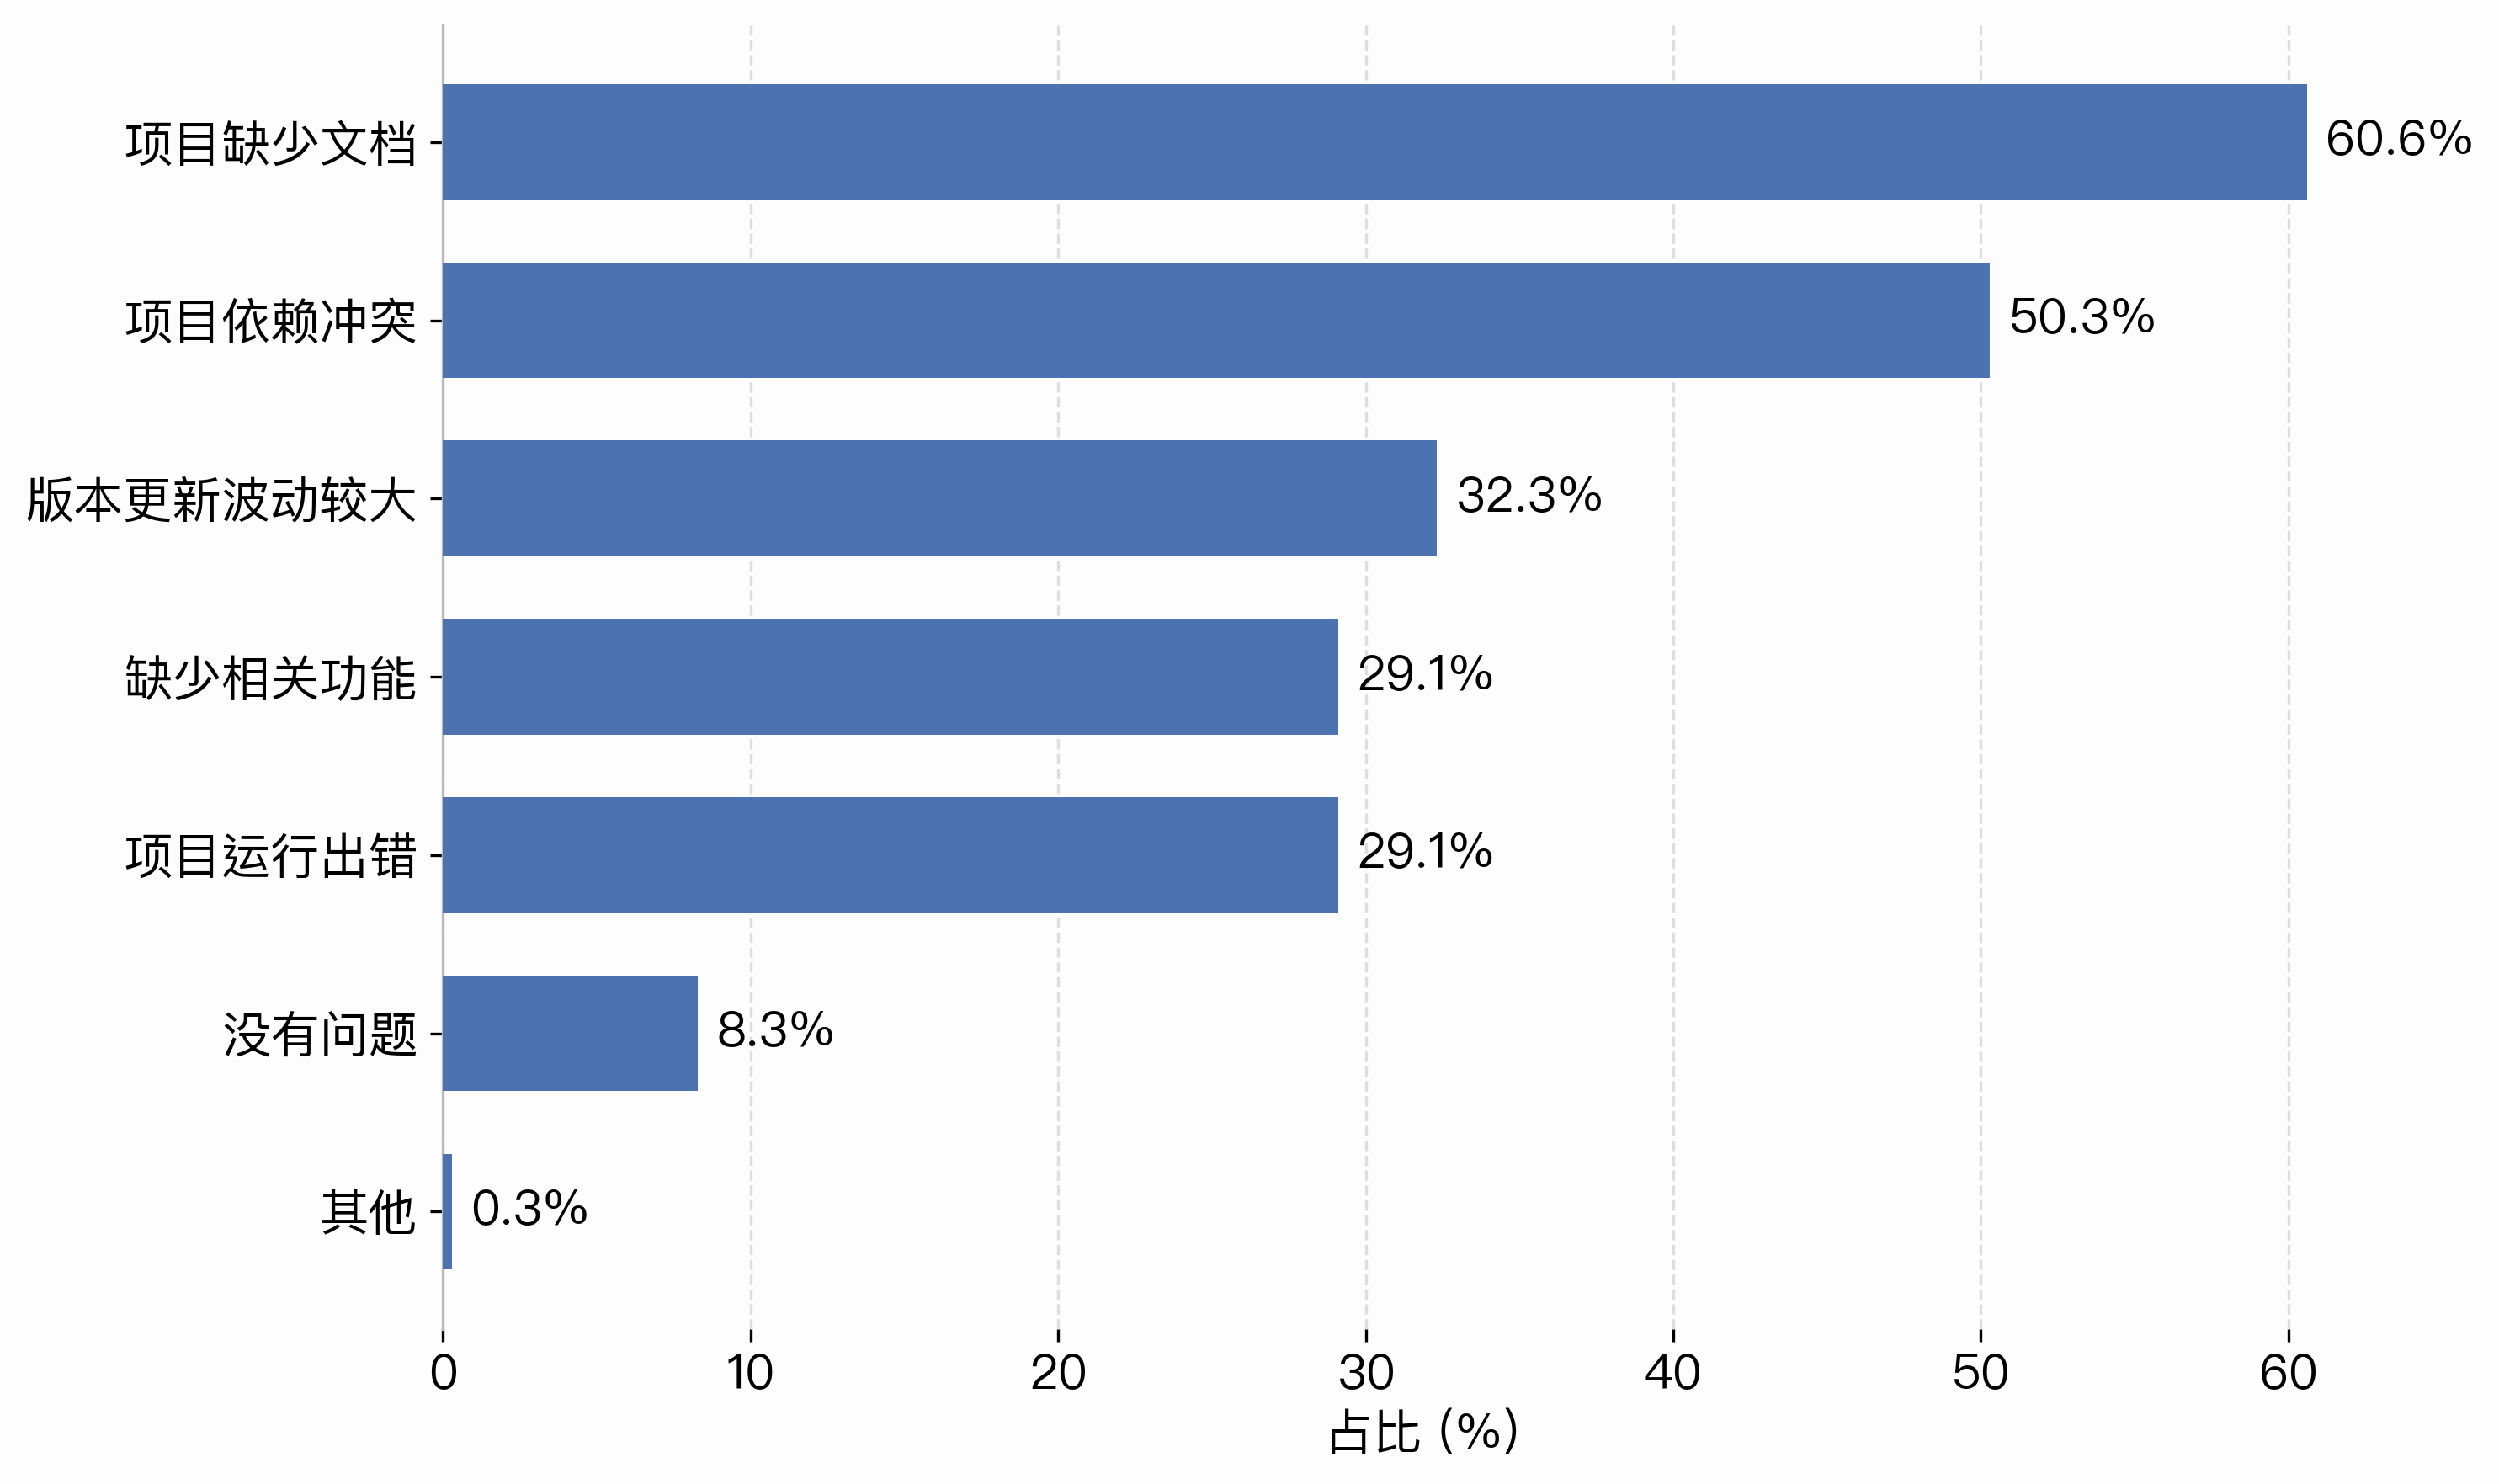
Figure 1-7 Problems Encountered When Using Open-Source Products
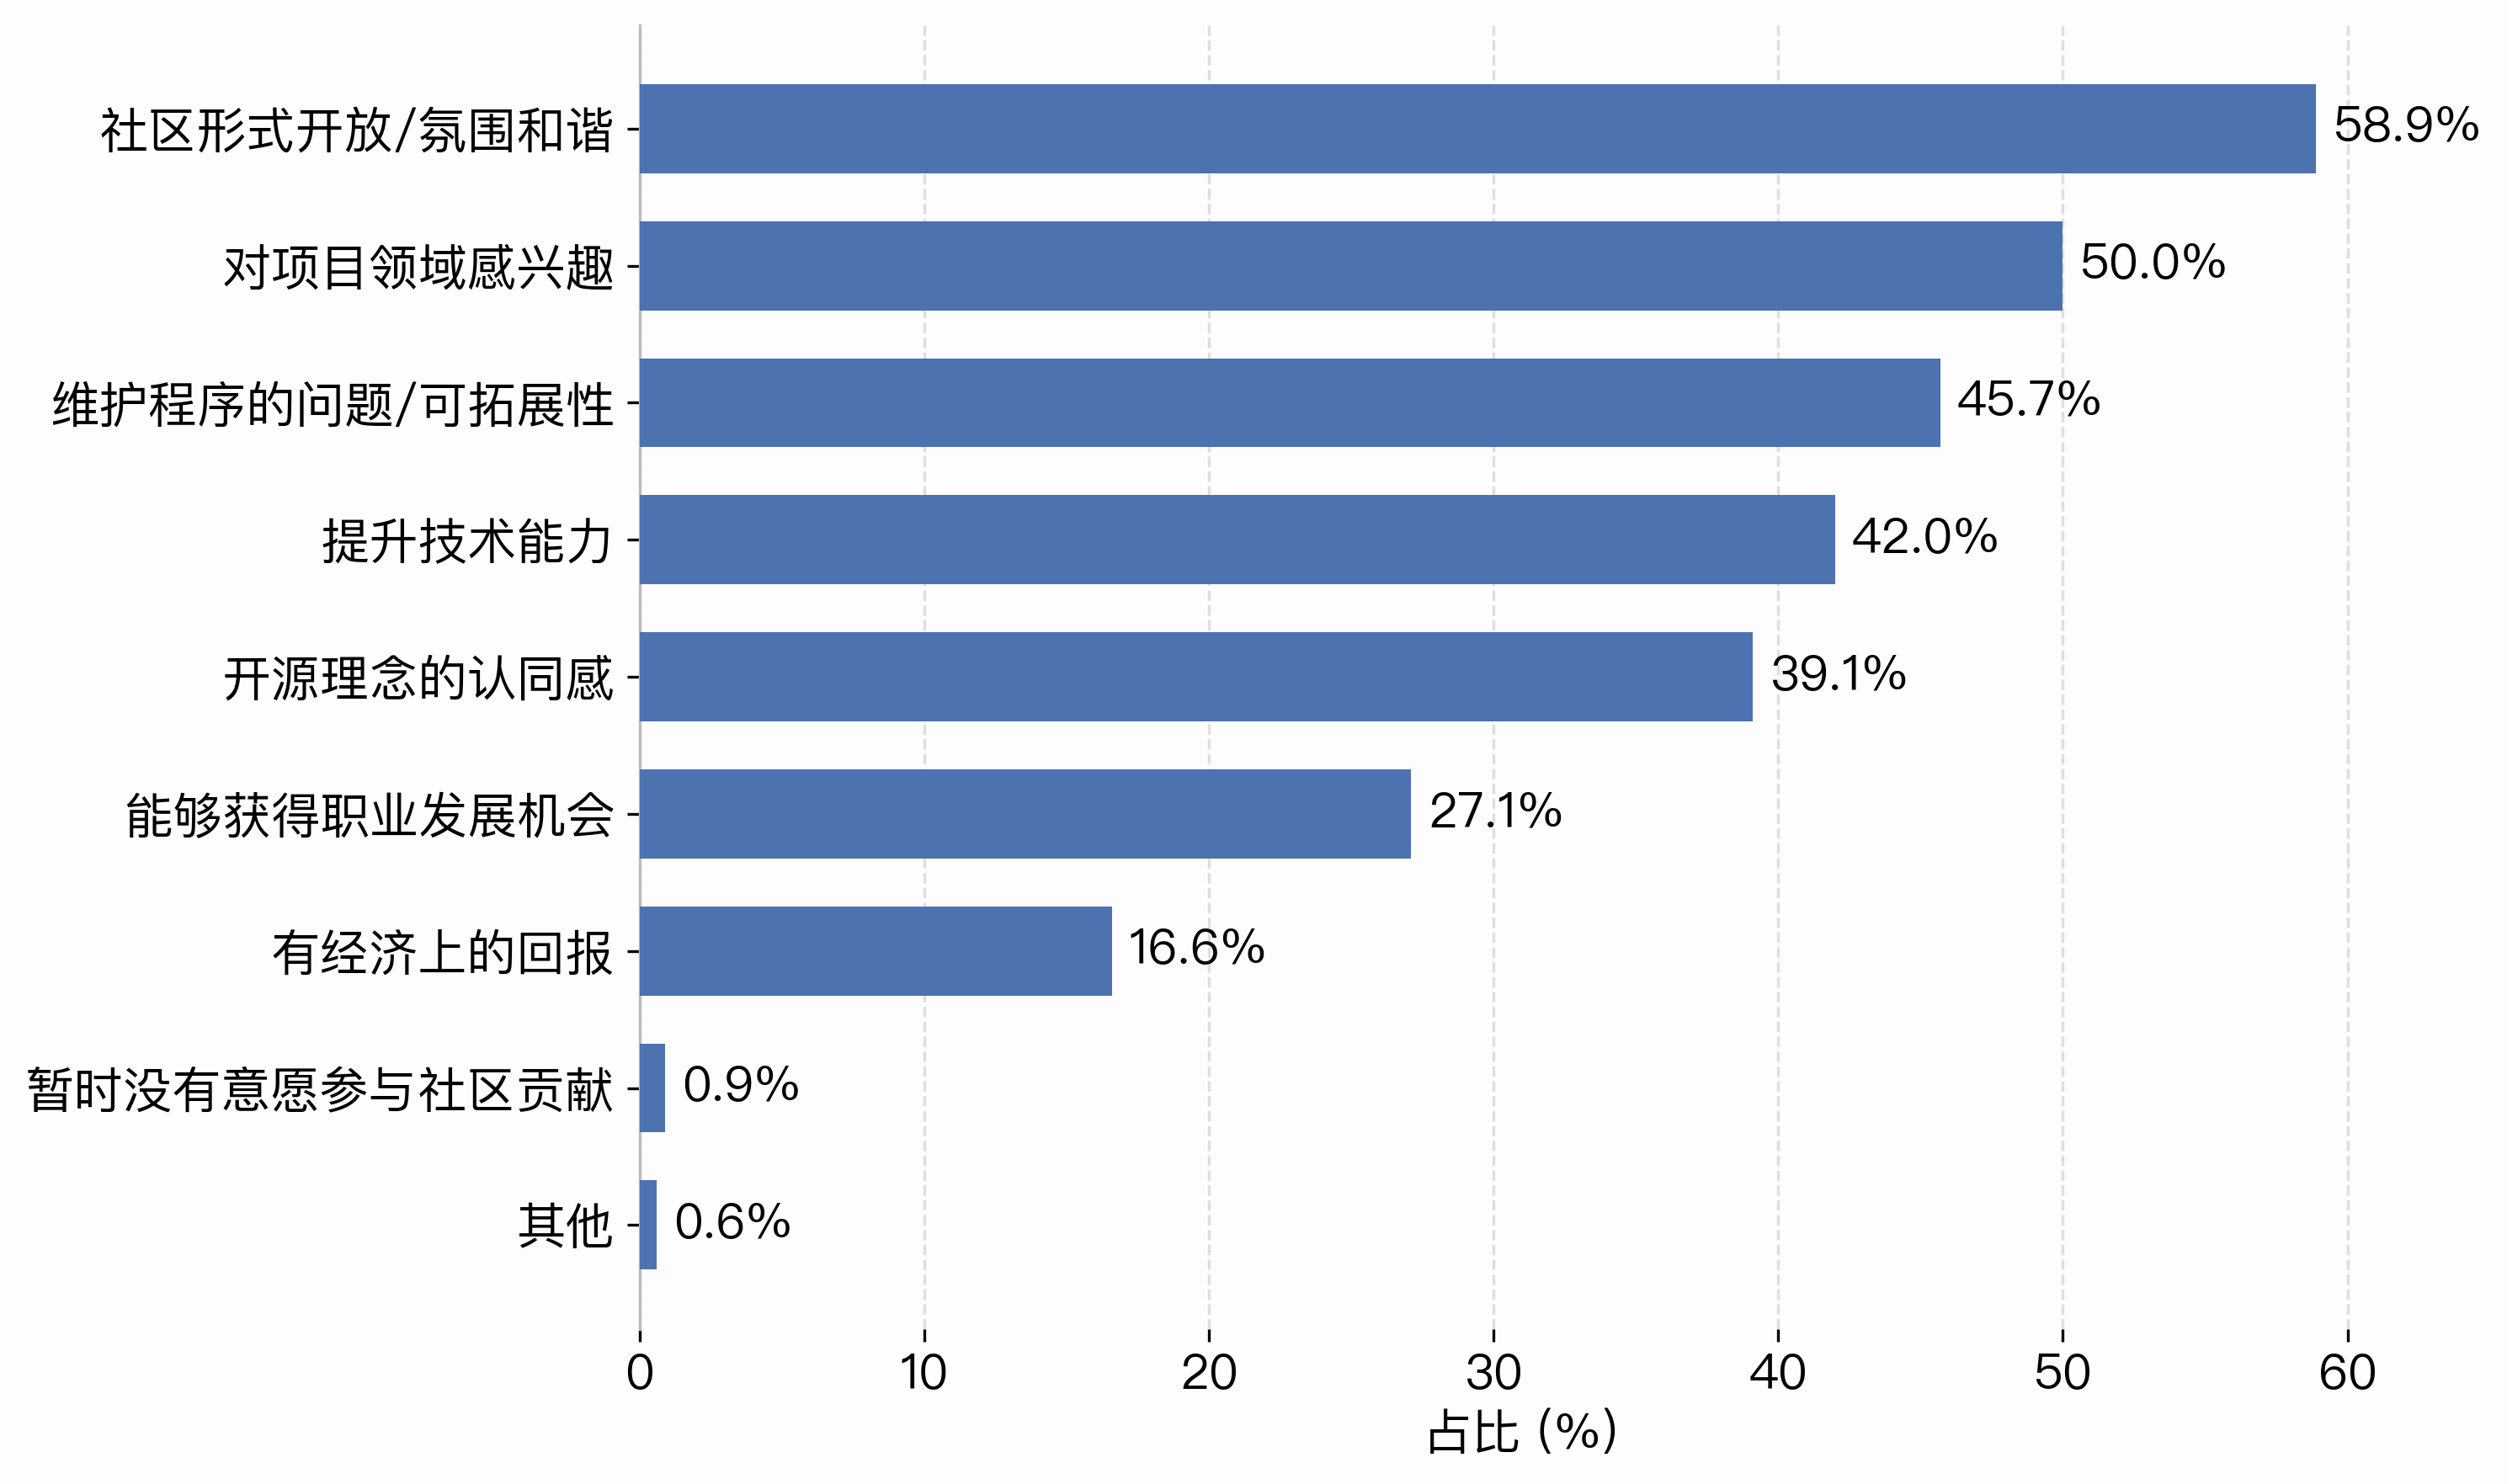
Figure 1-8 Factors Motivating Open-Source Contribution
When using open-source products, a lack of documentation was the most frequently cited problem, selected by over 60% of respondents. Dependency conflicts came next, encountered by about half, while unstable version updates were mentioned by more than 30%. Missing features and runtime errors were each cited by close to 30%, and only a small minority reported no problems at all. Documentation quality and dependency management thus remain the principal pain points in the open-source user experience.
Among the factors that prompt developers to contribute, an open and welcoming community ranked first, selected by nearly 60% of respondents. Interest in the project’s field, fixing bugs or extending functionality, and improving technical skills followed, each above 40%. Belief in open-source principles, career development opportunities, and financial reward were selected less frequently, accounting for shares ranging from roughly 30% down to just over 10%. Taken together, these results point to community atmosphere, genuine interest, and shared values as the core drivers of contribution, with material incentives playing a secondary role.
3.2.3 Areas of Technical Interest
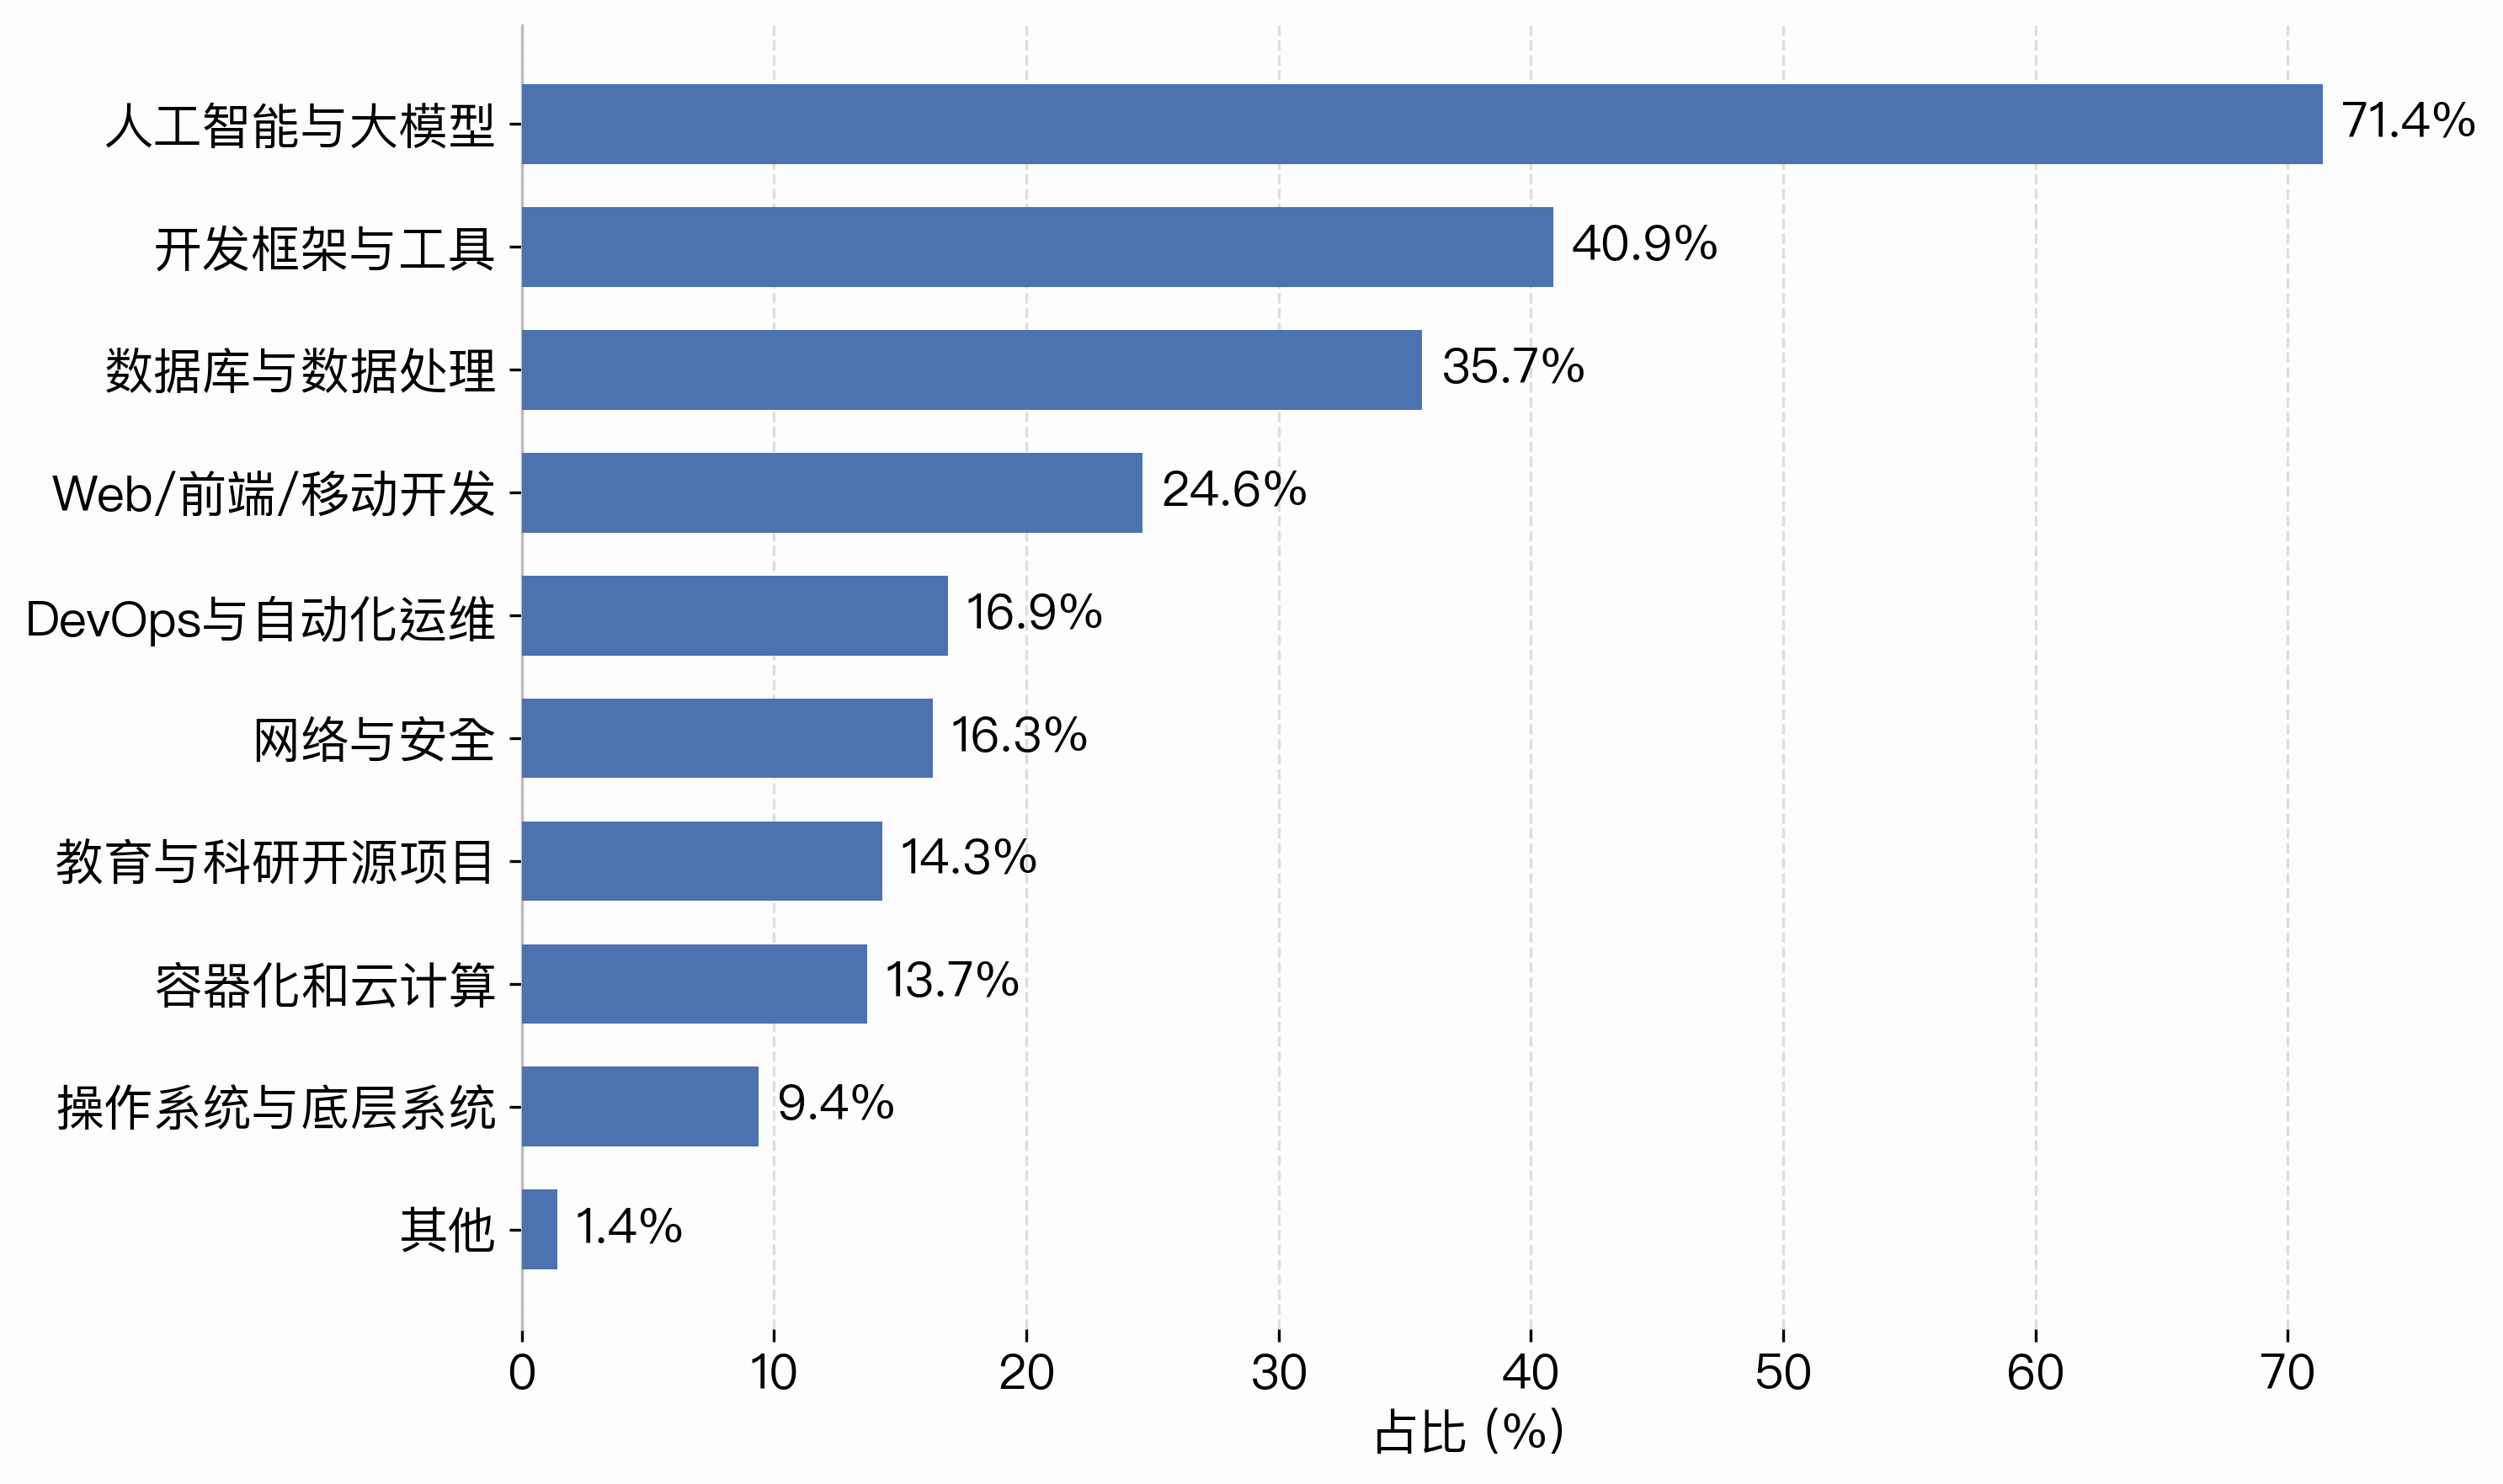
Figure 1-9 Technical Domains of Interest
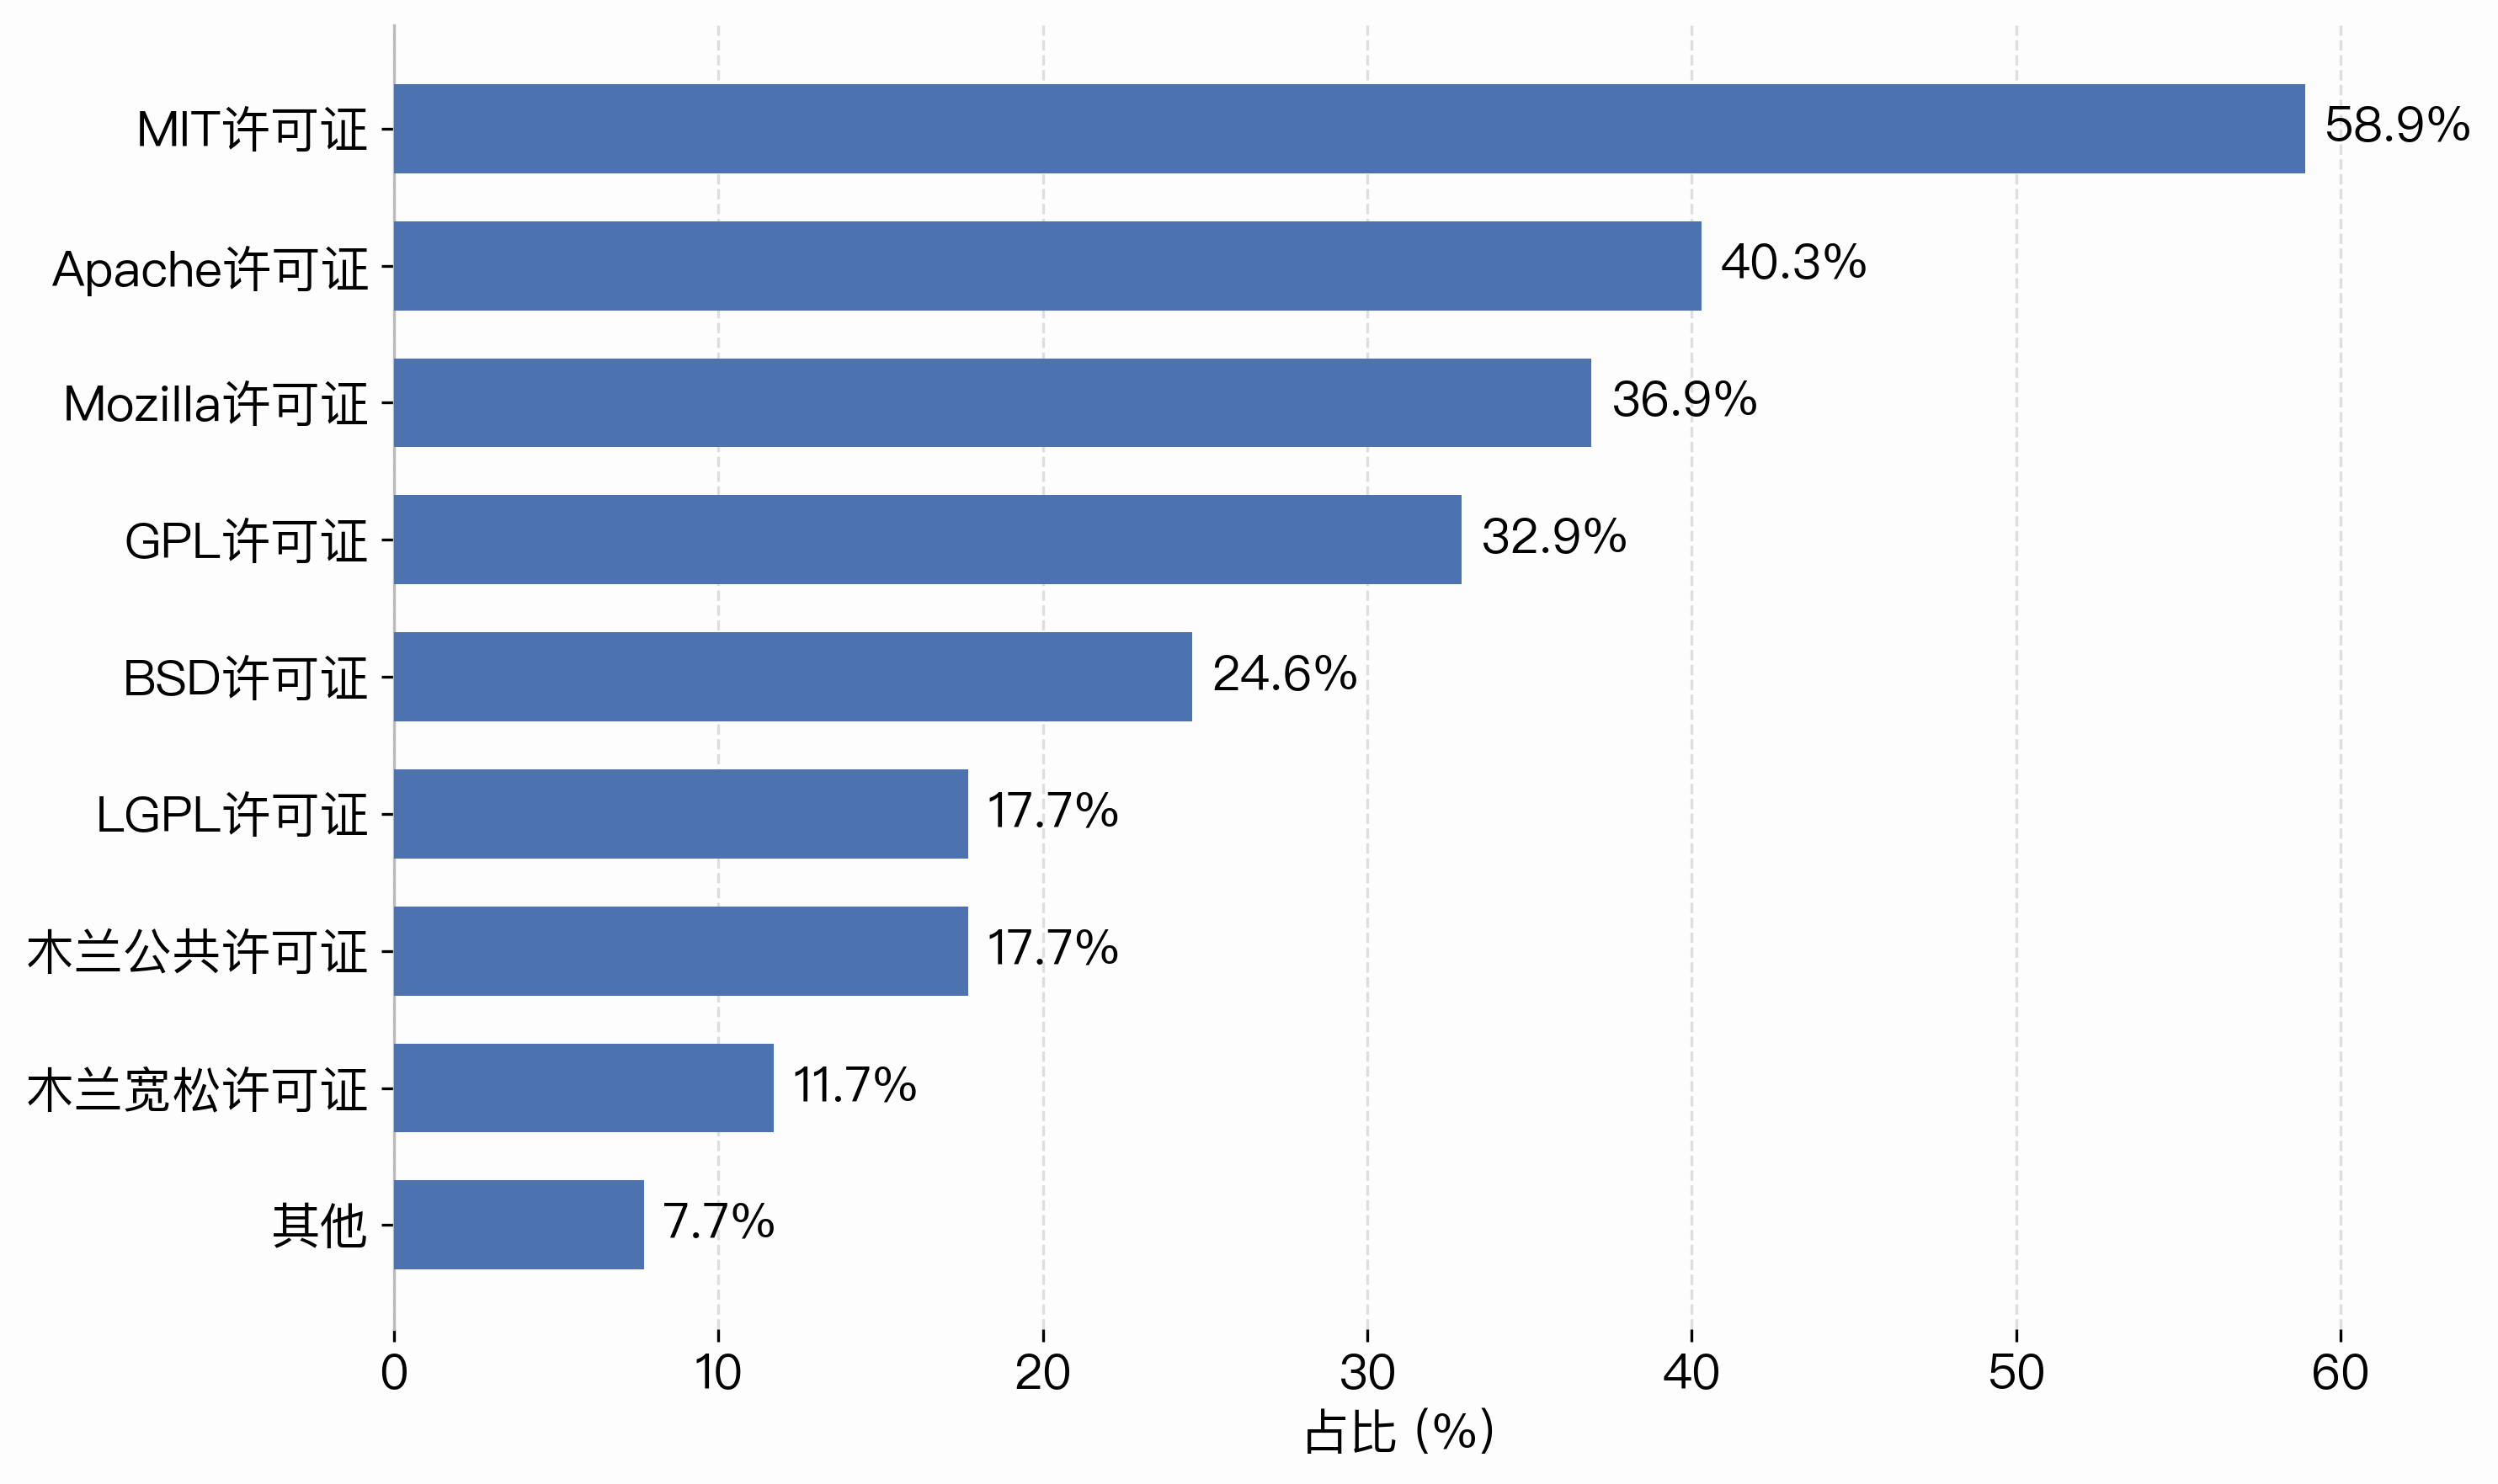
Figure 1-10 Familiarity with Open-Source Licenses
Among the technical domains that interest respondents, artificial intelligence and large models stood out by a wide margin, selected by over 70% — far ahead of any other option. Development frameworks and tools came next, followed by databases and data processing, in the range of roughly 40% to just over 30%. Web, front-end, and mobile development drew interest from close to a quarter of respondents. DevOps and automated operations, networking and security, educational and research projects, and containerization and cloud computing clustered mostly between 10% and 20%, while operating systems and low-level systems remained comparatively niche. Attention in open-source technology is thus tilting markedly toward AI and toward tools that improve development efficiency.
On familiarity with open-source licenses, MIT was the most widely known, with around 60% of respondents having heard of or used it. Apache, Mozilla, and GPL followed, each familiar to between 30% and 40%. BSD, LGPL, and the Mulan family of licenses formed a second tier, mostly in the 10% to 20% range. Overall, international licenses remain the most widely recognized, though China’s own Mulan licenses have achieved a degree of recognition among respondents as well.
3.2.4 Information Channels
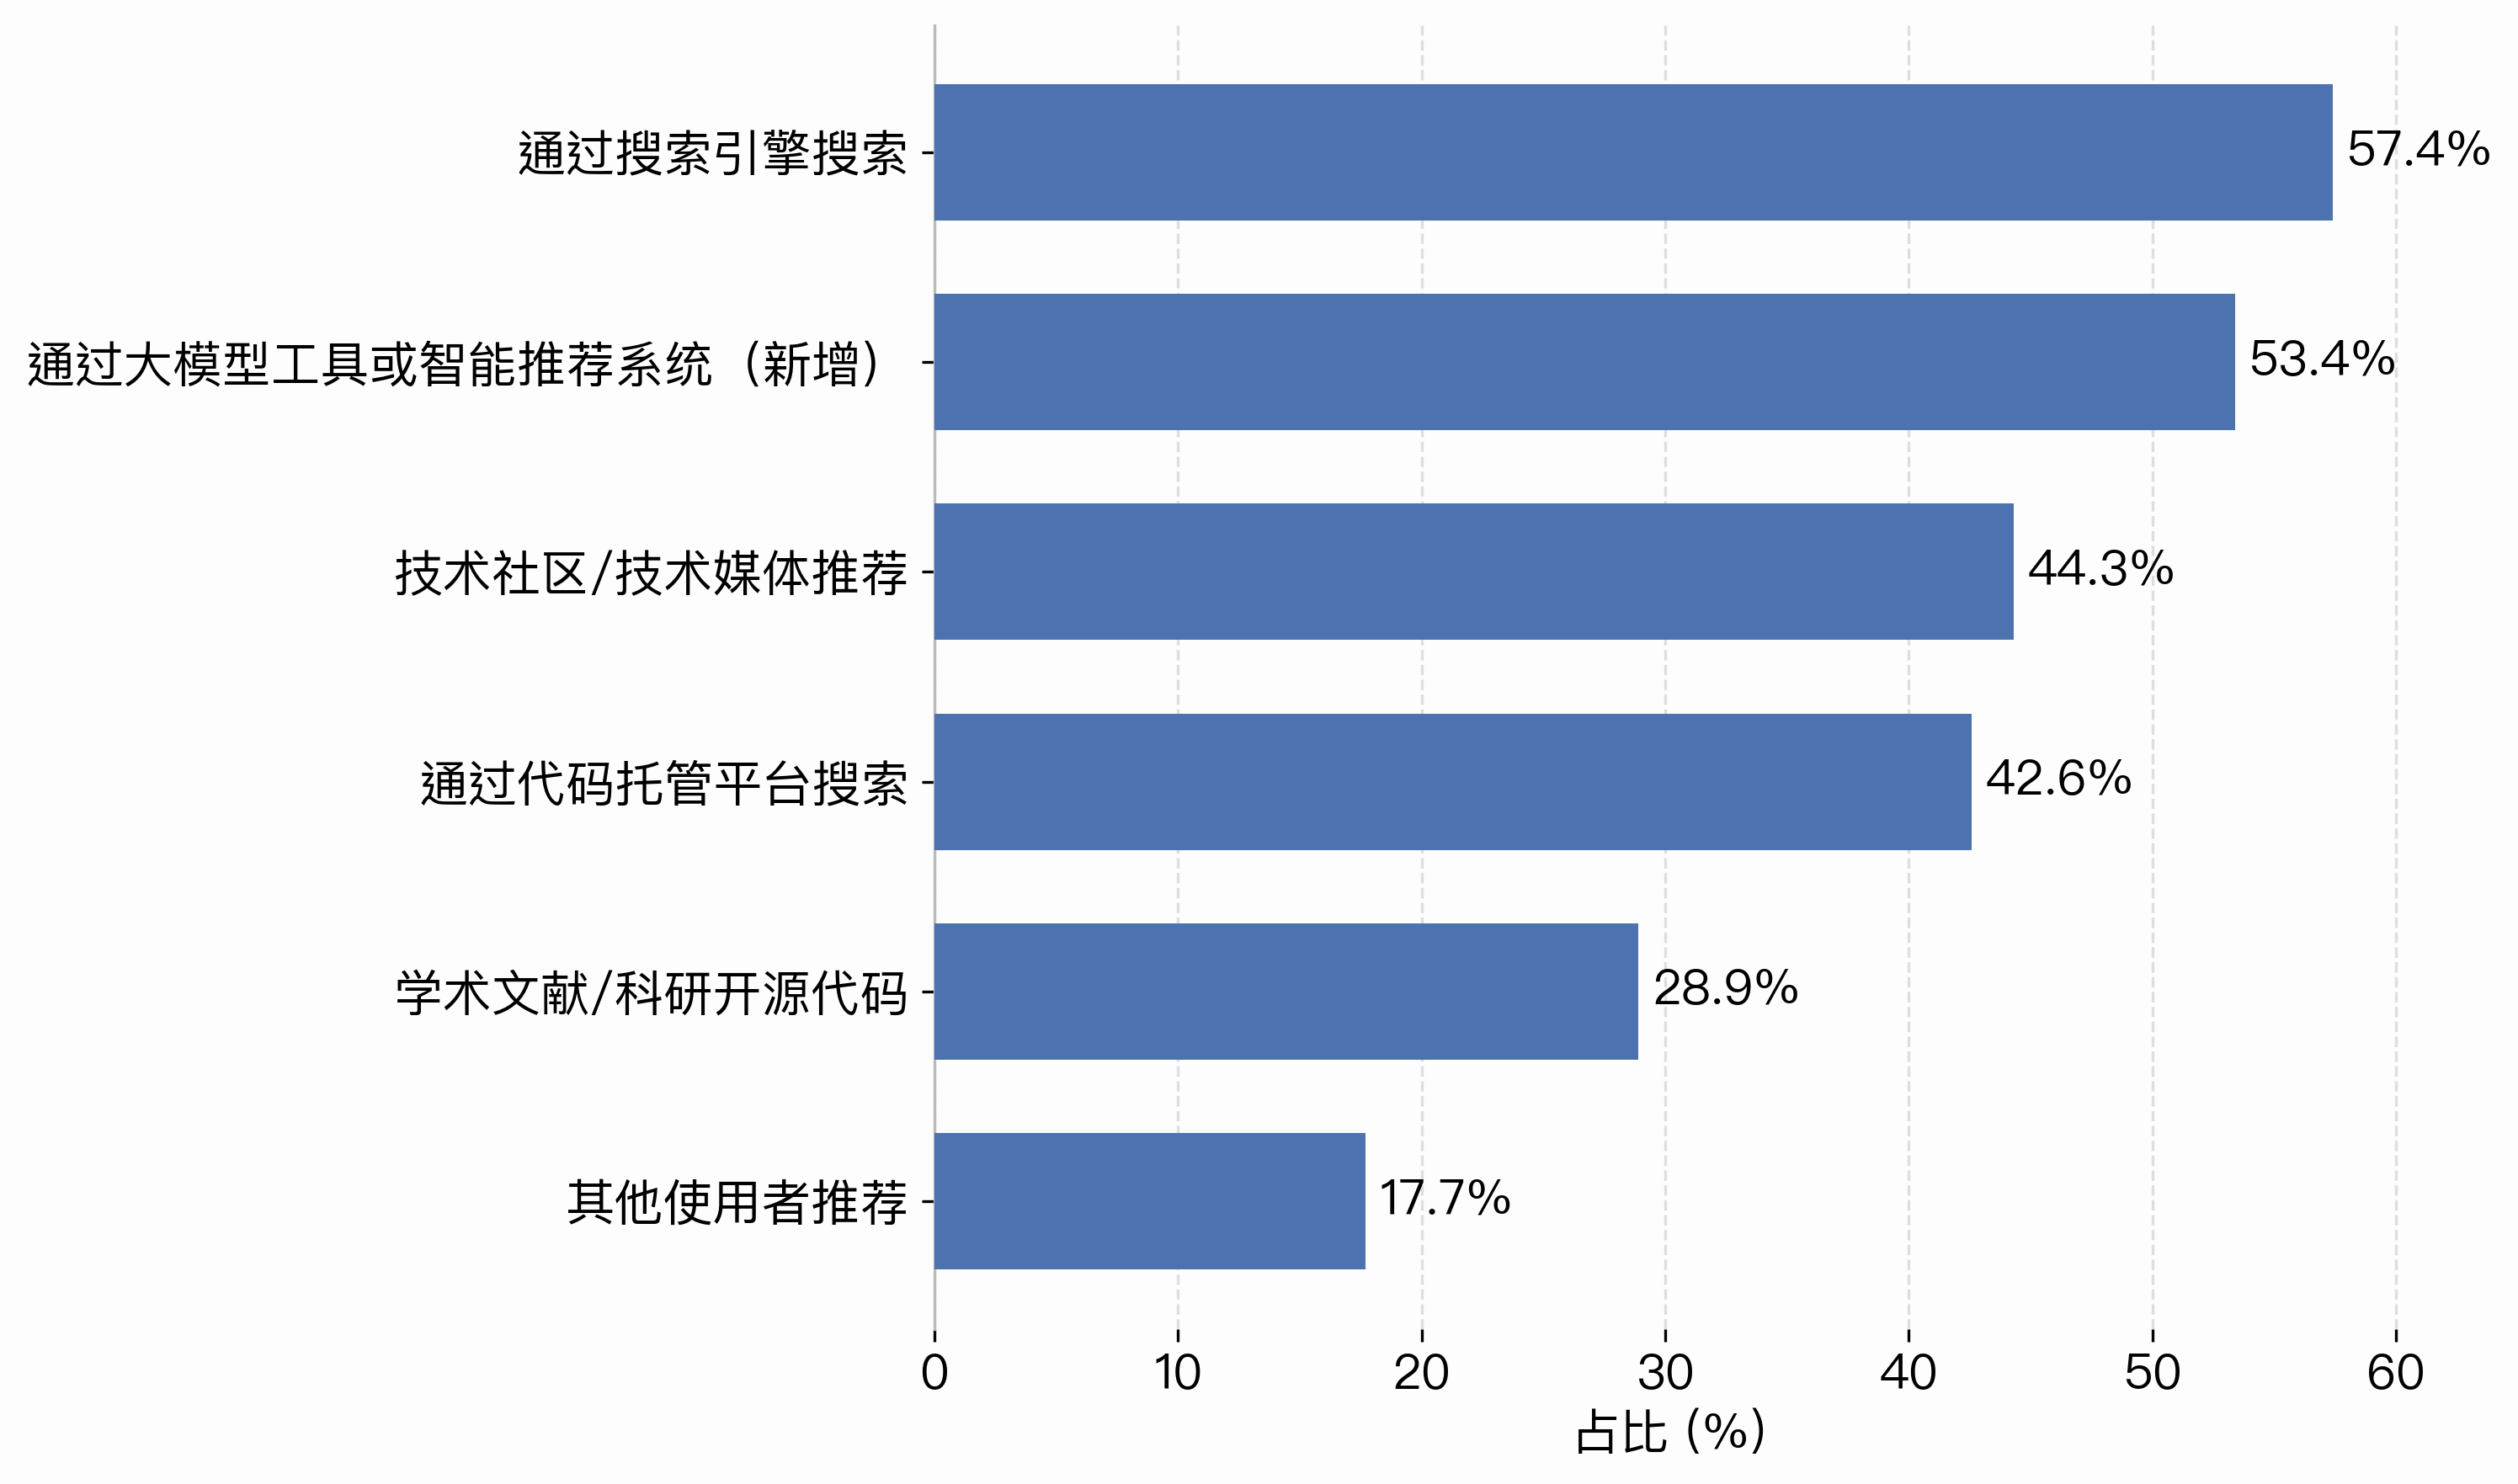
Figure 1-11 Ways of Finding Open-Source Products
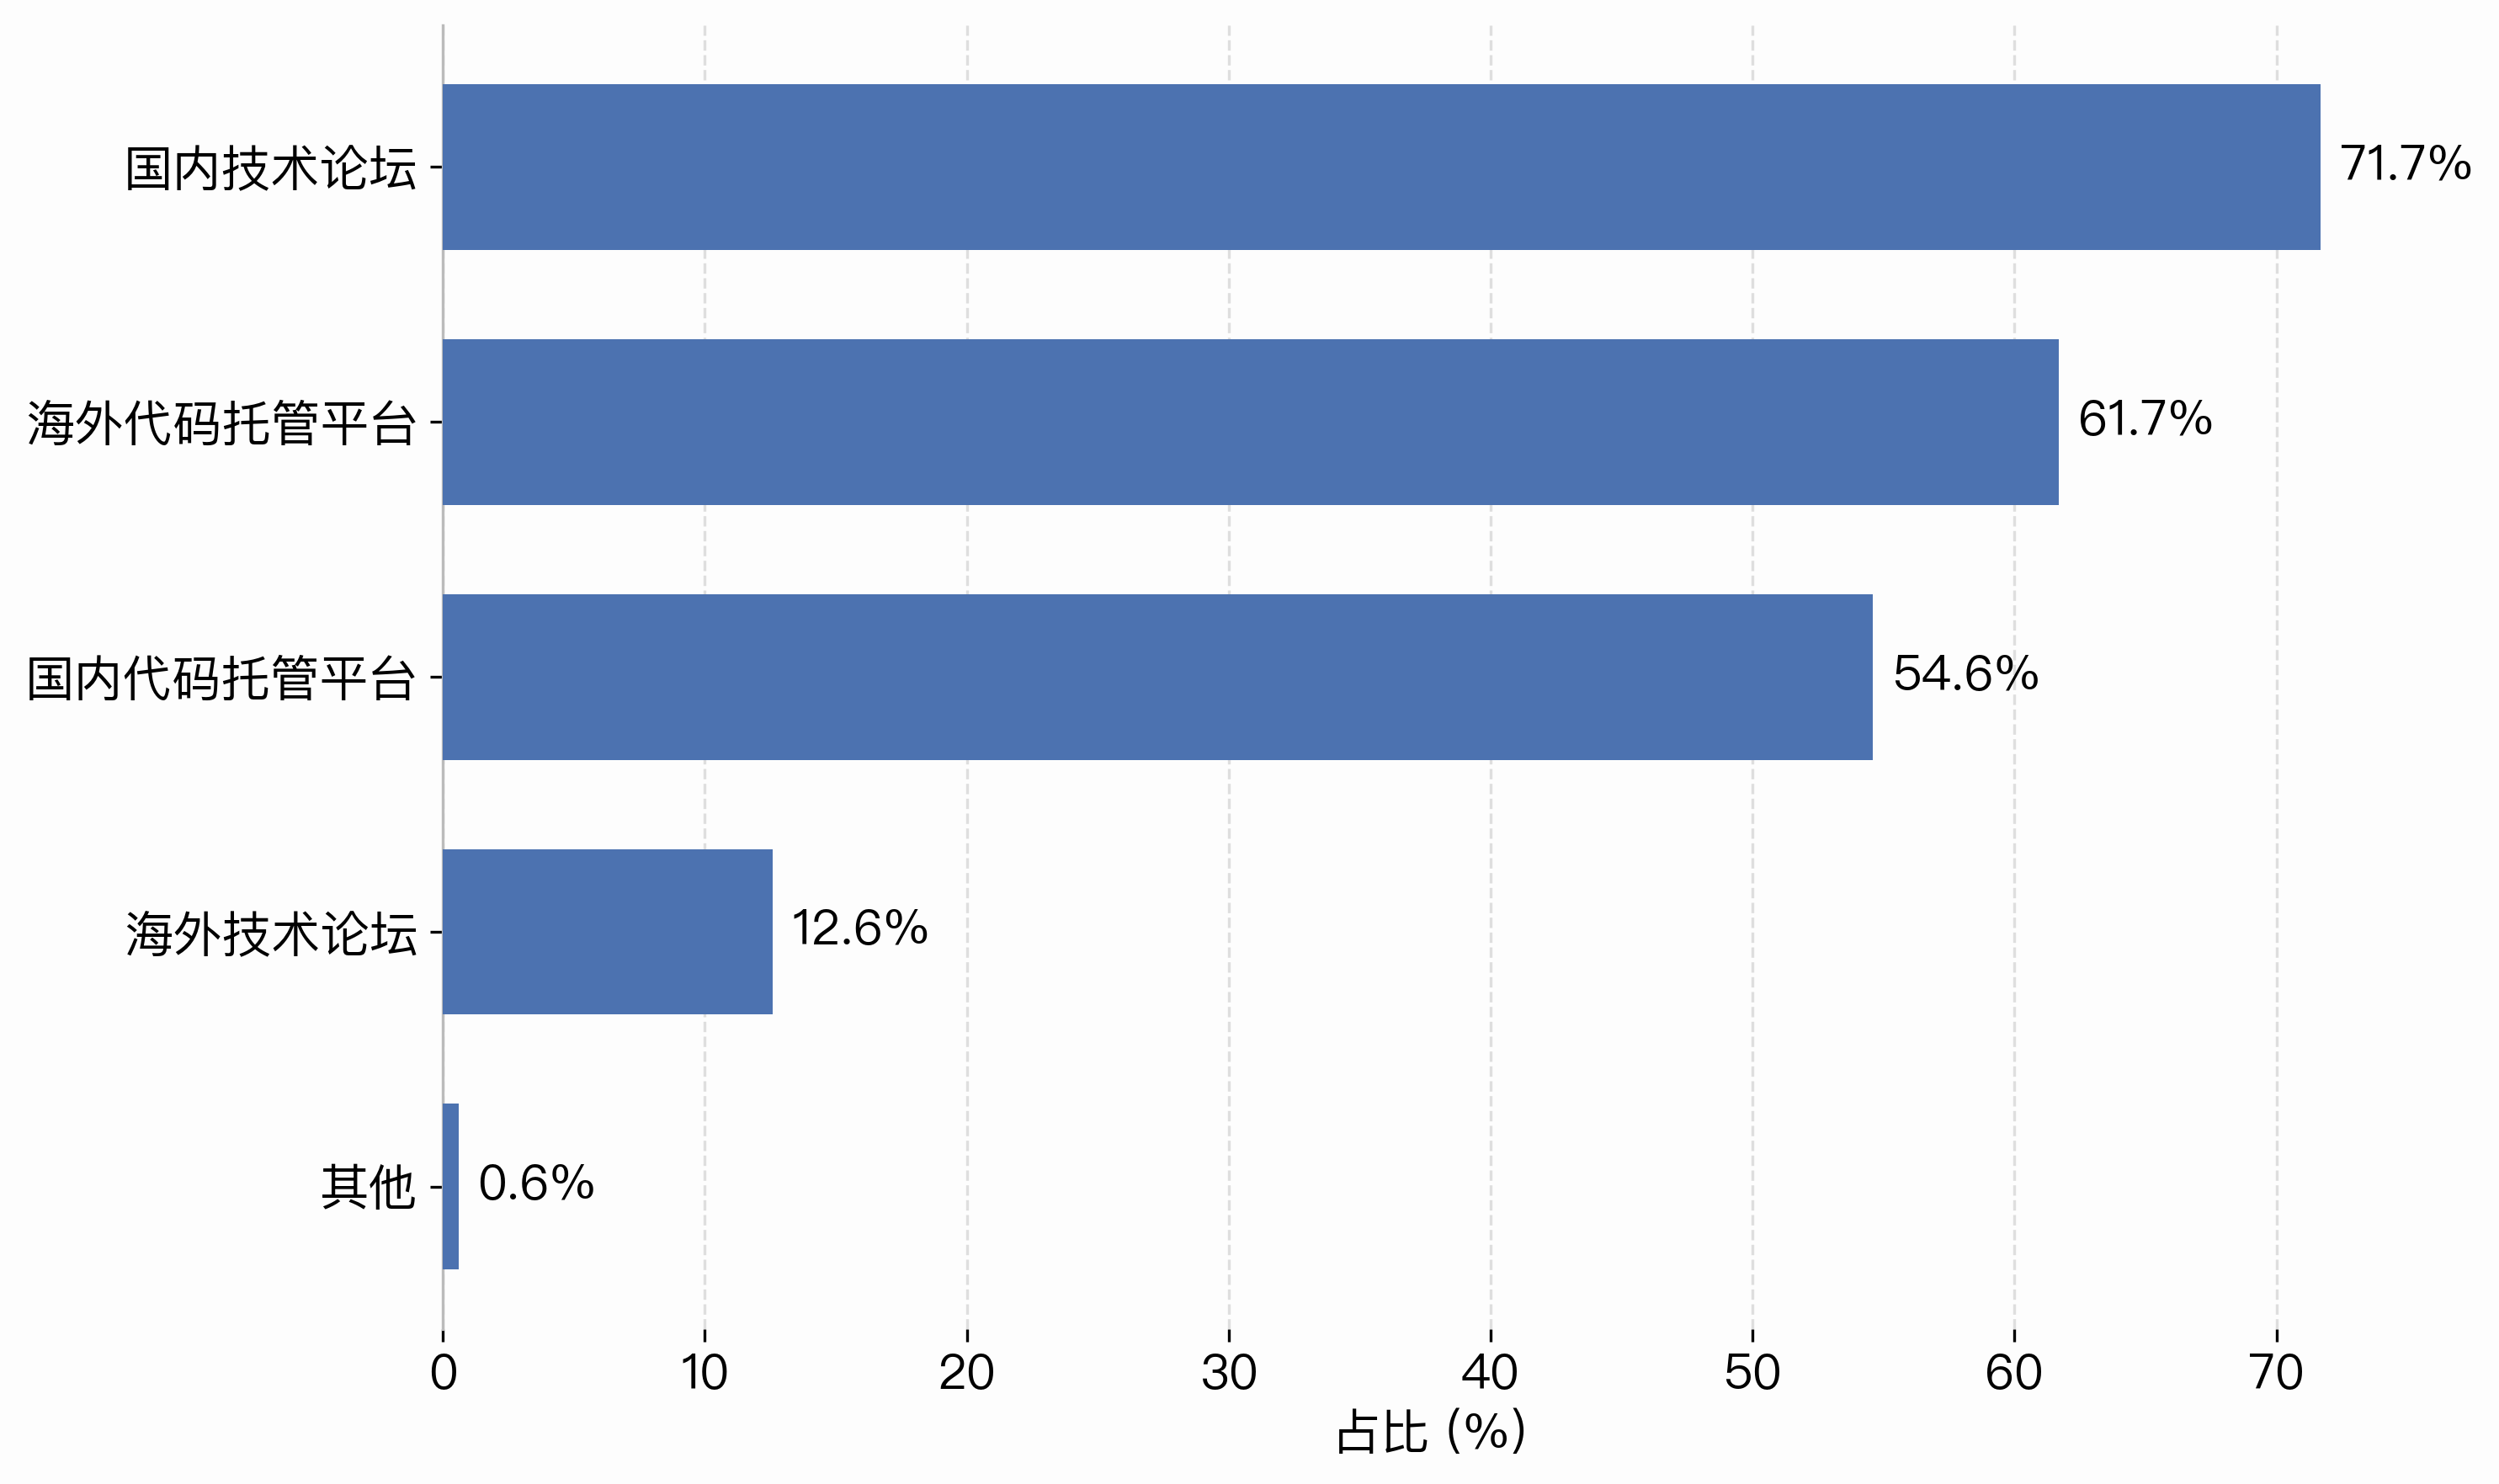
Figure 1-12 Channels for Communicating with Communities
When it comes to finding open-source products, search engines remain the most common route, chosen by more than half of respondents. Large-model tools and intelligent recommendation systems followed close behind, indicating that AI assistants have become an important entry point for information. Recommendations from technical communities and technical media, along with searches on code hosting platforms, were each selected by close to half, while academic literature and research code accounted for around 30%. Taken together, search engines, large models, technical media, and code hosting platforms form a set of parallel channels through which respondents find what they need.
Communication with open-source communities takes place primarily through domestic messaging tools (e.g., DingTalk, WeChat, QQ, Feishu) and asynchronous channels (e.g., GitHub Issues, Discussions, mailing lists, etc.), while international messaging tools (e.g., Slack, Skype, Telegram, Lark – the international edition of Feishu) are also widely used. This points to a marked contrast with international open-source communities, where asynchronous channels predominate.
Figure 1-13 Commonly Used Product and Technical Communities
Among the product and technical communities in common use, domestic technical forums were the most frequently visited, selected by over 70%. International code hosting platforms such as GitHub came next at around 60%, followed by domestic code hosting platforms at roughly half. International technical forums were used comparatively little, with only a small share of respondents visiting them regularly. This suggests that developers rely on domestic technical communities for exchanging information and keeping up with recent developments, while turning to code hosting platforms, both domestic and international, for the actual work of collaboration and code management.
3.3 Contribution to Open Source
The questions in this section are addressed to respondents at the level of contributor or above in open-source communities. By analyzing the types and quality of contributions respondents make to open-source projects, we can assess what they bring to their communities specifically and identify potential ways to make contributions more efficient and effective.
3.3.1 Open-Source Participation Among University Students
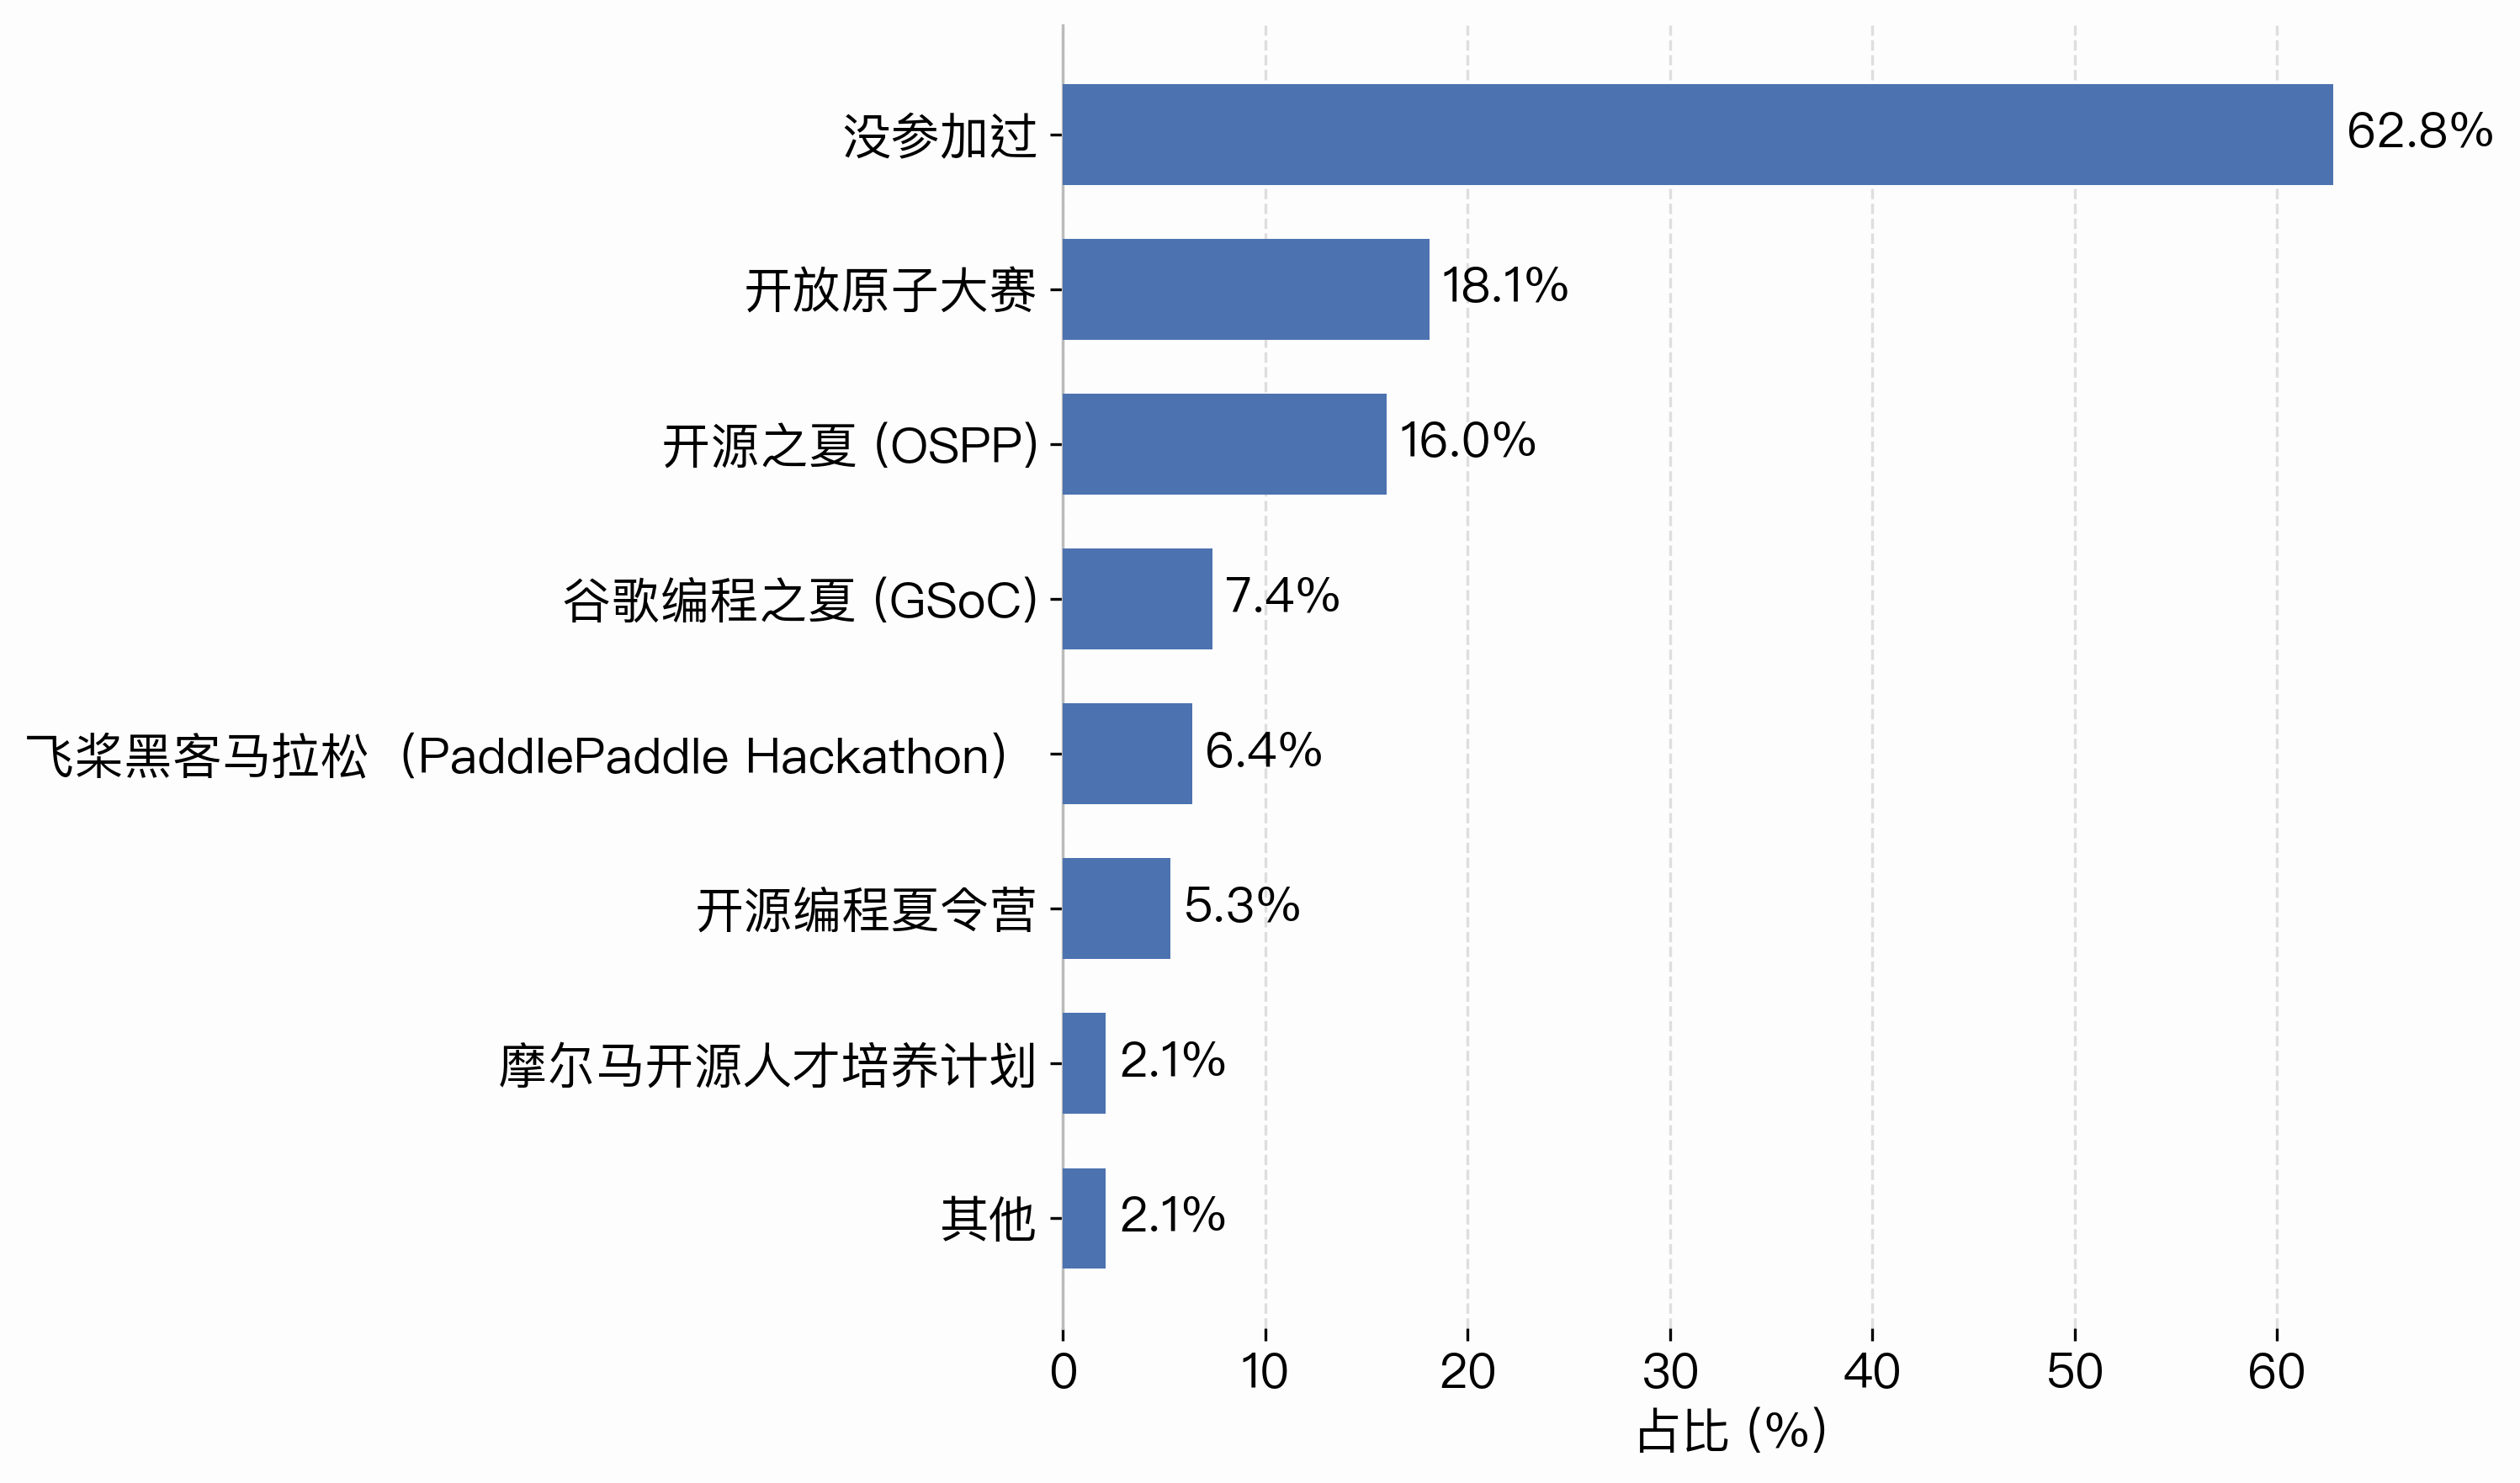
Figure 1-14 Participation in open-source programs
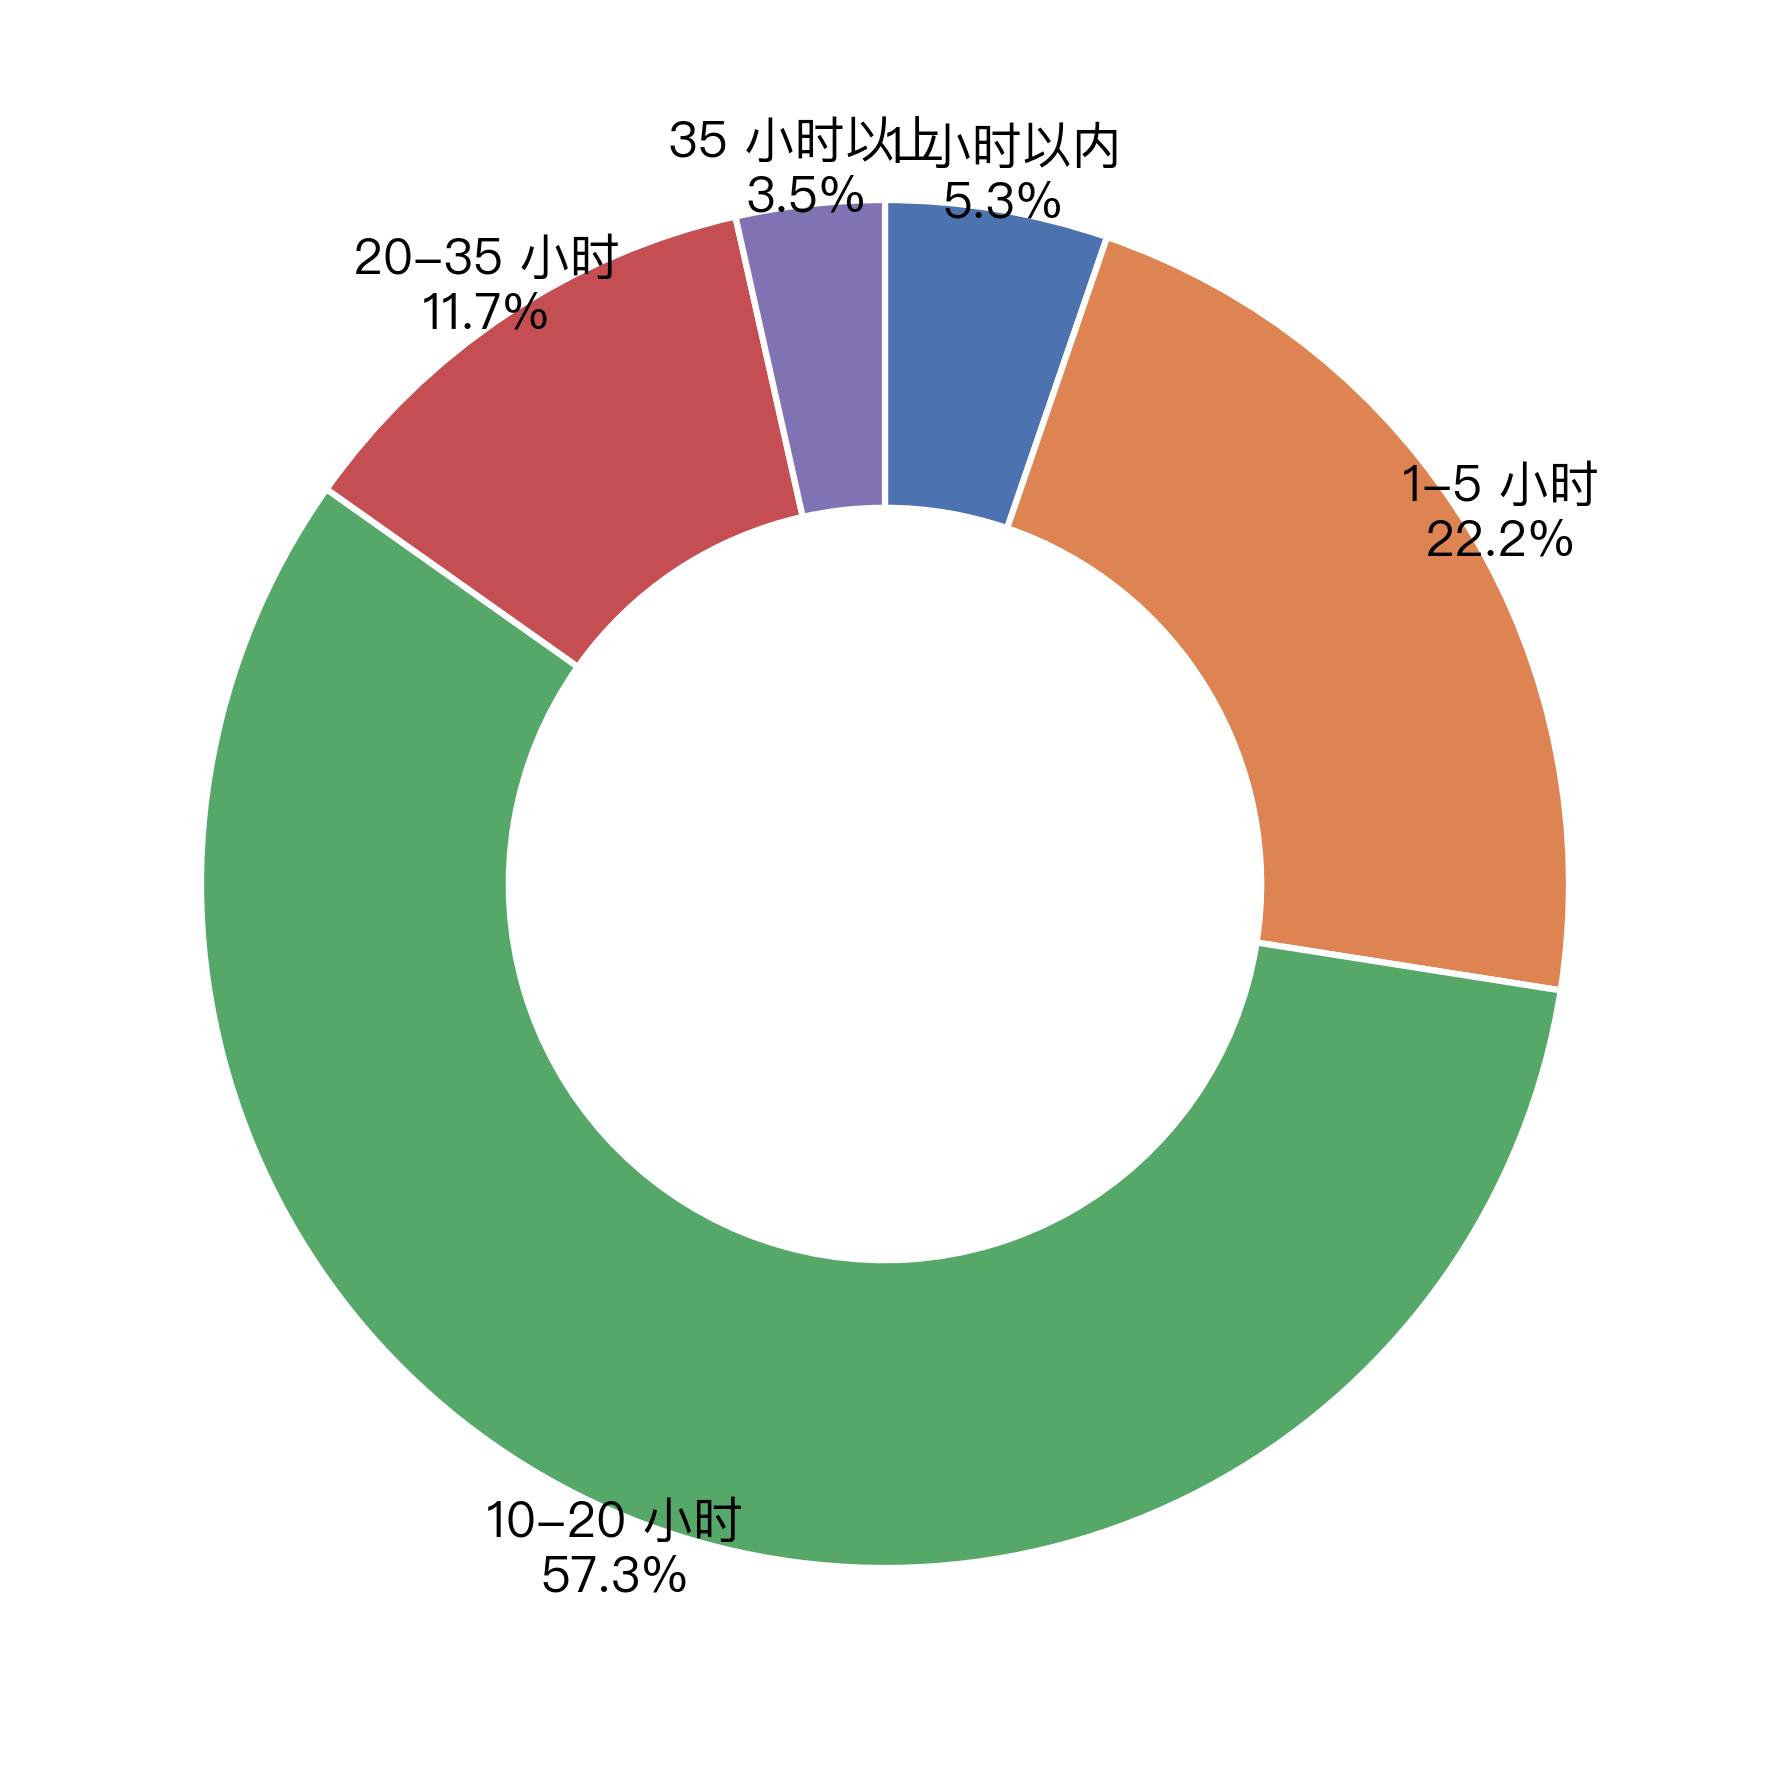
Figure 1-15 Weekly hours spent on open source
On participation in open-source programs, more than 60% of respondents had never taken part in one, indicating considerable room to improve the visibility and reach of such programs at both the university and community levels. Among those who had participated, the main channels were the OpenAtom competitions, the Open Source Promotion Plan (OSPP), various open-source summer camps, and international programs such as GSoC, each accounting for between 10% and 20%.
Weekly time spent on open-source projects clustered in the 10–20 hour band, chosen by close to 60% of respondents – a sign that a substantial number of active contributors now treat open source as a regular, moderate commitment. The 1–5 hour and 20–35 hour brackets followed, together accounting for just over 30%, while few respondents reported more than 35 hours a week. Taken together, those devoting more than 20 hours a week came to somewhat over 10%. They form the community’s core contributing force.
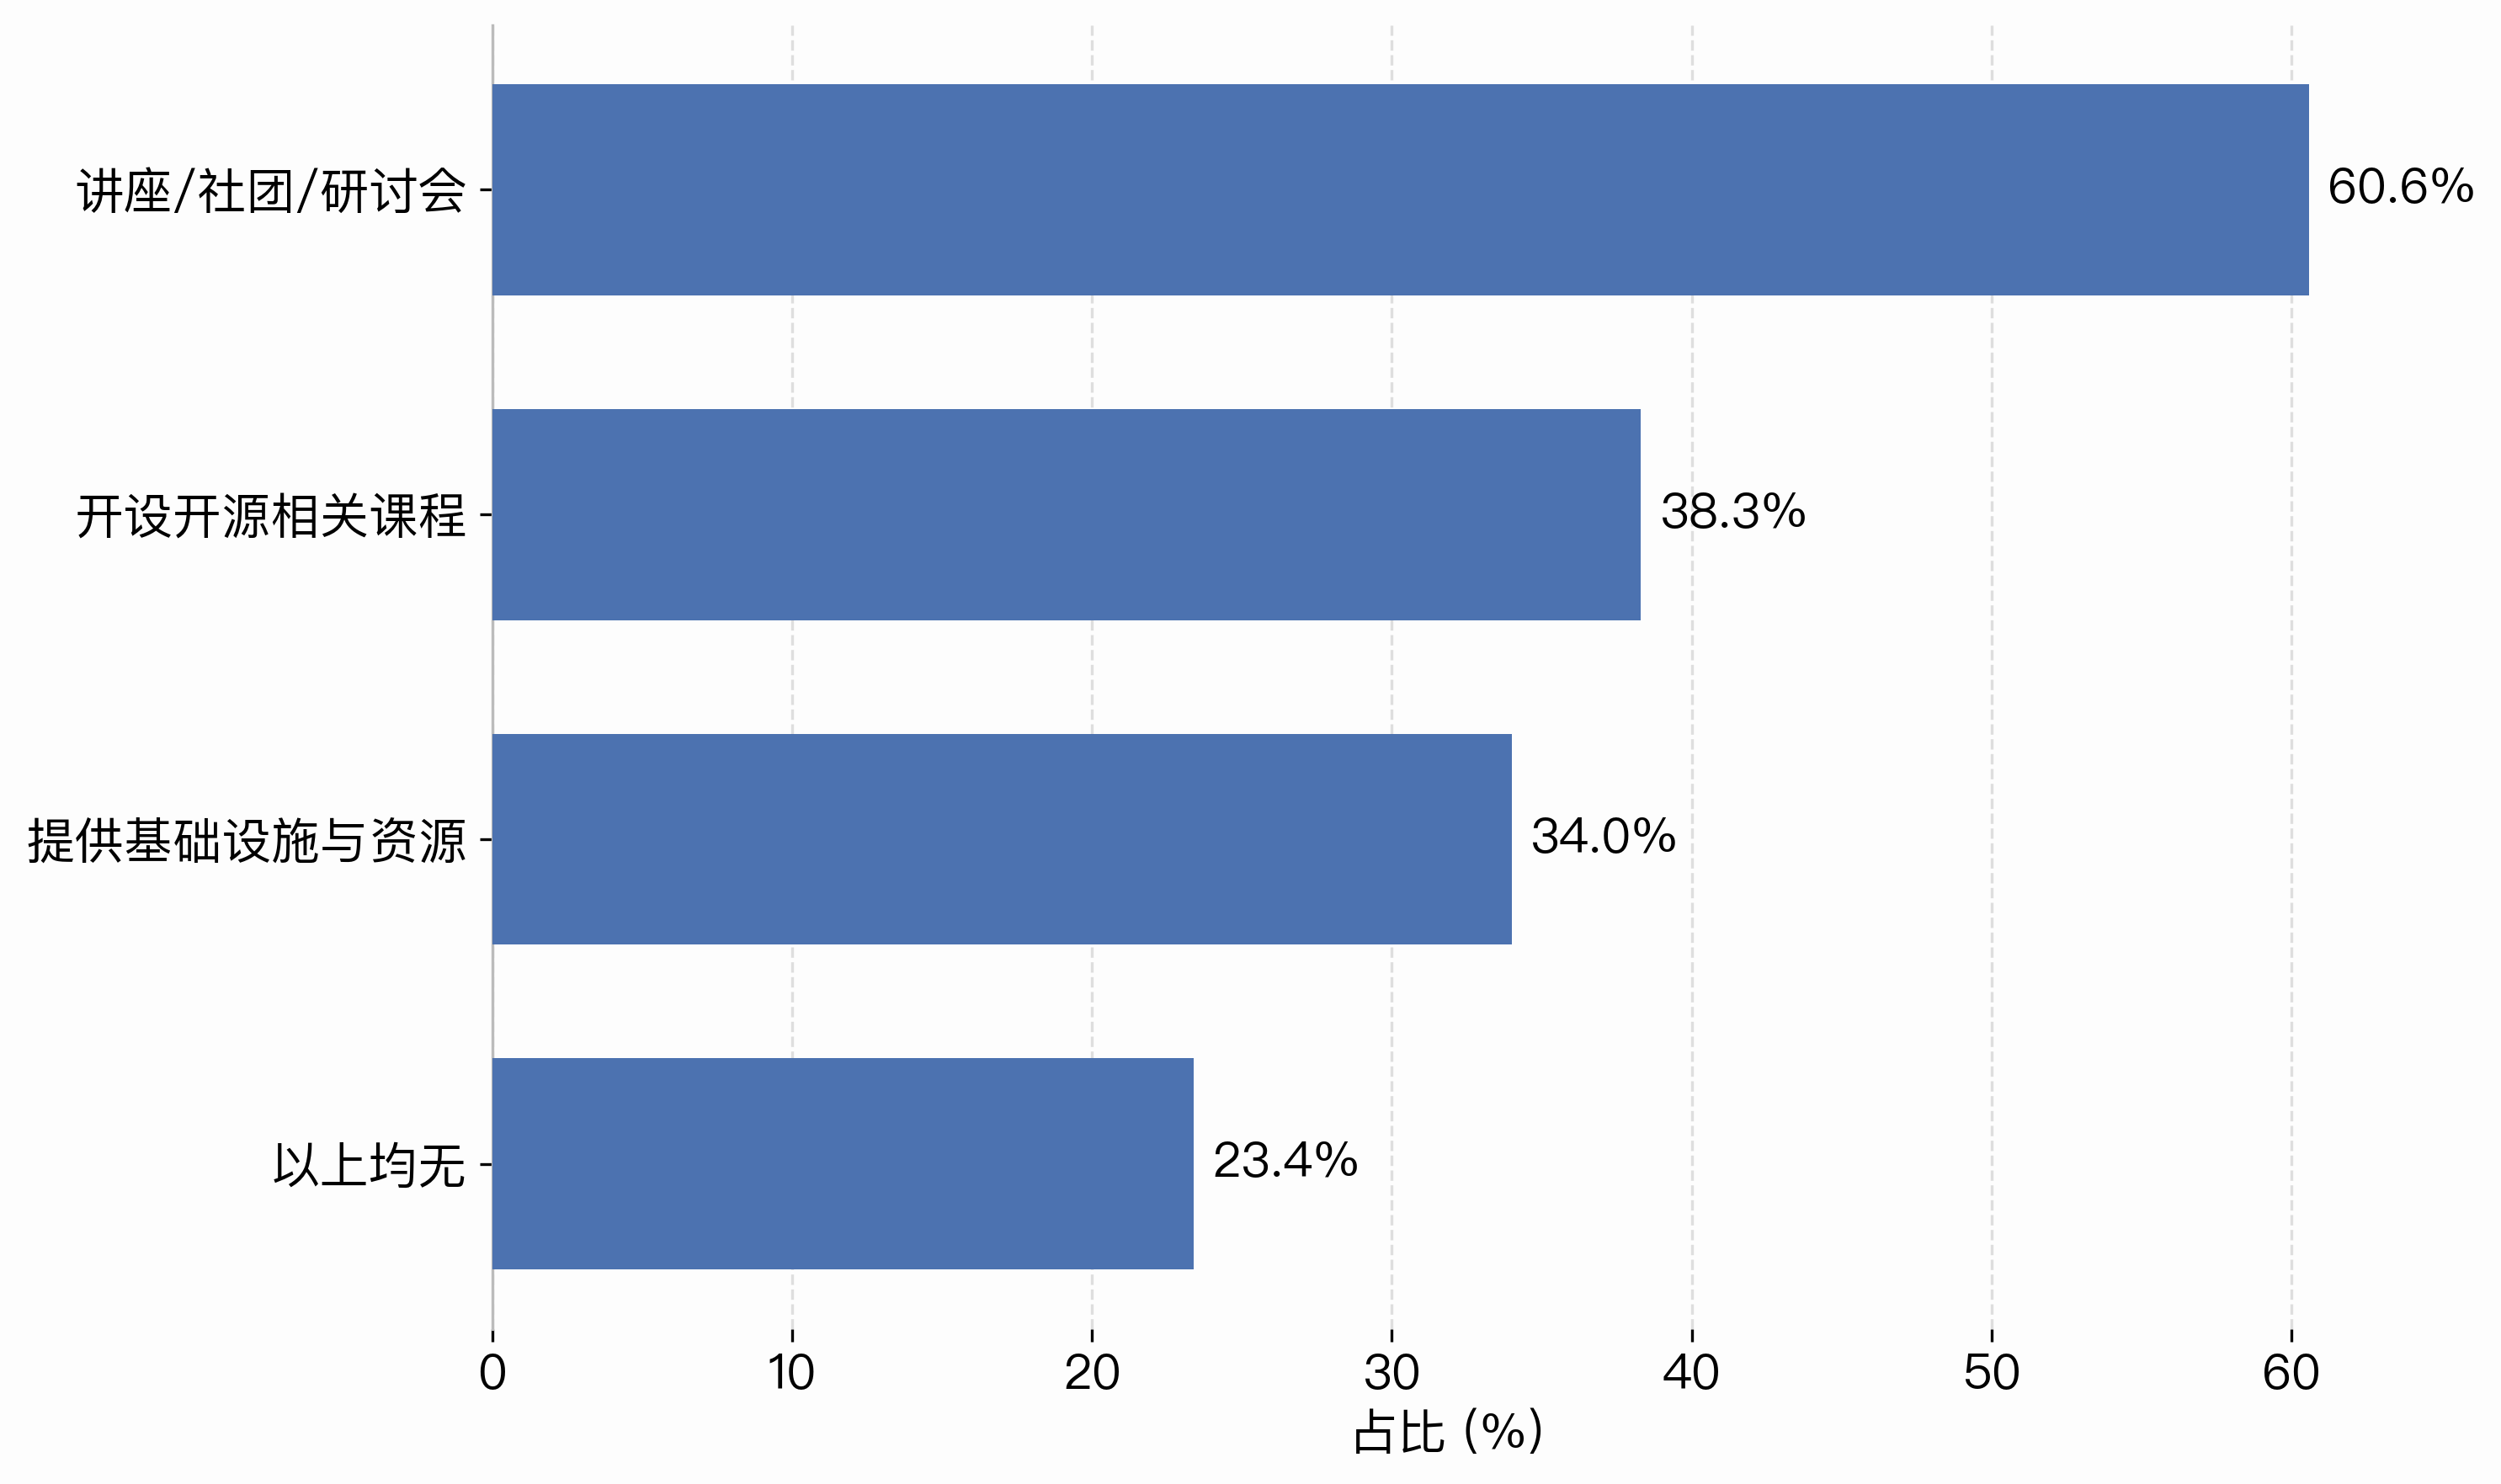
Figure 1-16 Open-Source Education and Support at Respondents’ Universities
A considerable proportion of student respondents reported that their universities offer open-source-related courses. Some said their universities host lectures, student clubs, or seminars centered on open-source projects, and some reported that their universities provide infrastructure and resources to support open-source work, such as servers and code hosting platforms.
3.3.2 Types of Open-Source Contribution
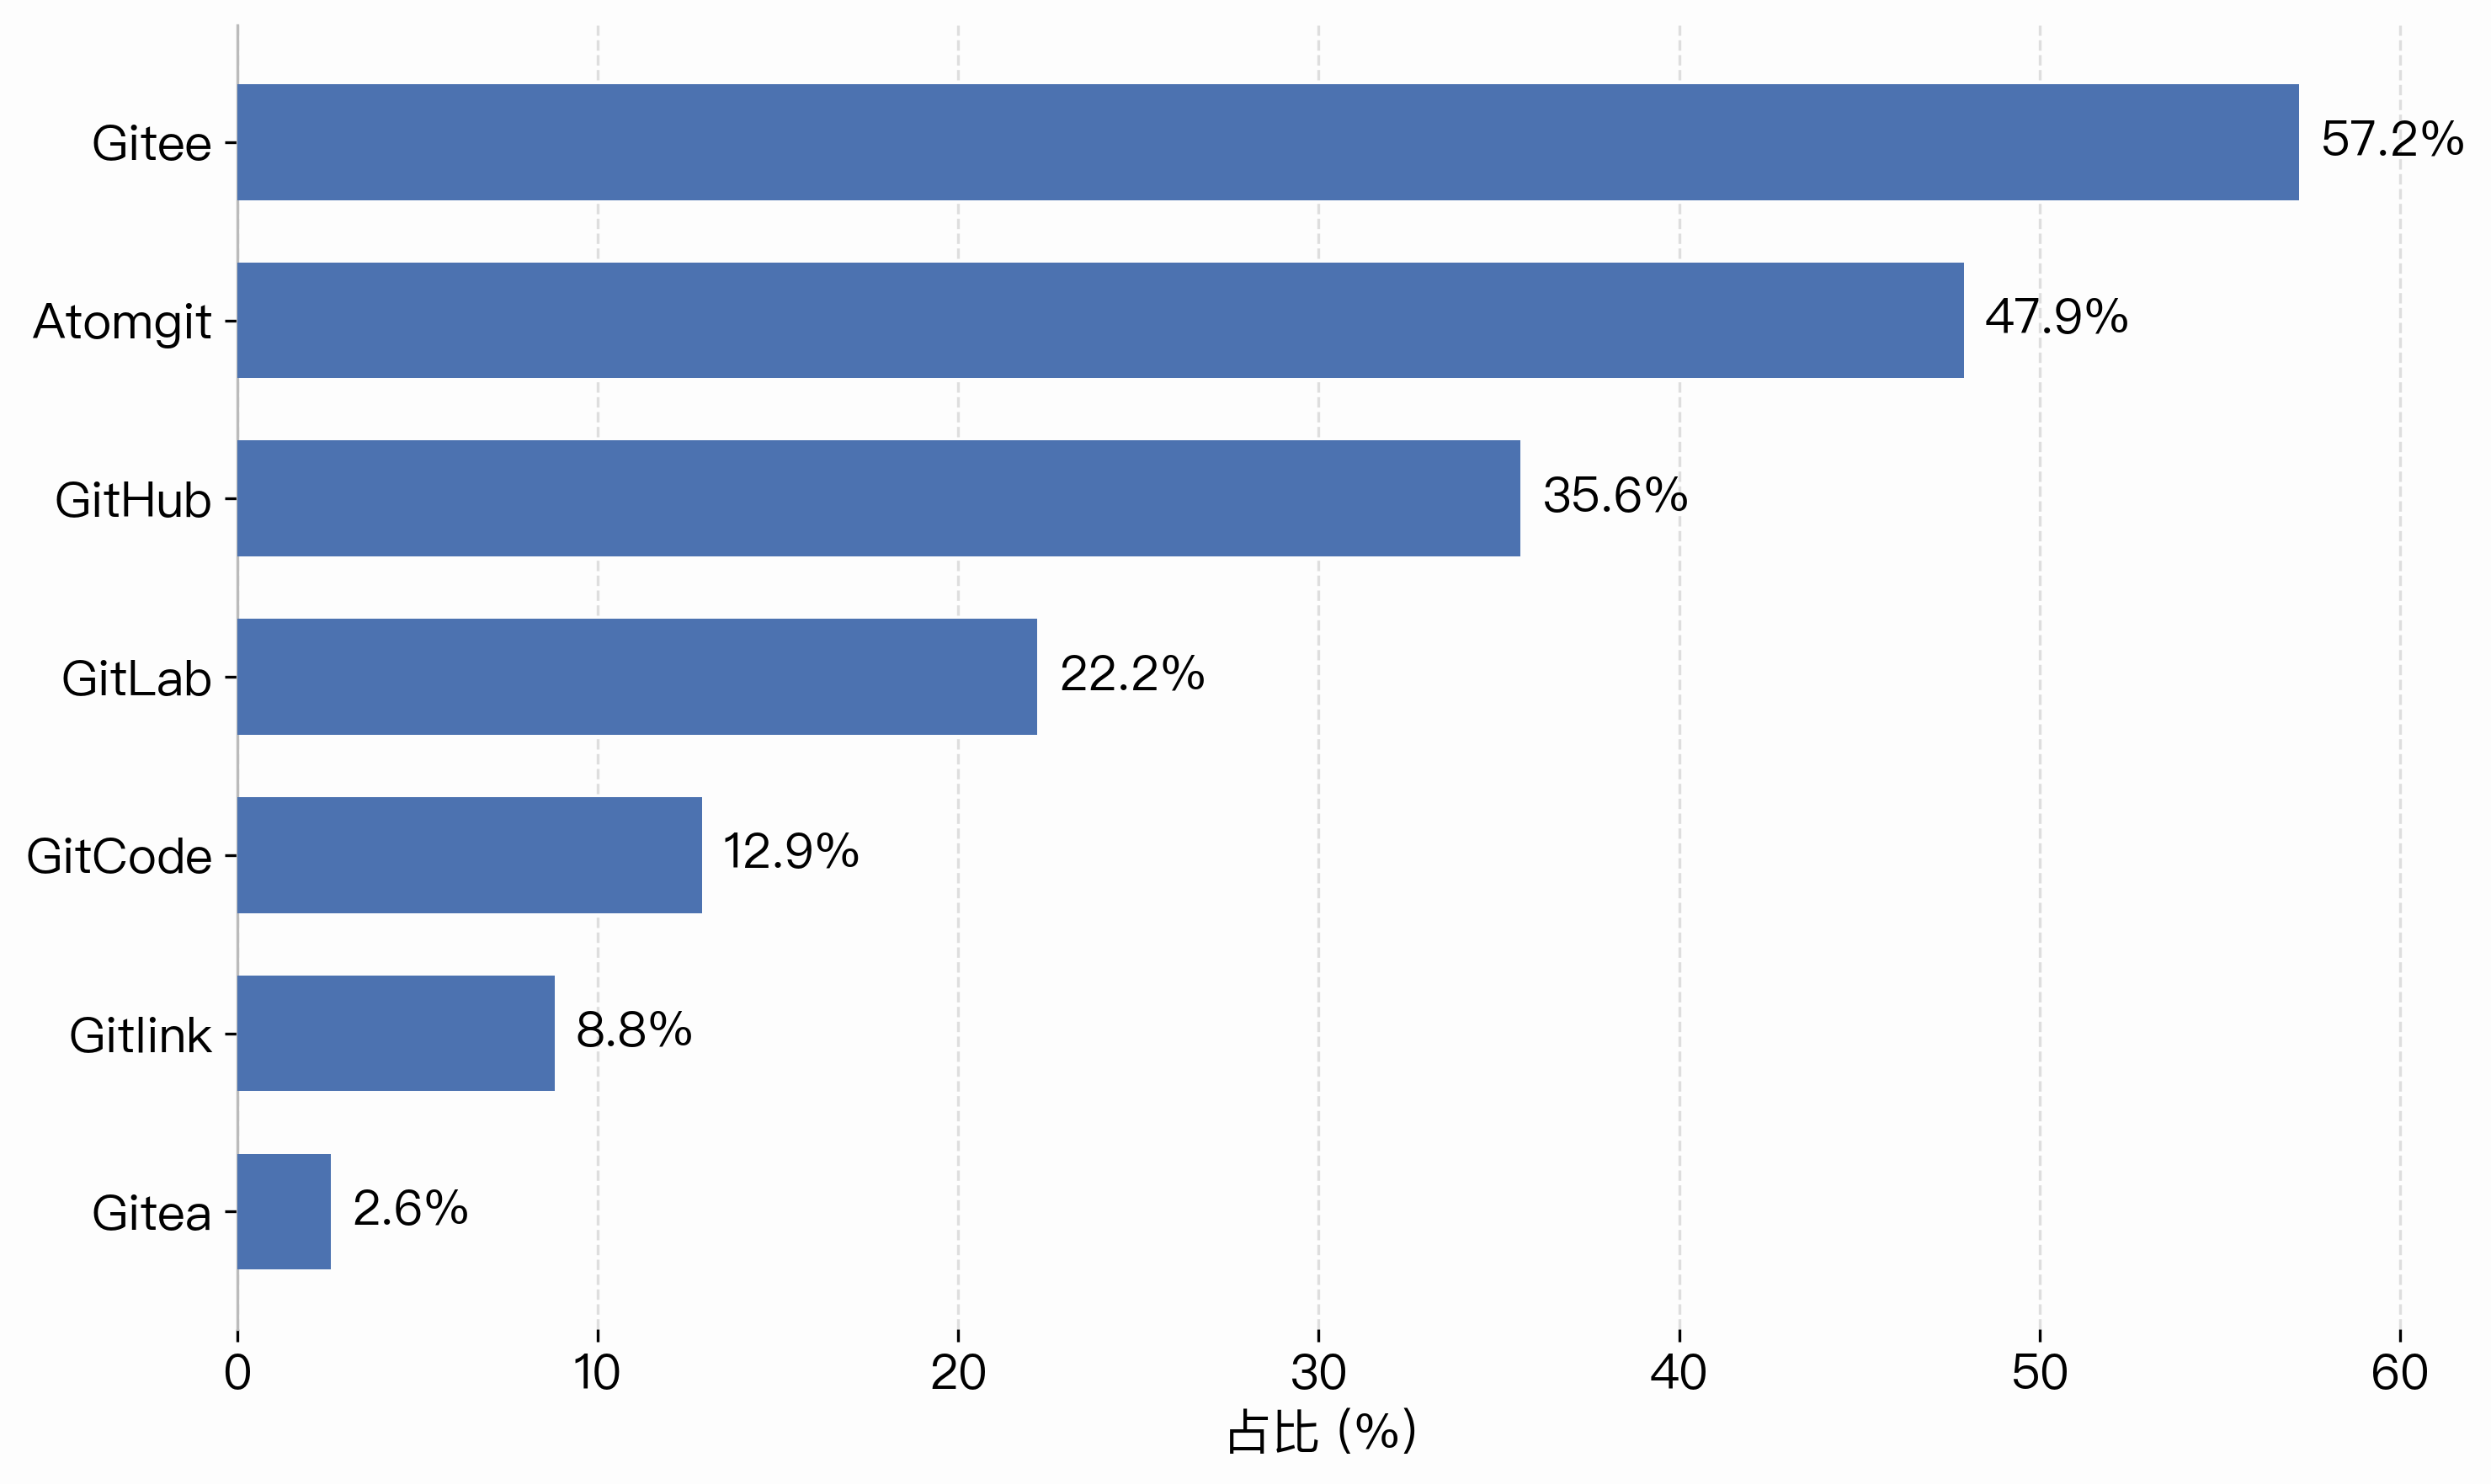
Figure 1-17 Primary Platforms for Open-Source Contribution
On the platforms respondents use for open-source contribution, domestic platforms held a clear lead: Gitee was the most widely used, at close to 60%, followed by AtomGit at around half, while GitHub and GitLab came in at just over 30% and around 20% respectively. Domestic platforms have thus become the primary venue for the contributions that Chinese developers actually make, though international code hosting platforms remain an important presence.
3.3.3 Contents of Open-Source Contribution
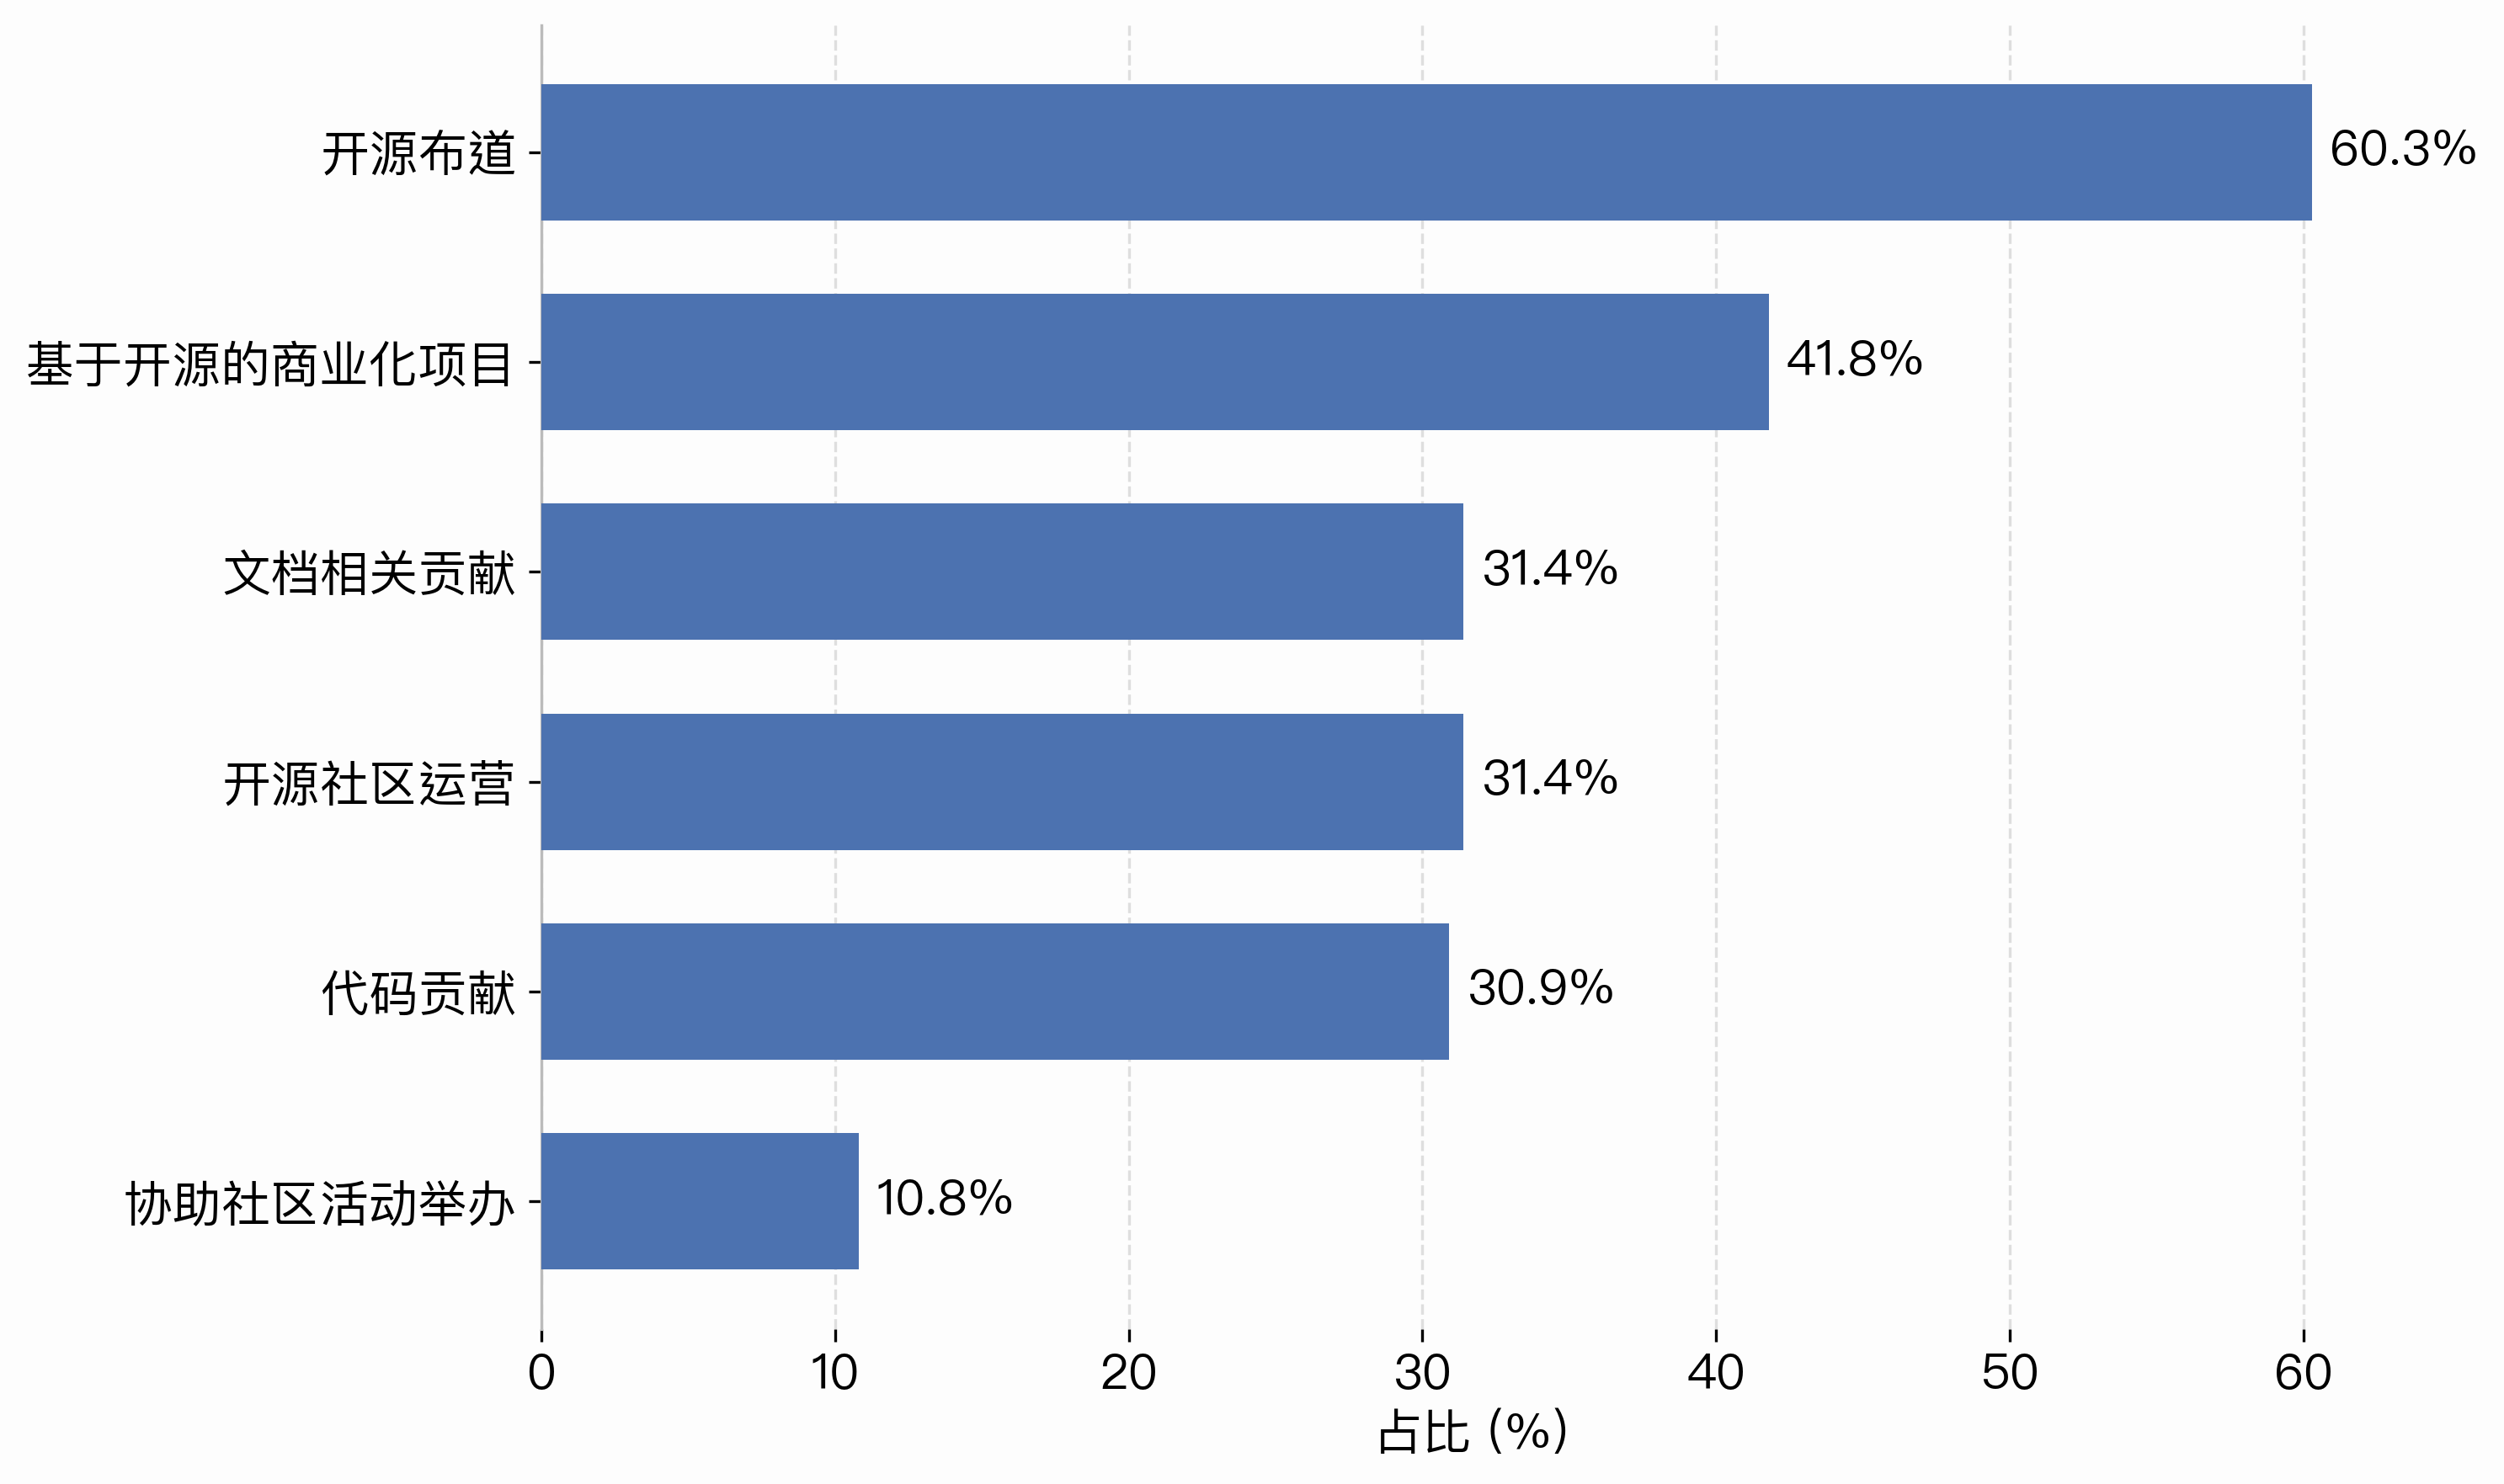
Figure 1-18 Main Types of Contribution
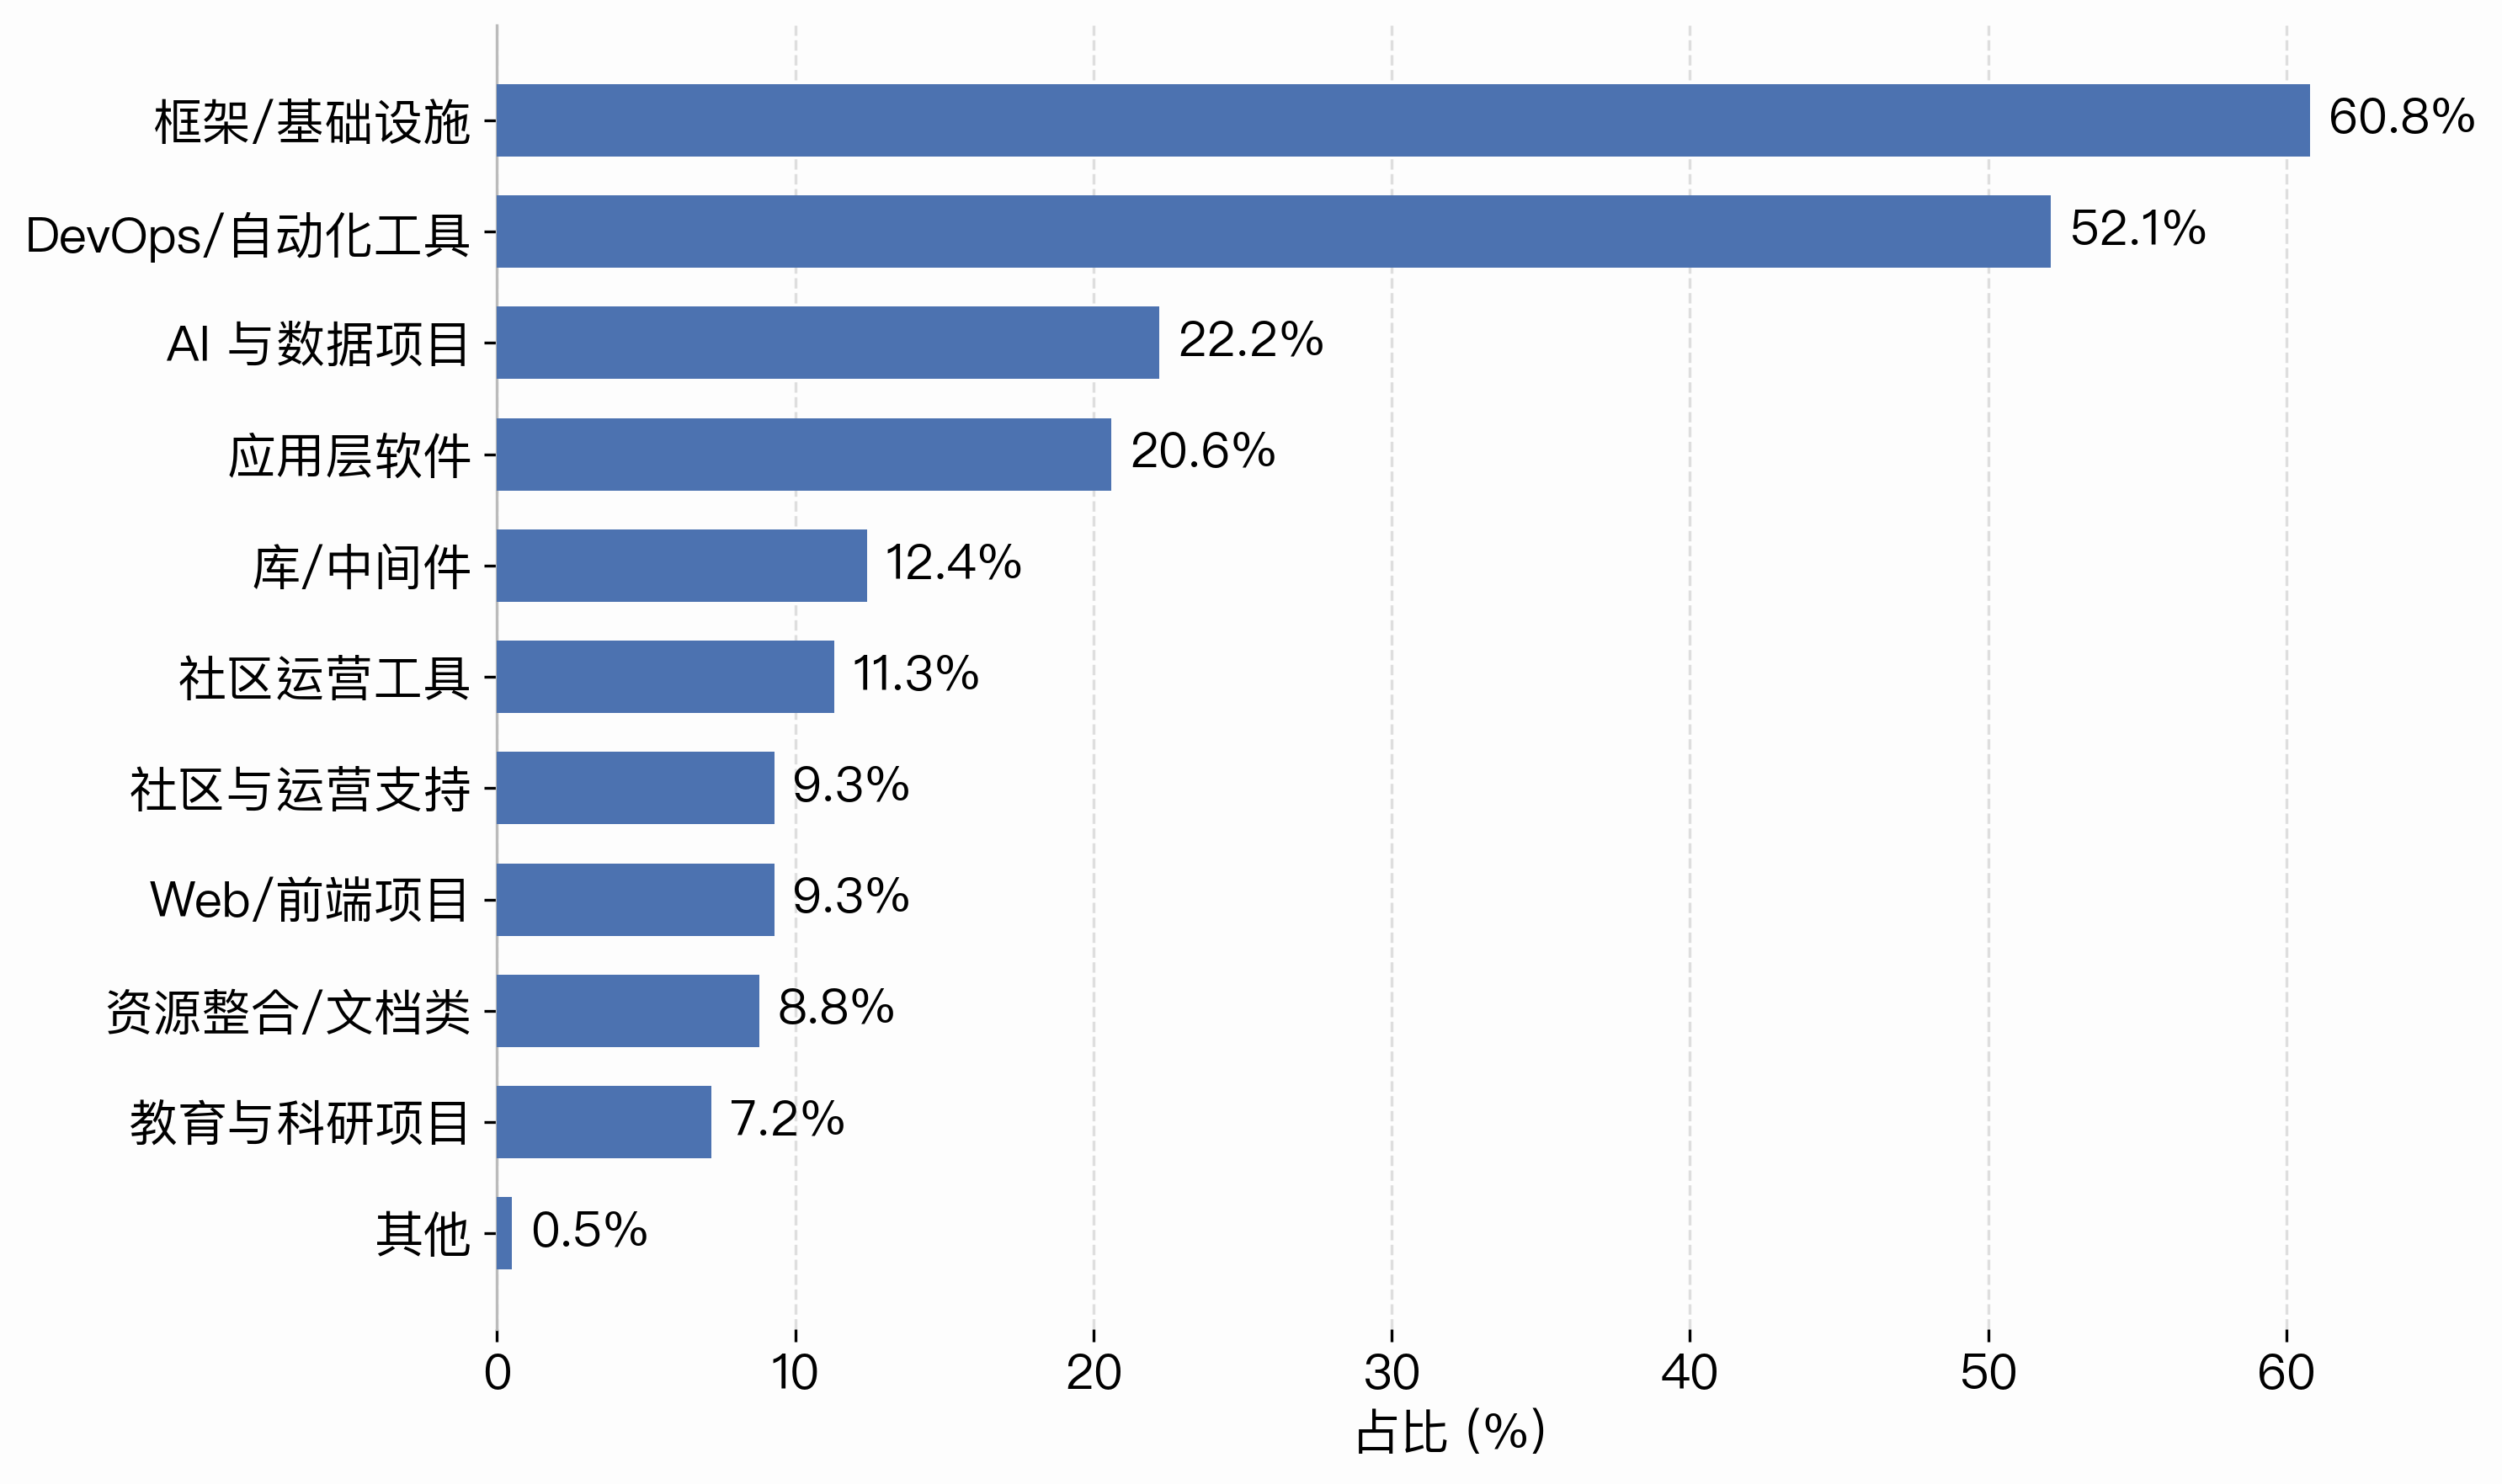
Figure 1-19 Types of Projects Where Respondents Contribute
Respondents contribute to open-source projects in a variety of ways. Open-source advocacy was the leading form, selected by over 60% — an indication that sharing practical experience, promoting projects, and creating content have become significant contribution paths. Commercial projects built on open source followed at just over 40%, with documentation and community operations each at around 30%. Direct code contributions were at a comparable level, while helping organize community events accounted for around 10%. Beyond the traditional work of writing code, contributions centered on operations, advocacy, and commercialization are becoming an equally essential part of the open-source ecosystem.
On the types of projects respondents contribute to, frameworks and infrastructure drew the highest participation at close to 60%, followed by DevOps and automation tools at around half. AI and data projects and application software also drew meaningful shares, in the range of 20% to 30%. Libraries and middleware, community operations tools, and educational and research projects together formed a long tail, indicating that contributions concentrate on foundational technologies while also extending to upper-layer applications and community support.
3.3.4 Incentive Mechanism
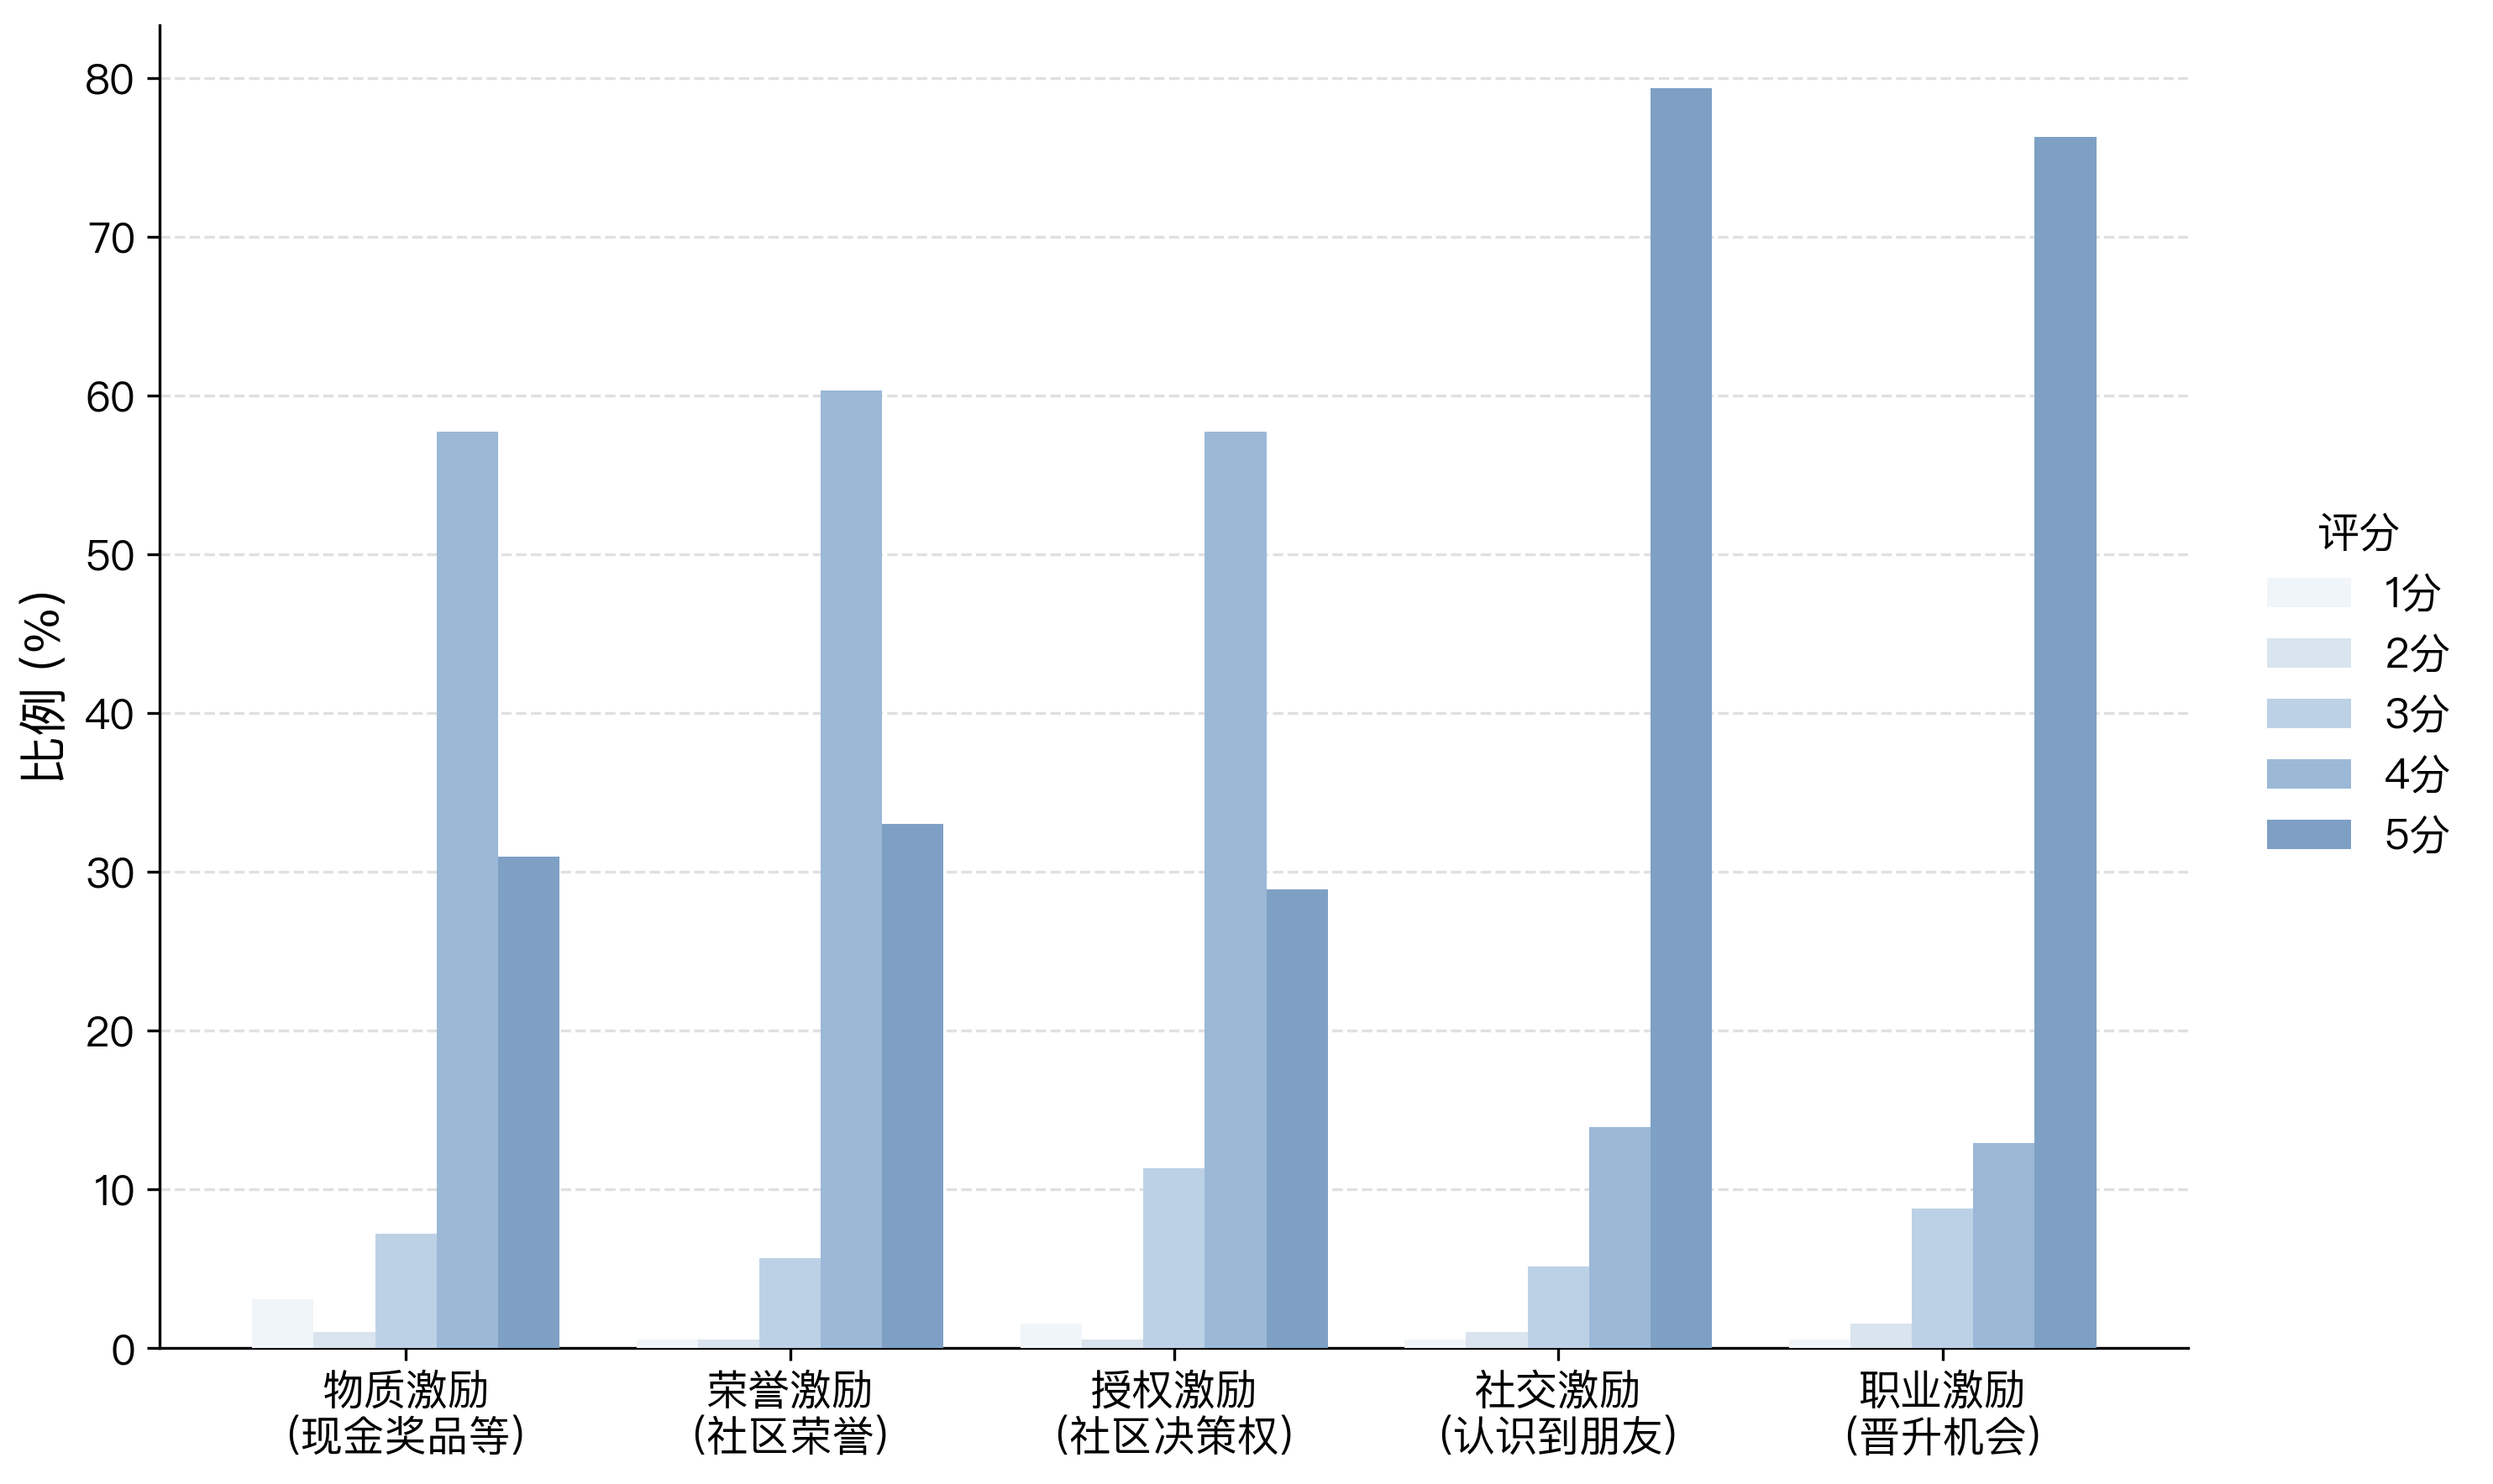
Figure 1-20 Incentives
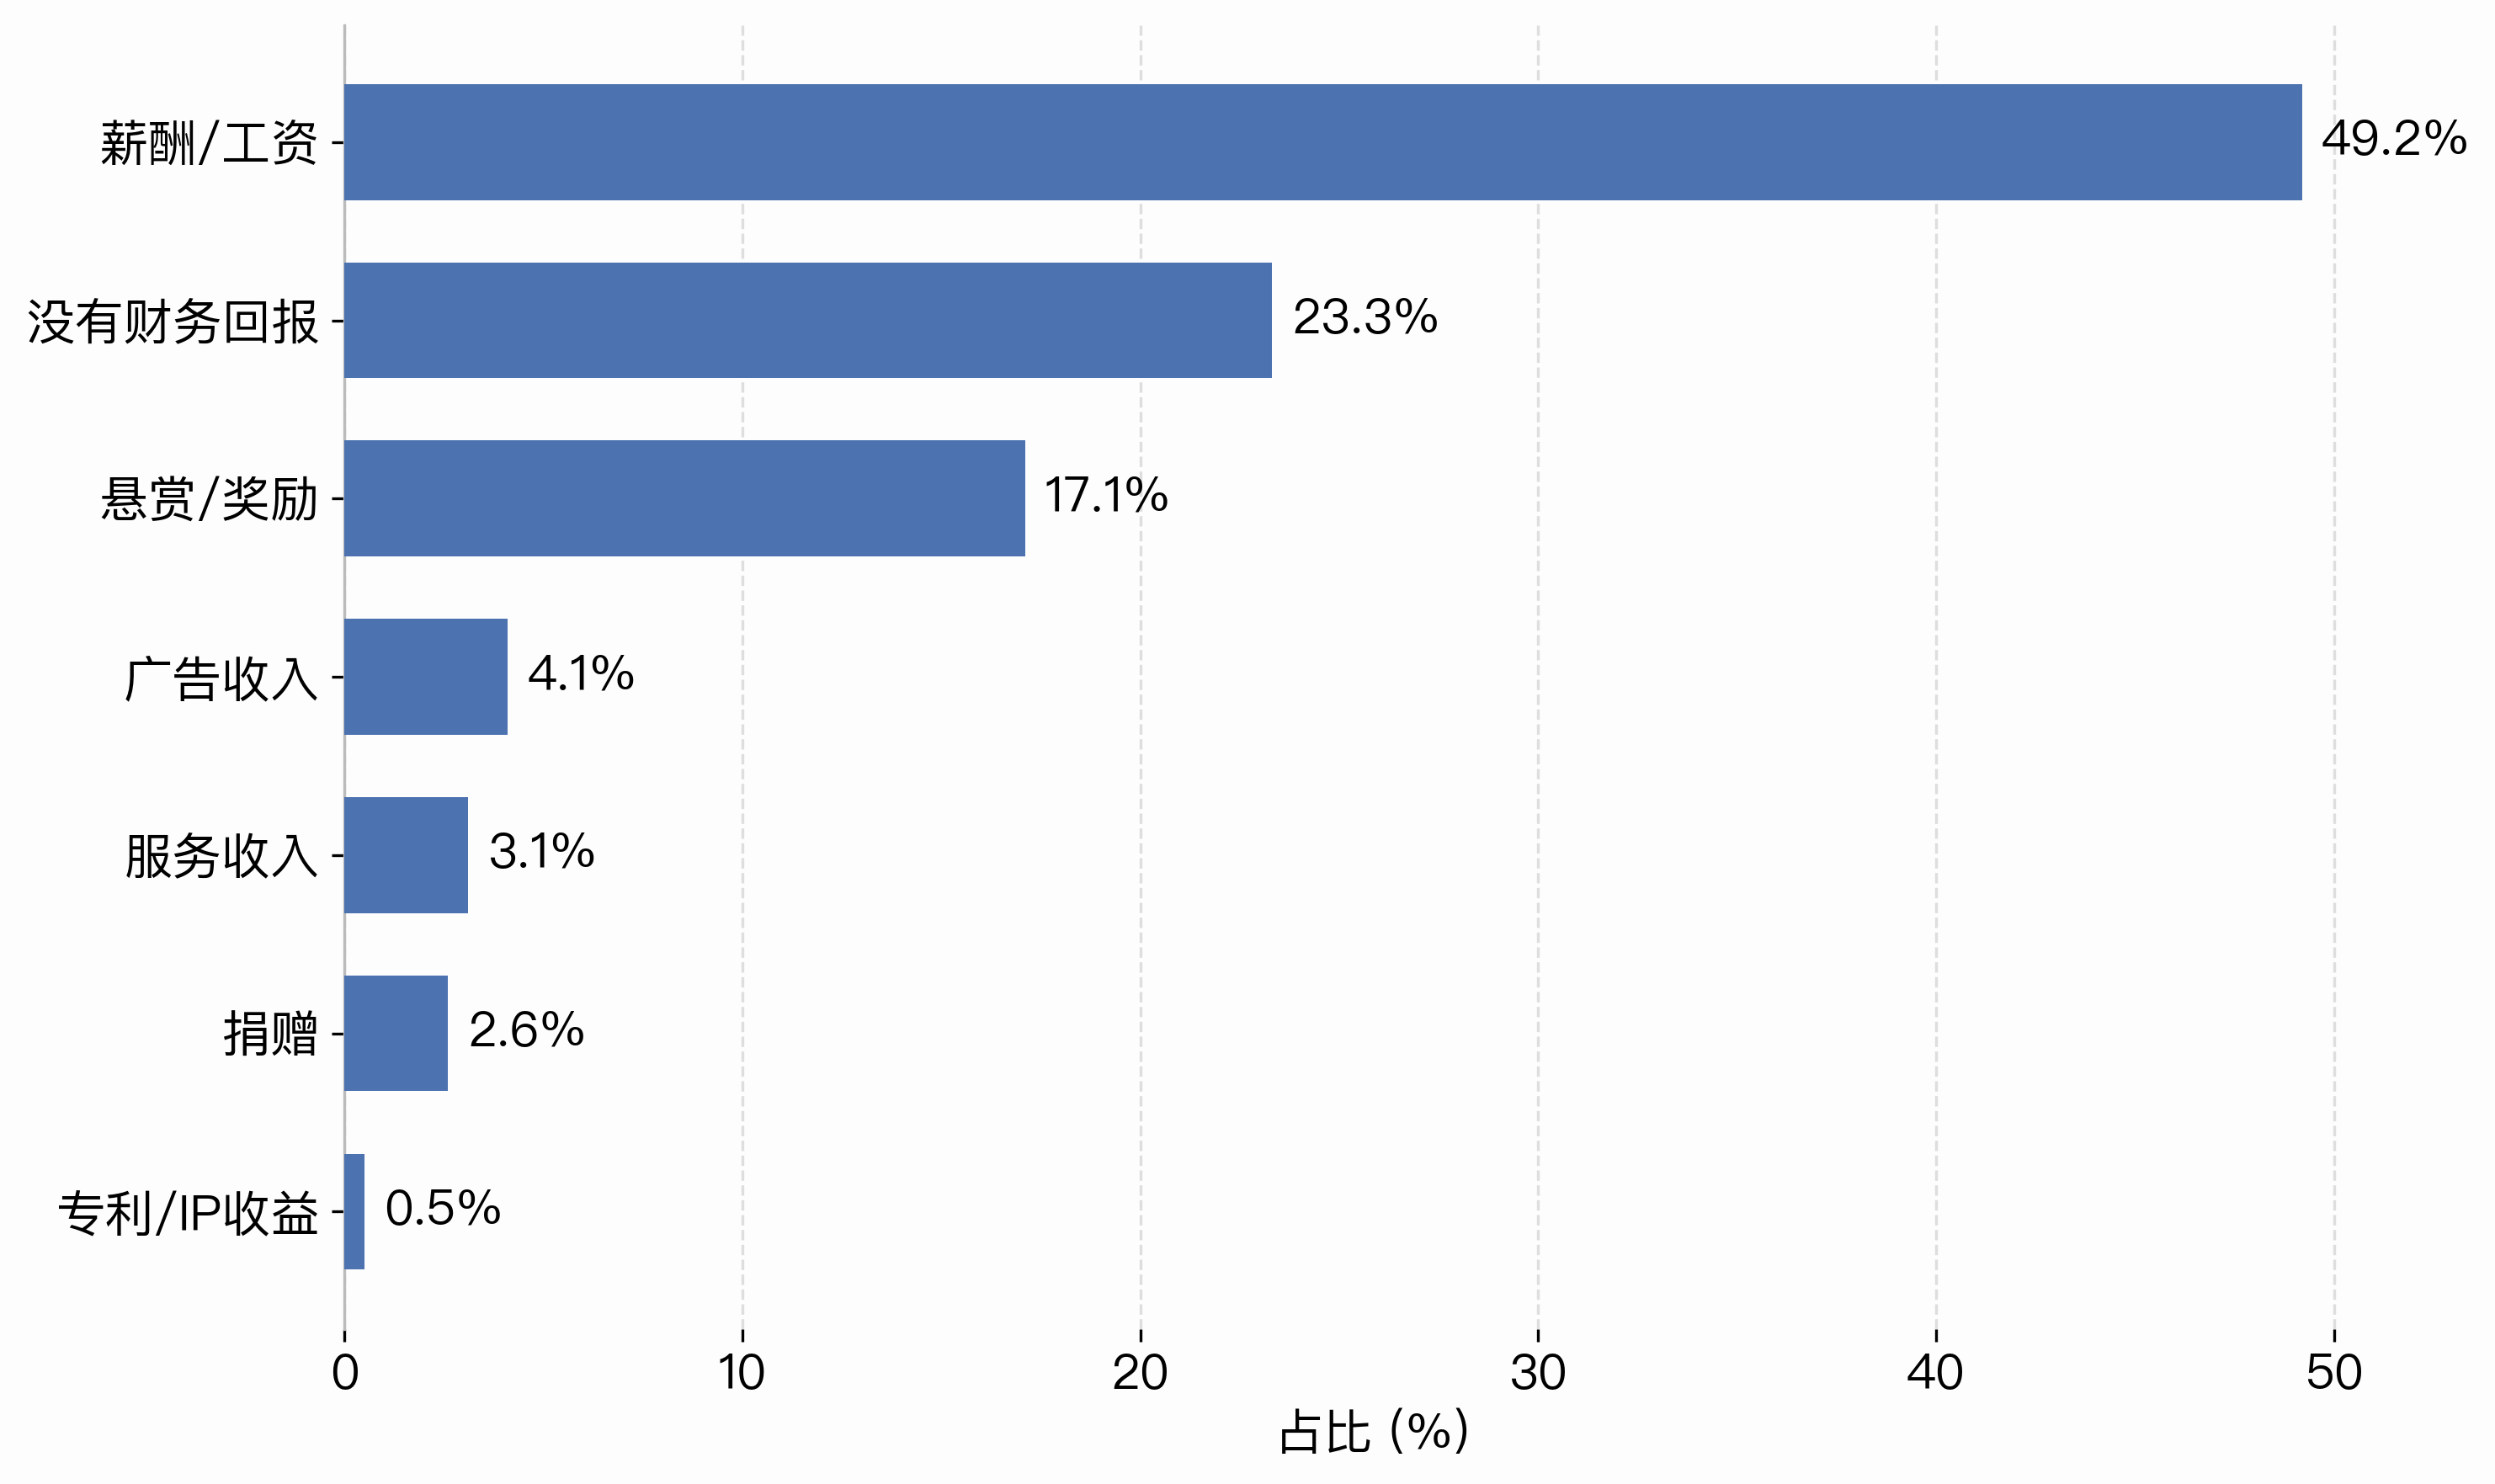
Figure 1-21 Sources of Financial Return
On how strongly different incentives influence contribution, social and career incentives received the highest ratings: most respondents scored these two at 4 or 5, indicating that meeting peers in the community and gaining better career opportunities are important drivers of sustained participation in open source. Material incentives, recognition, and empowerment also rated well overall, though somewhat below the first two. Taken together, incentives in open-source communities operate along multiple dimensions, with non-financial ones — growth, recognition, social connection, and career development — proving especially important in prompting people to contribute.
On financial returns from open-source projects, salary or wages was the leading direct source; the second most common response, however, was no financial return at all, followed by bounties or rewards. Advertising revenue, service revenue, and donations each accounted for single-digit shares. While some developers earn income through open-source work in their jobs, a substantial share of participation is still driven by genuine interest, learning, and a sense of belonging to the community.
3.4 Community Operations
The questions in this section are addressed to respondents whose role in the open-source community is that of operator. This section explores their views on operating open-source communities, including community management, event organizing, and communication mechanisms, in order to understand what works, where there is room for improvement, and what might help raise both operational efficiency and member satisfaction.
3.4.1 Overview of Respondents’ Open-Source Communities
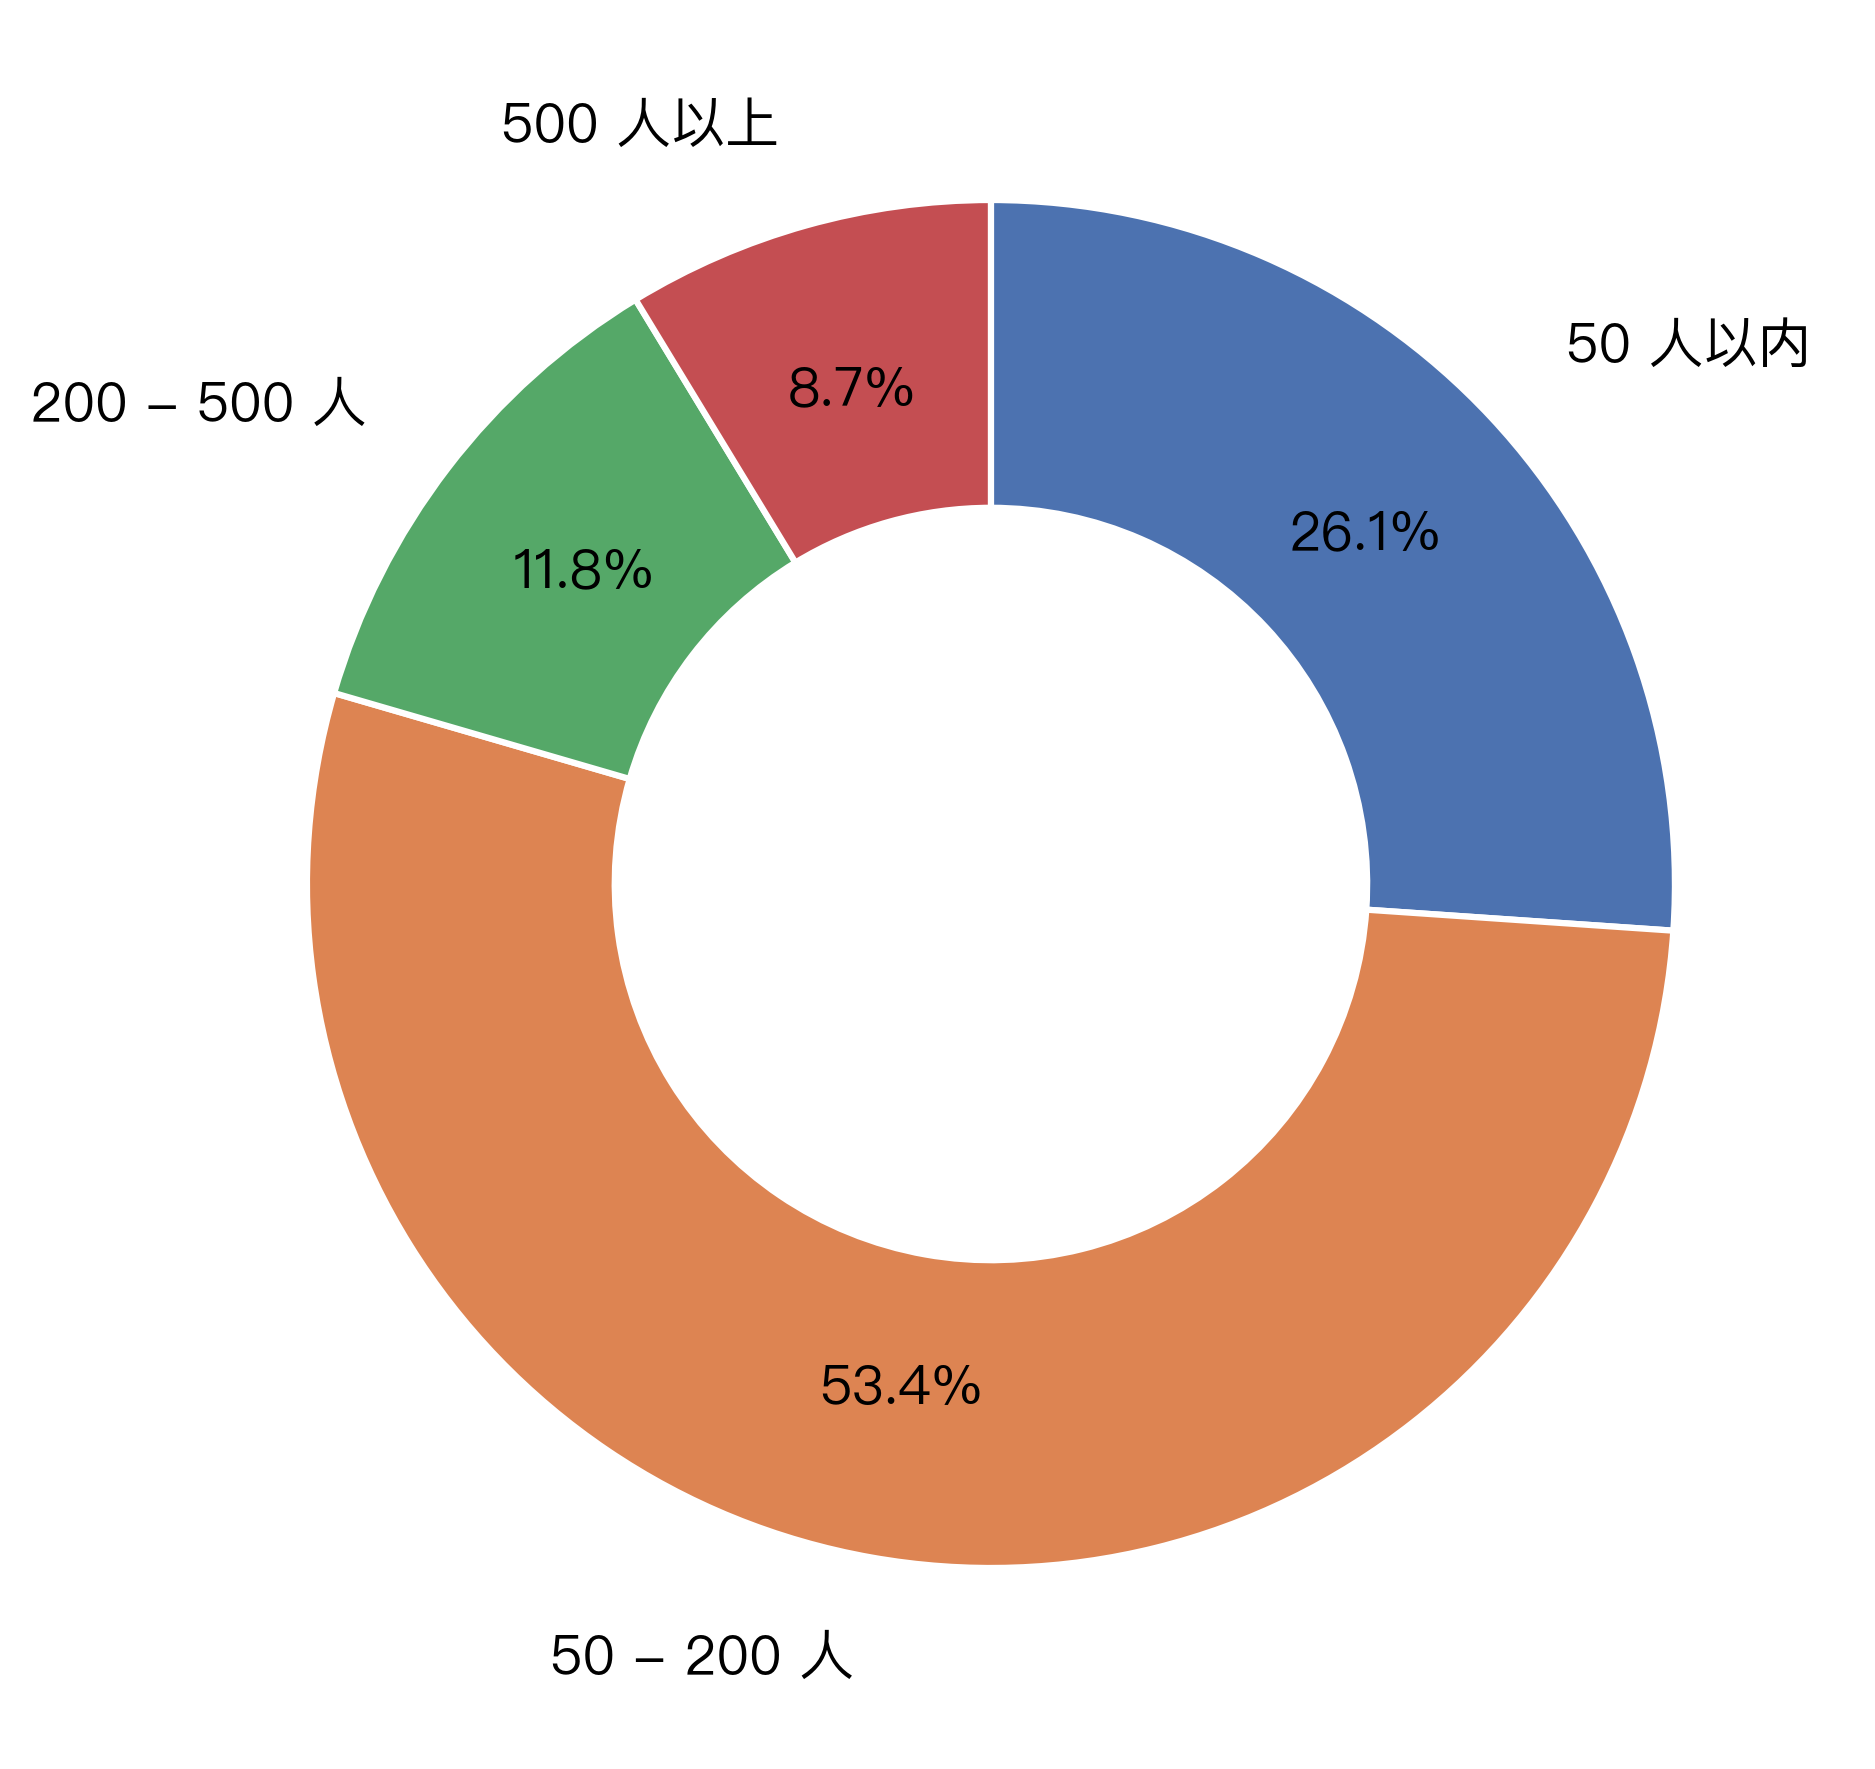
Figure 1-22 Number of community users
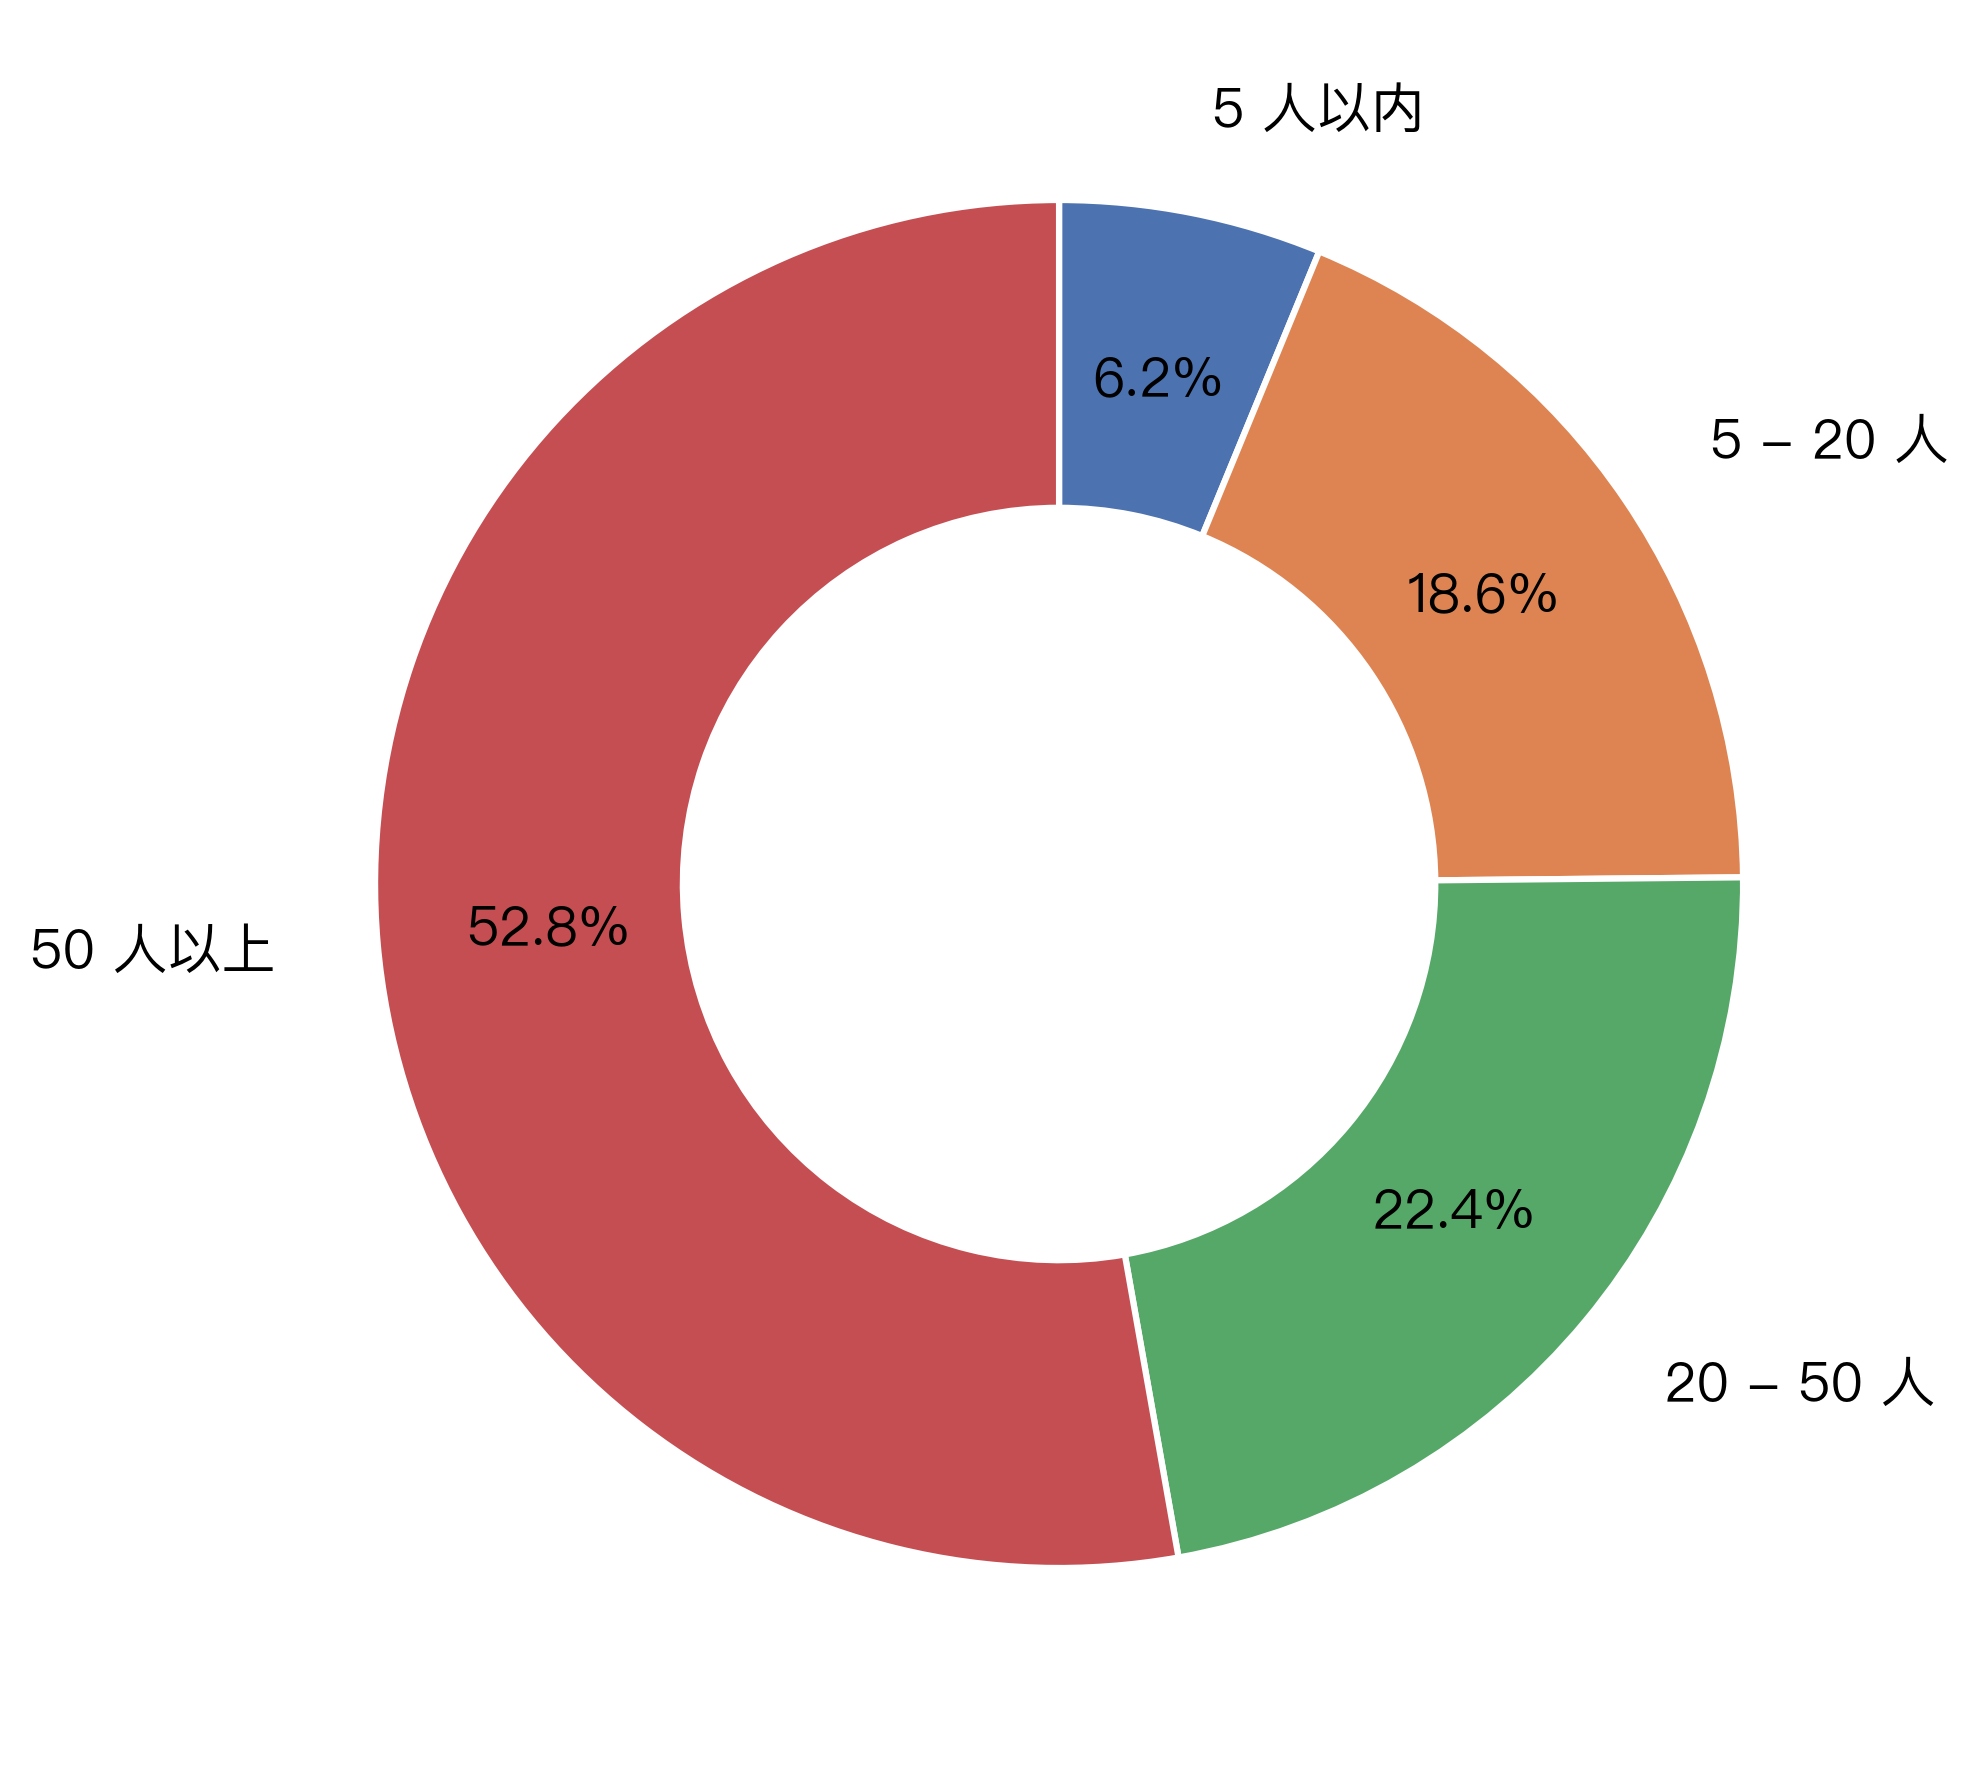
Figure 1-23 Active Developers
By size of active user base, medium-sized communities of 50–200 people were the most common, with more than half of operators reporting communities in this range. Small communities of under 50 accounted for about a quarter, while larger communities of 200–500 and those above 500 together came to less than 30%. Overall, the open-source communities in this sample remain predominantly small to medium-sized, with participants ranging from a few dozen to a few hundred, and extremely large communities relatively rare.
In terms of active developers, communities with more than 50 members accounted for around half, followed by the 20–50 and 5–20 brackets, which together made up just over 40%. Communities with fewer than five active developers were a small minority. This suggests that while user bases are mostly small to medium-sized, many projects have built up a substantial body of active developers, providing enough technical capacity to sustain continued development of the communities.
3.4.2 Management of Open-Source Communities
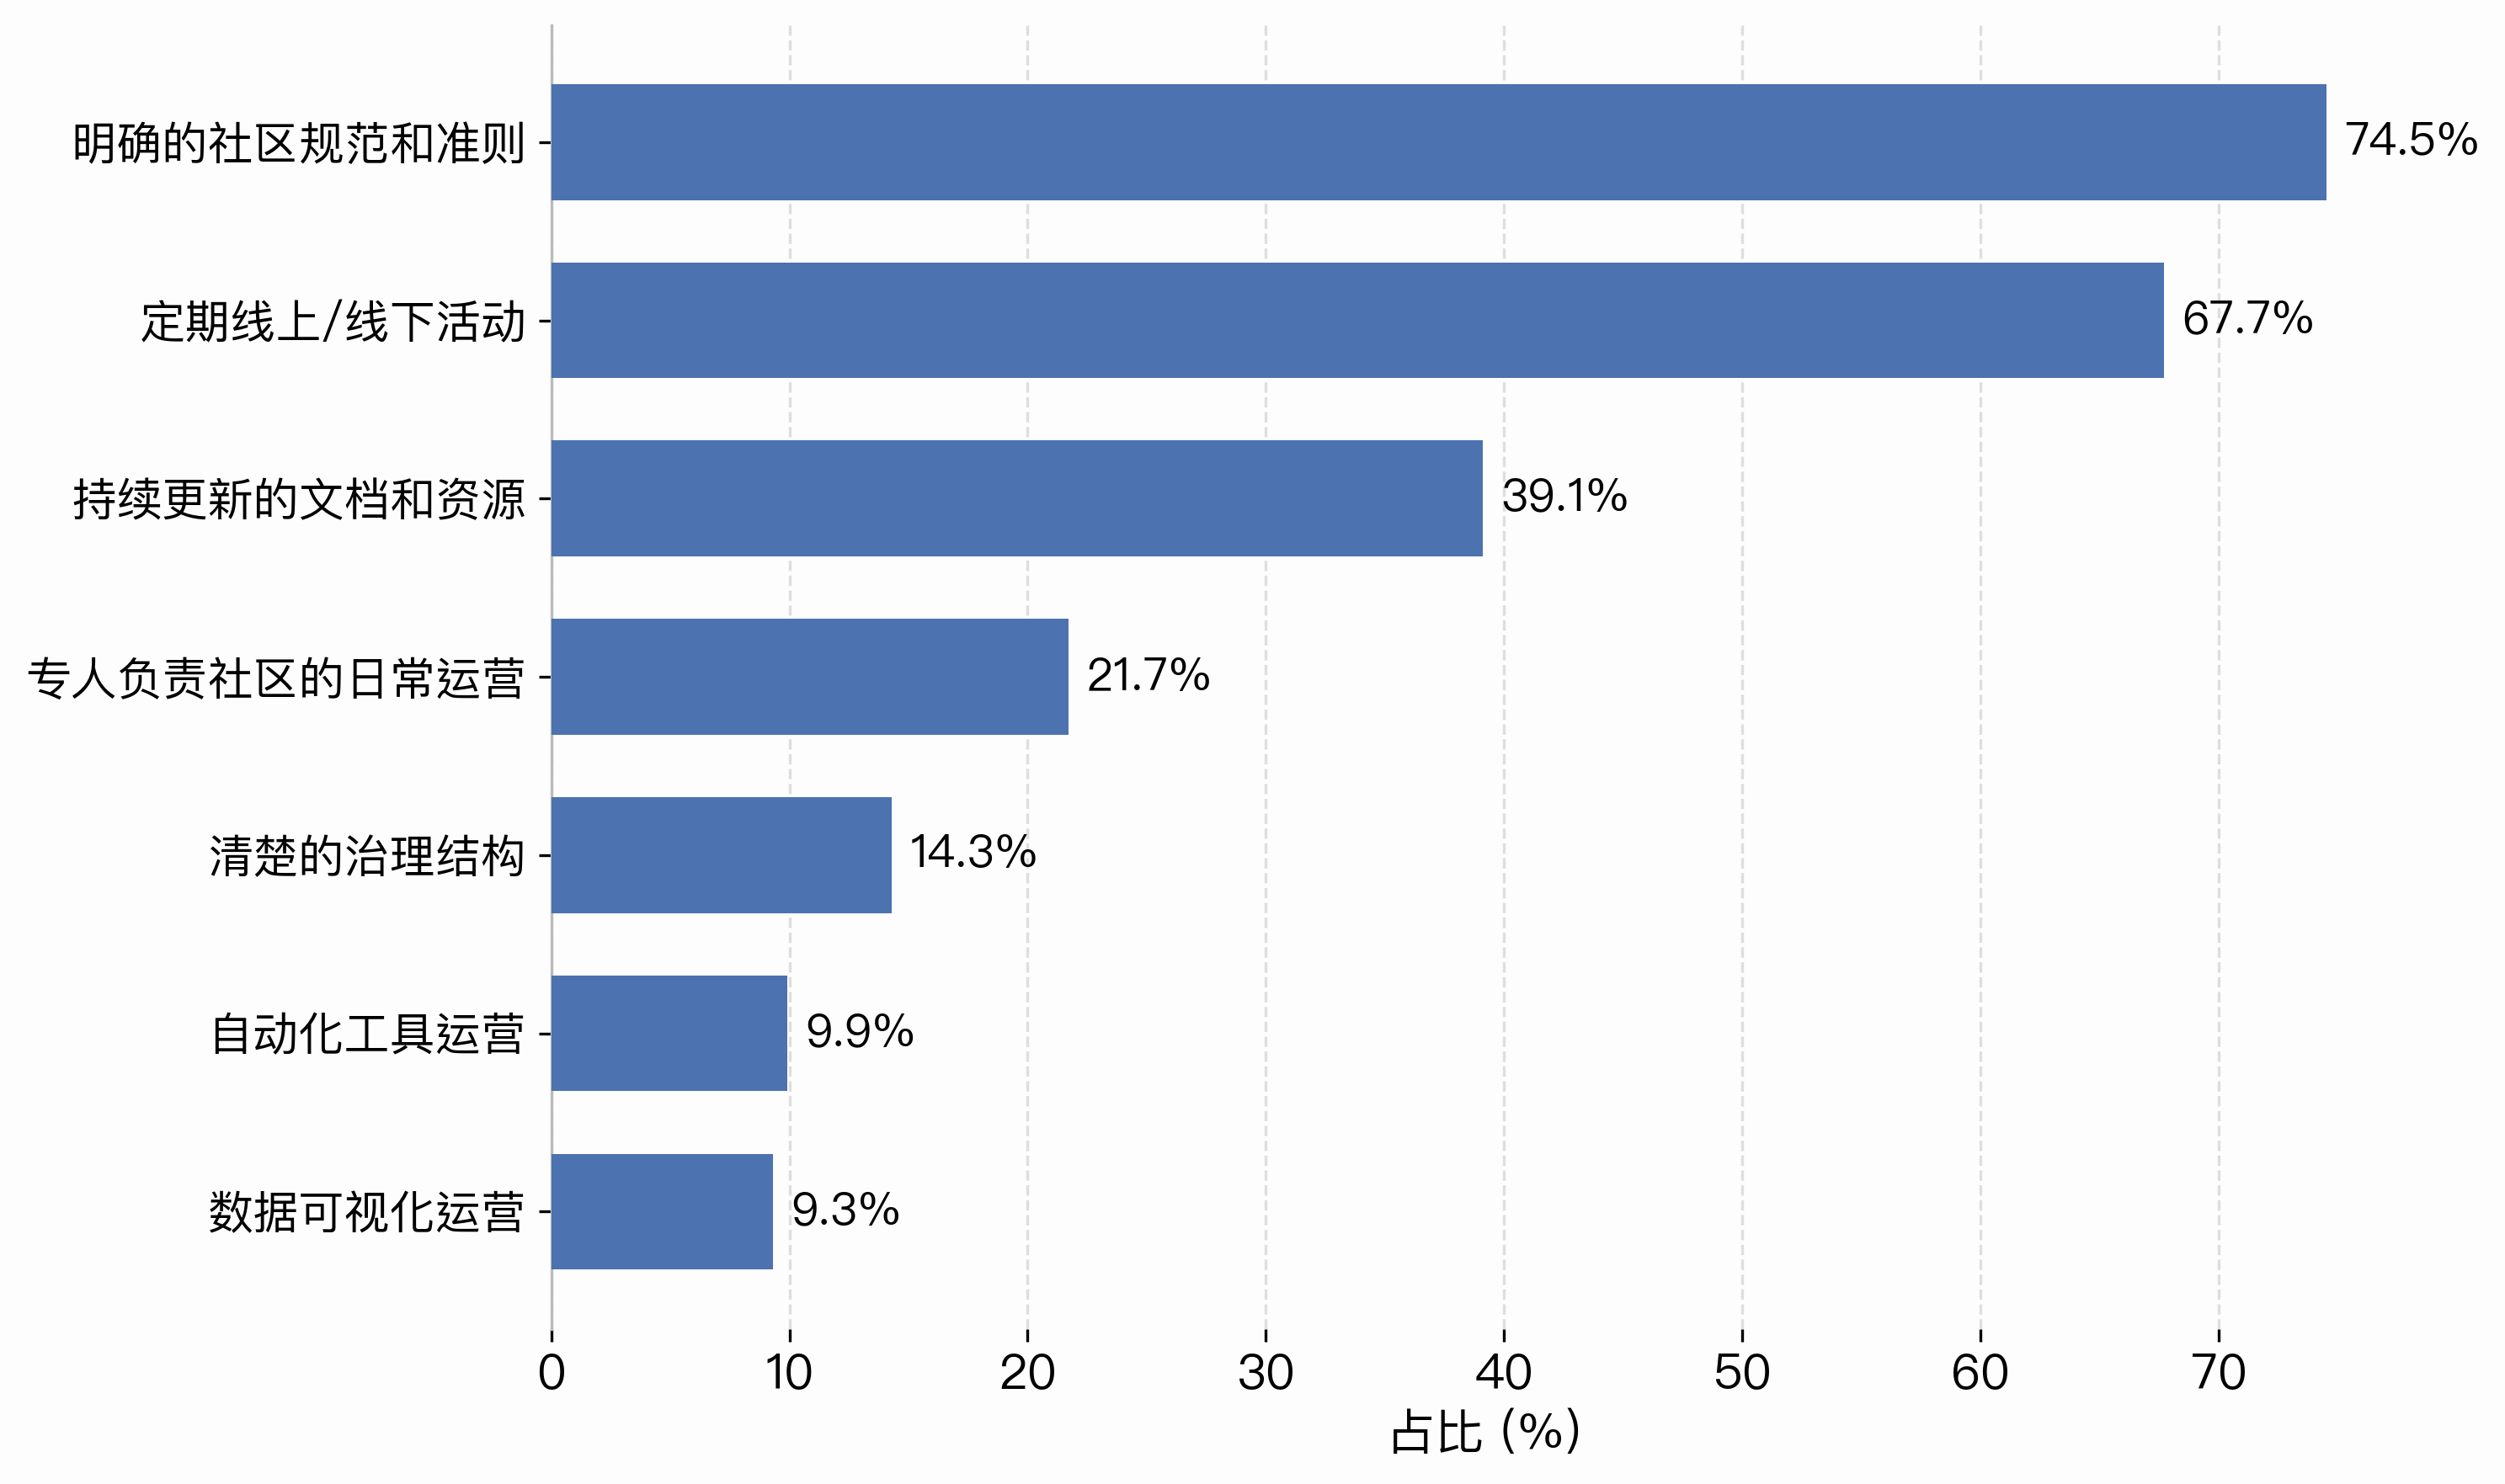
Figure 1-24 Community Management Status
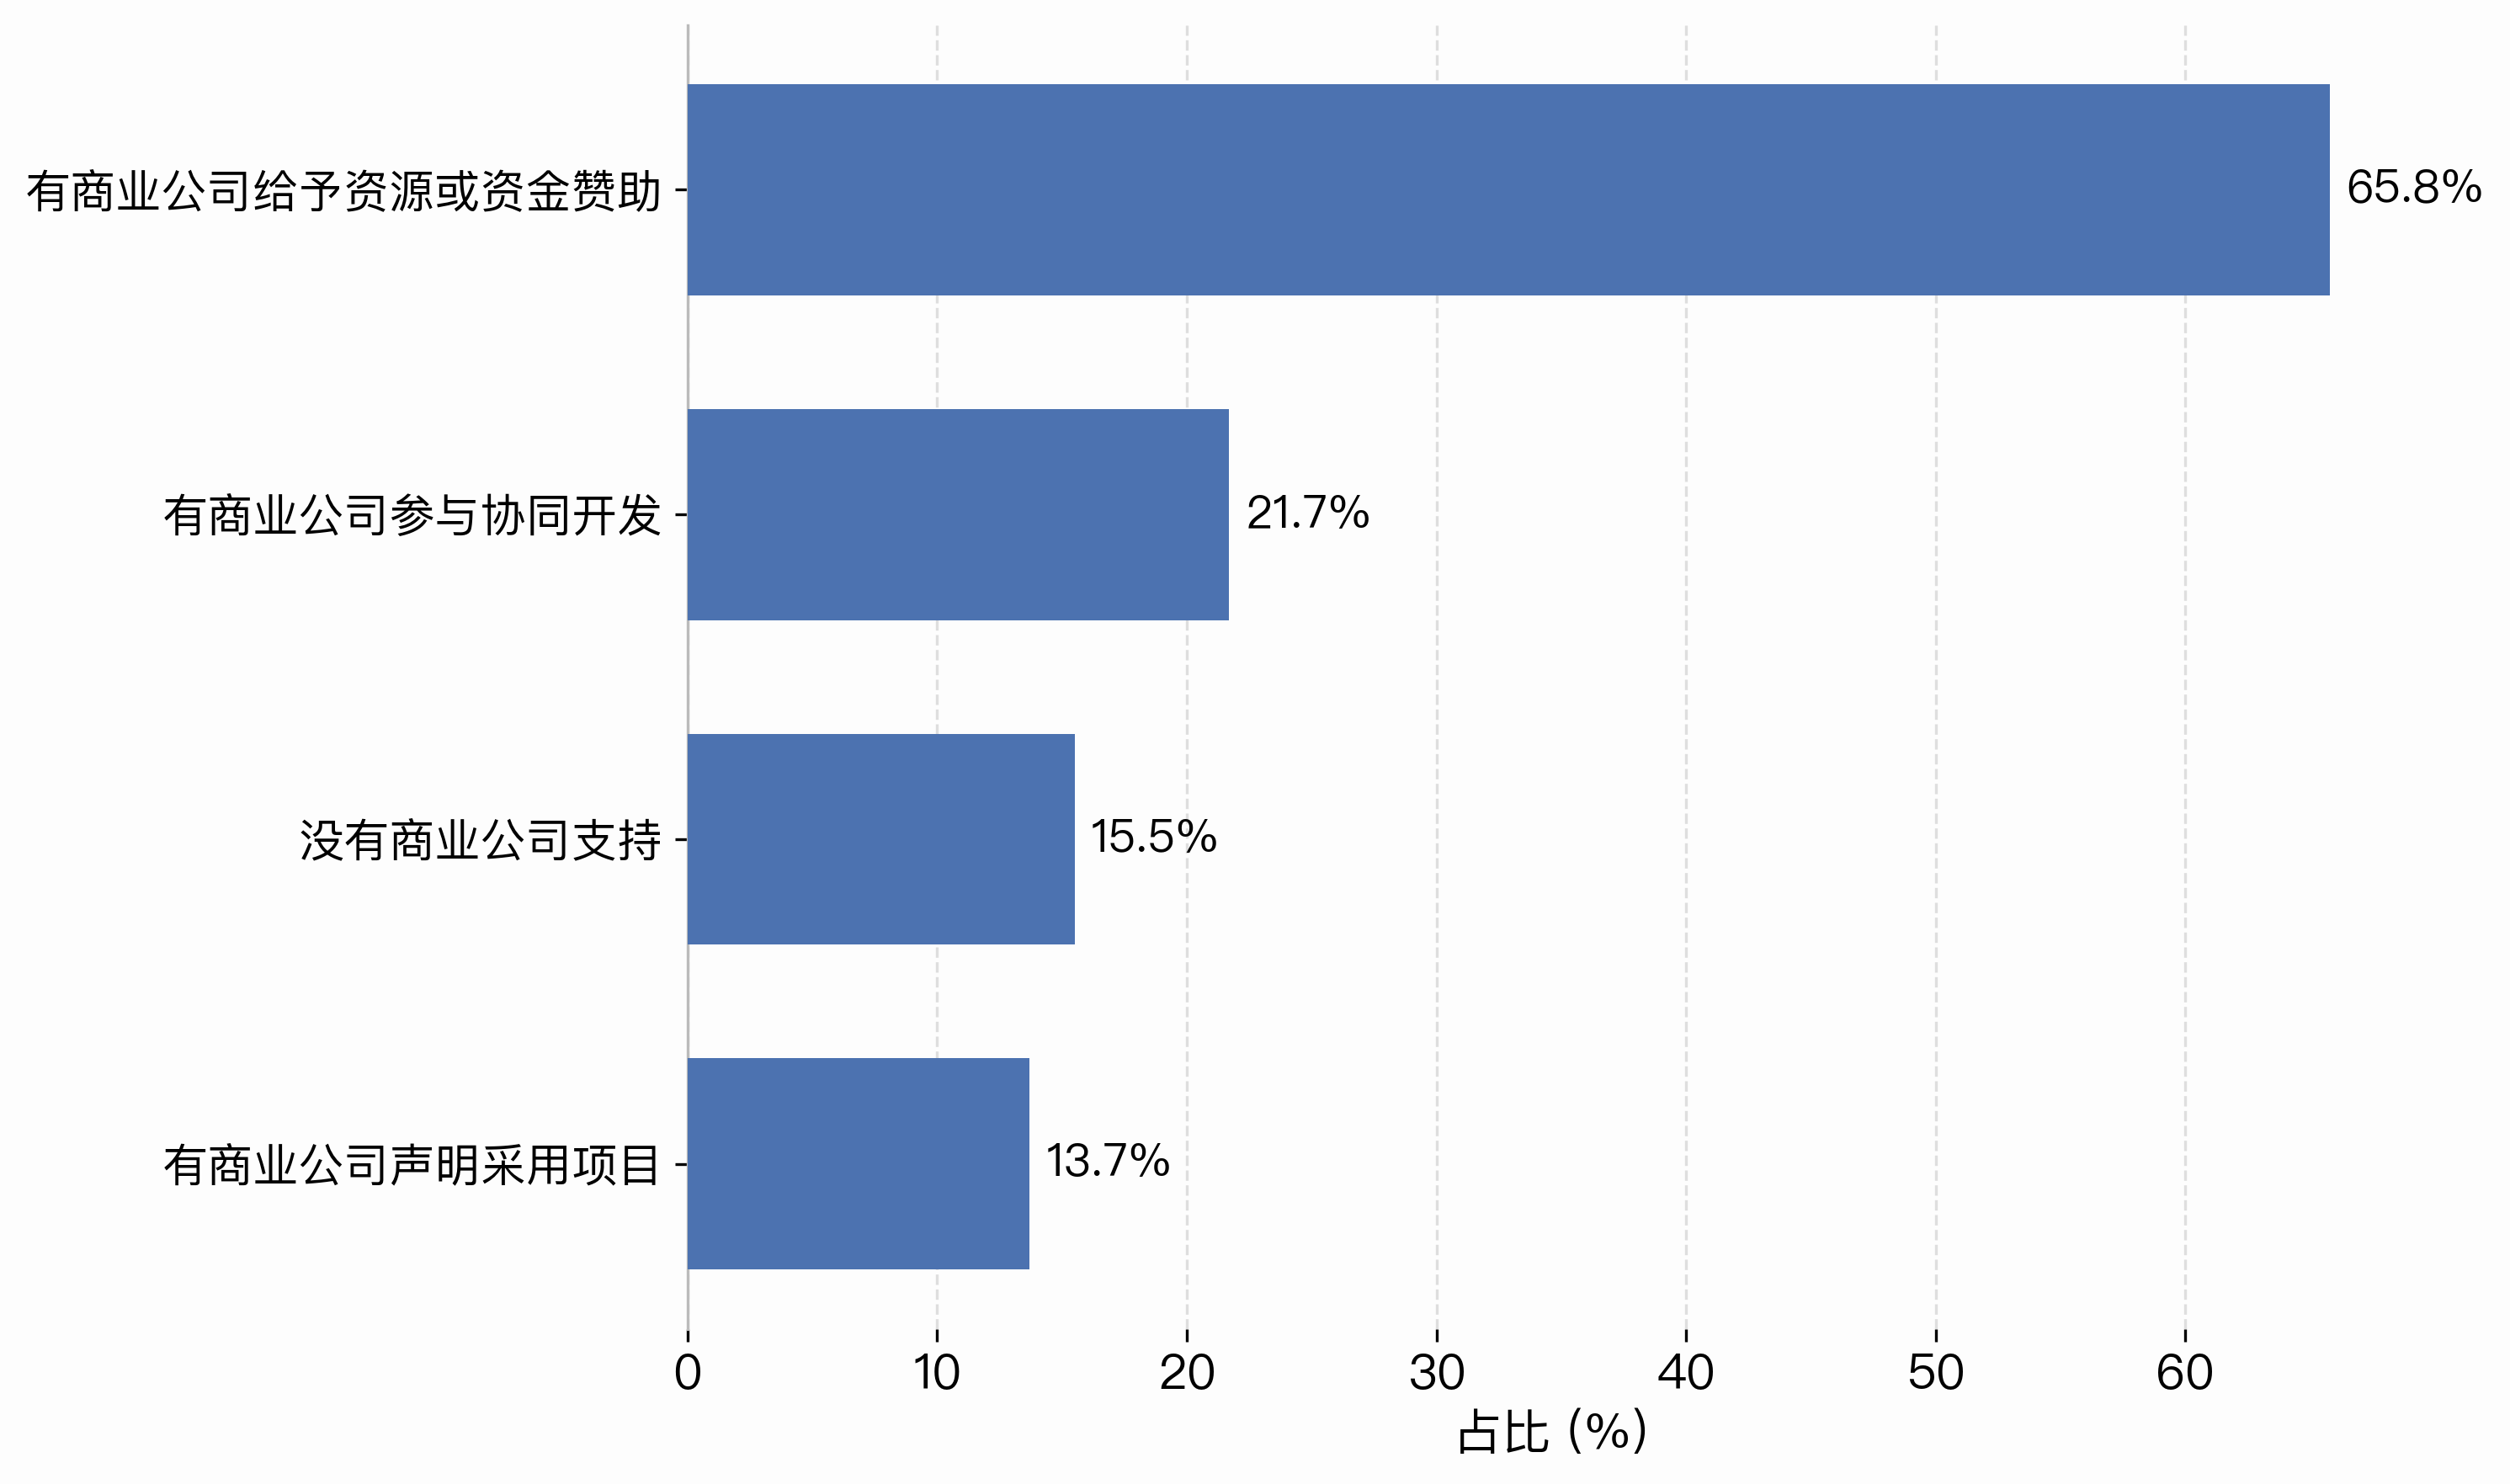
Figure 1-25 Commercial Support for Communities
On community management, most respondents reported that their communities already have a reasonably clear governance structure, with designated staff responsible for day-to-day operations, and that they take the drafting of community norms and guidelines seriously. To help new members find their footing, many communities keep documentation and resources up to date and hold events both online and offline on a regular basis. A smaller number have begun experimenting with automation and data visualization tools to support their operations. The overall picture is one of reasonably mature basic governance alongside a growing use of tooling in community operations.
On support from commercial companies, sponsorship in the form of resources or funding was the most common way, cited by more than half. In comparison, participation by commercial companies in joint development, and public statements by companies that they had adopted a project, were less common, at around 20% and below respectively. A number of communities reported no commercial support at all — a reminder that the connection between the commercial ecosystem and open-source communities has yet to be fully established.
3.4.3 Commercialization of Open-Source Software
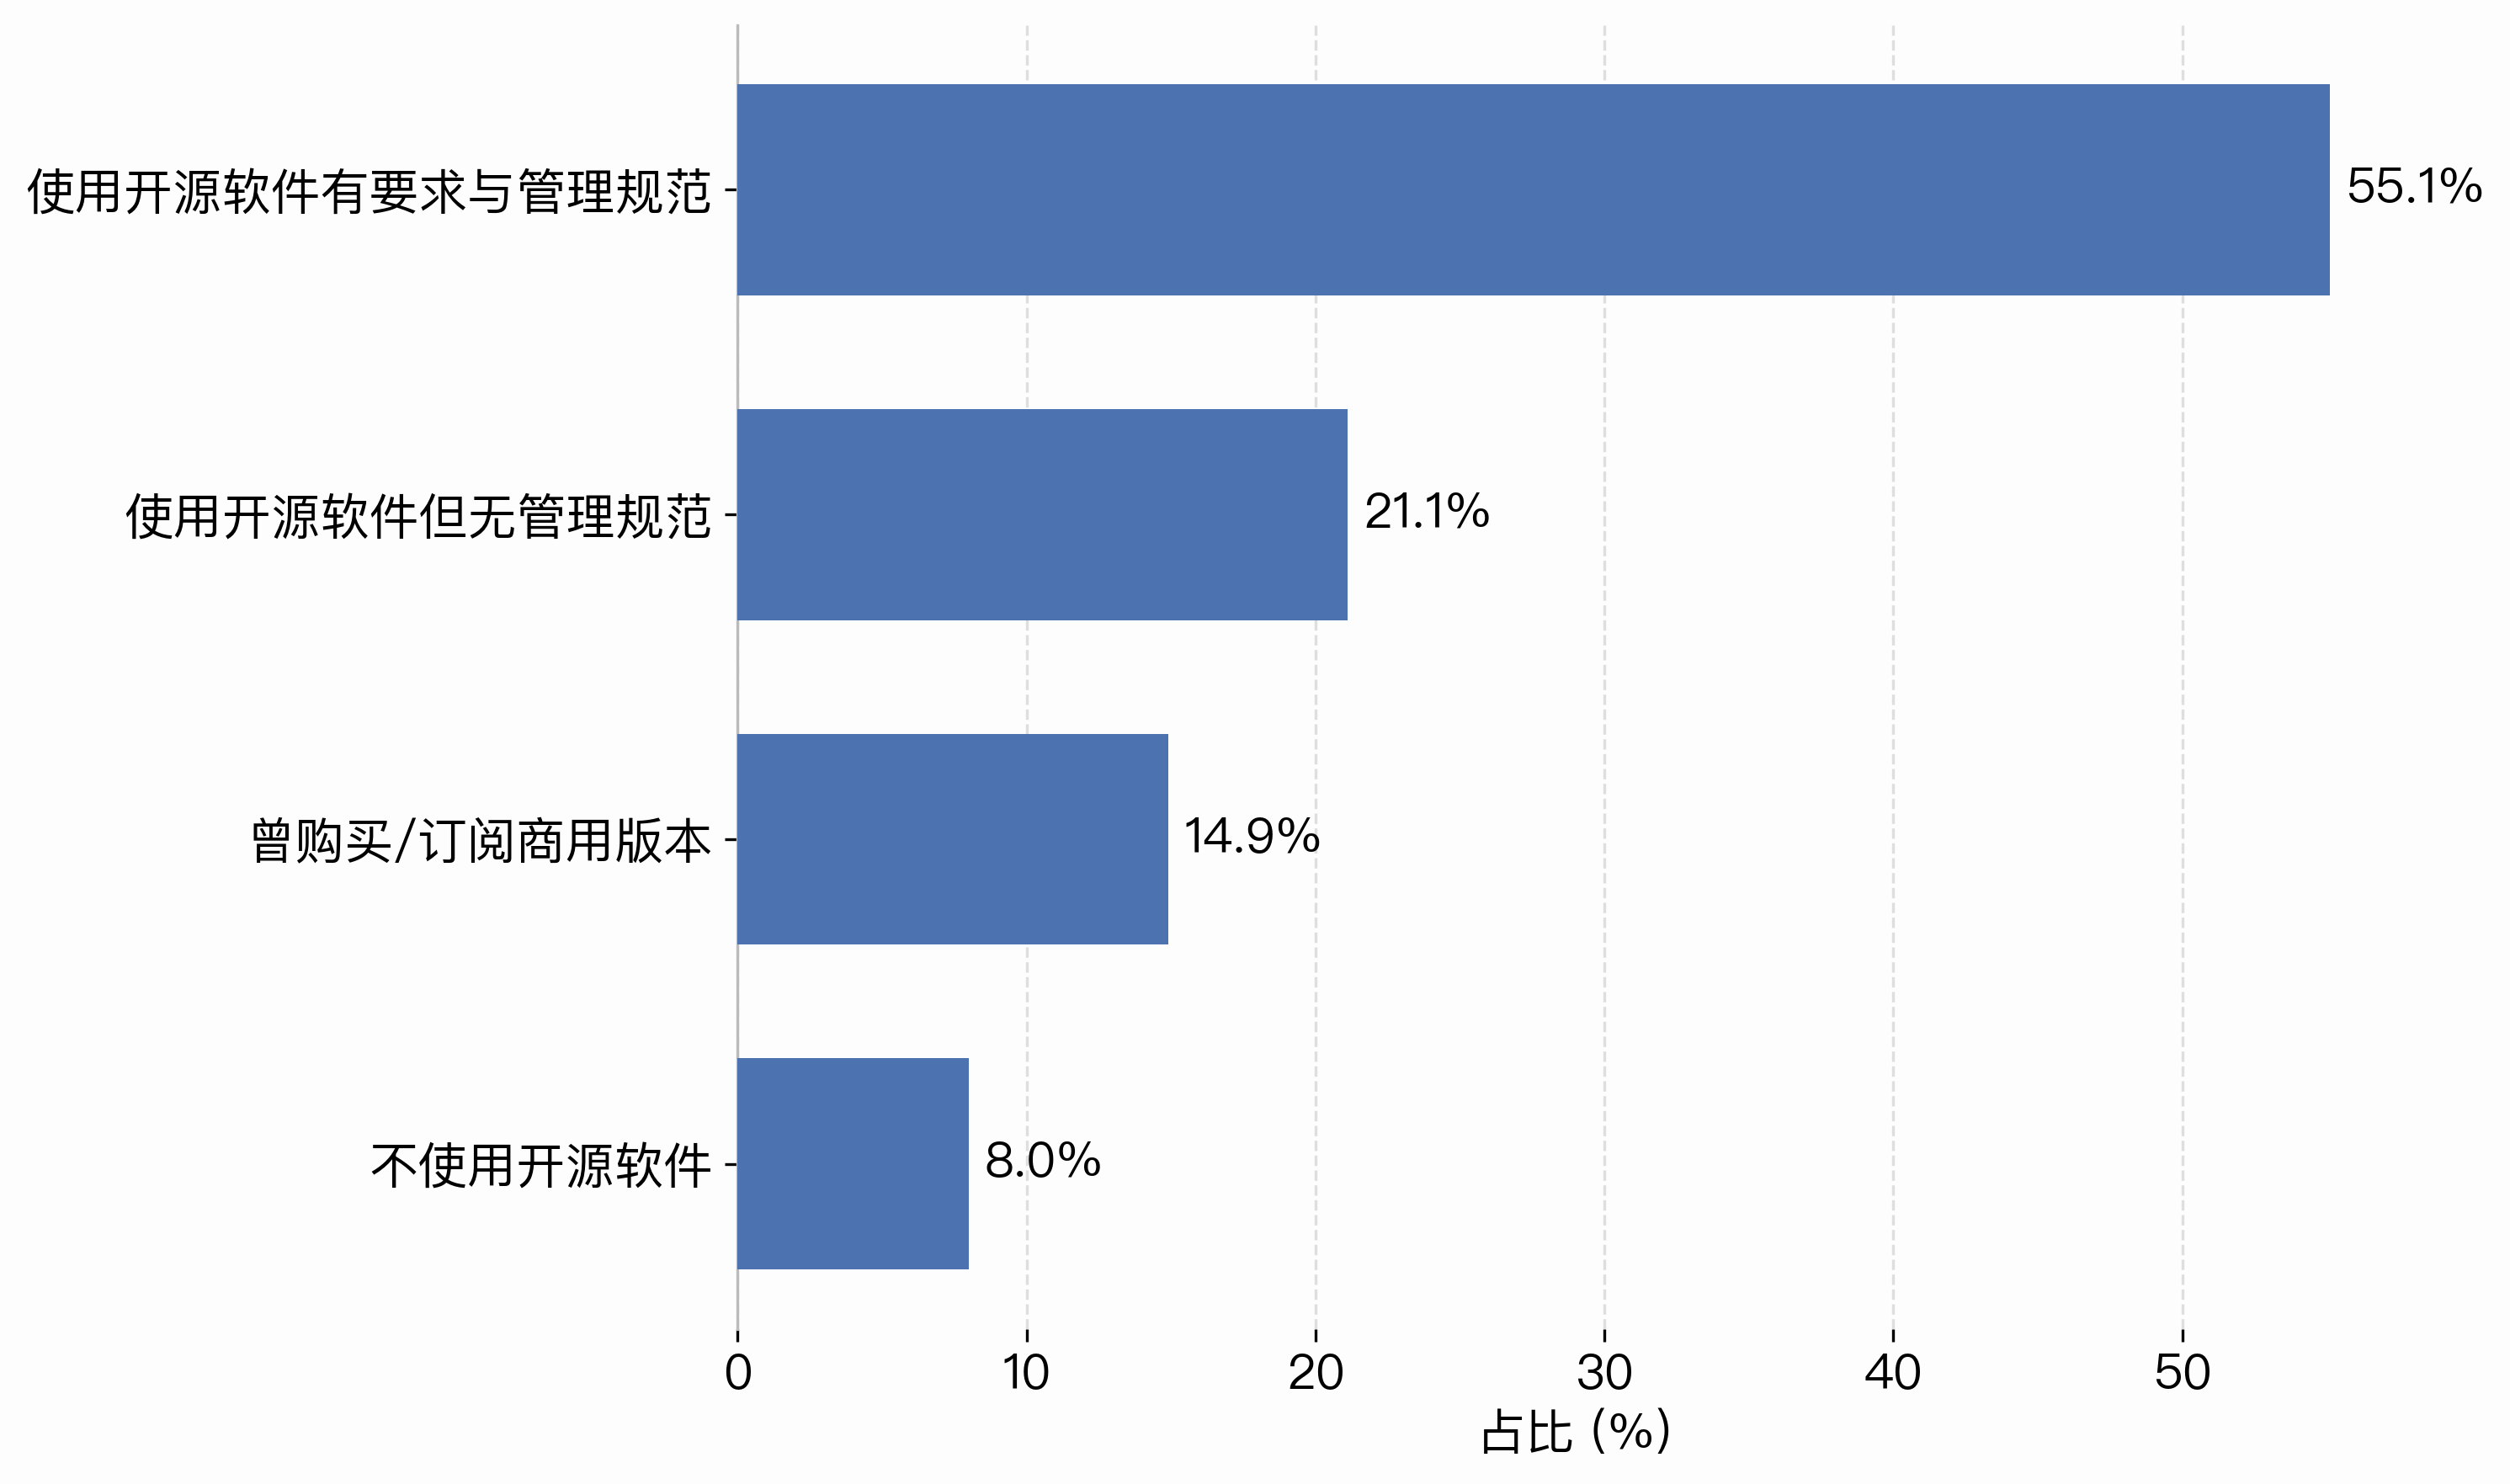
Figure 1-26 Organizational Use of Open-Source Software
At the organizational level, more than three-quarters of respondents said their organizations use open-source software. The largest group, at close to 60%, reported using open-source software under formal requirements and management policies. Roughly 20% used it without any governance policy in place, while a slightly smaller share had purchased or subscribed to commercial editions. Fewer than 10% reported not using open-source software at all. This suggests that open source has taken root in most organizations, though around a fifth still lack established open-source governance policies, leaving room for more systematic management.
3.5 The Future Development of Open Source
This section summarizes respondents’ views on and suggestions for the future development of open-source communities, covering technology trends, directions for community growth, and potential opportunities for collaboration, with the aim of offering insight into long-term development and strategic planning for open source communities.
3.5.1 Trends in Open-Source Development
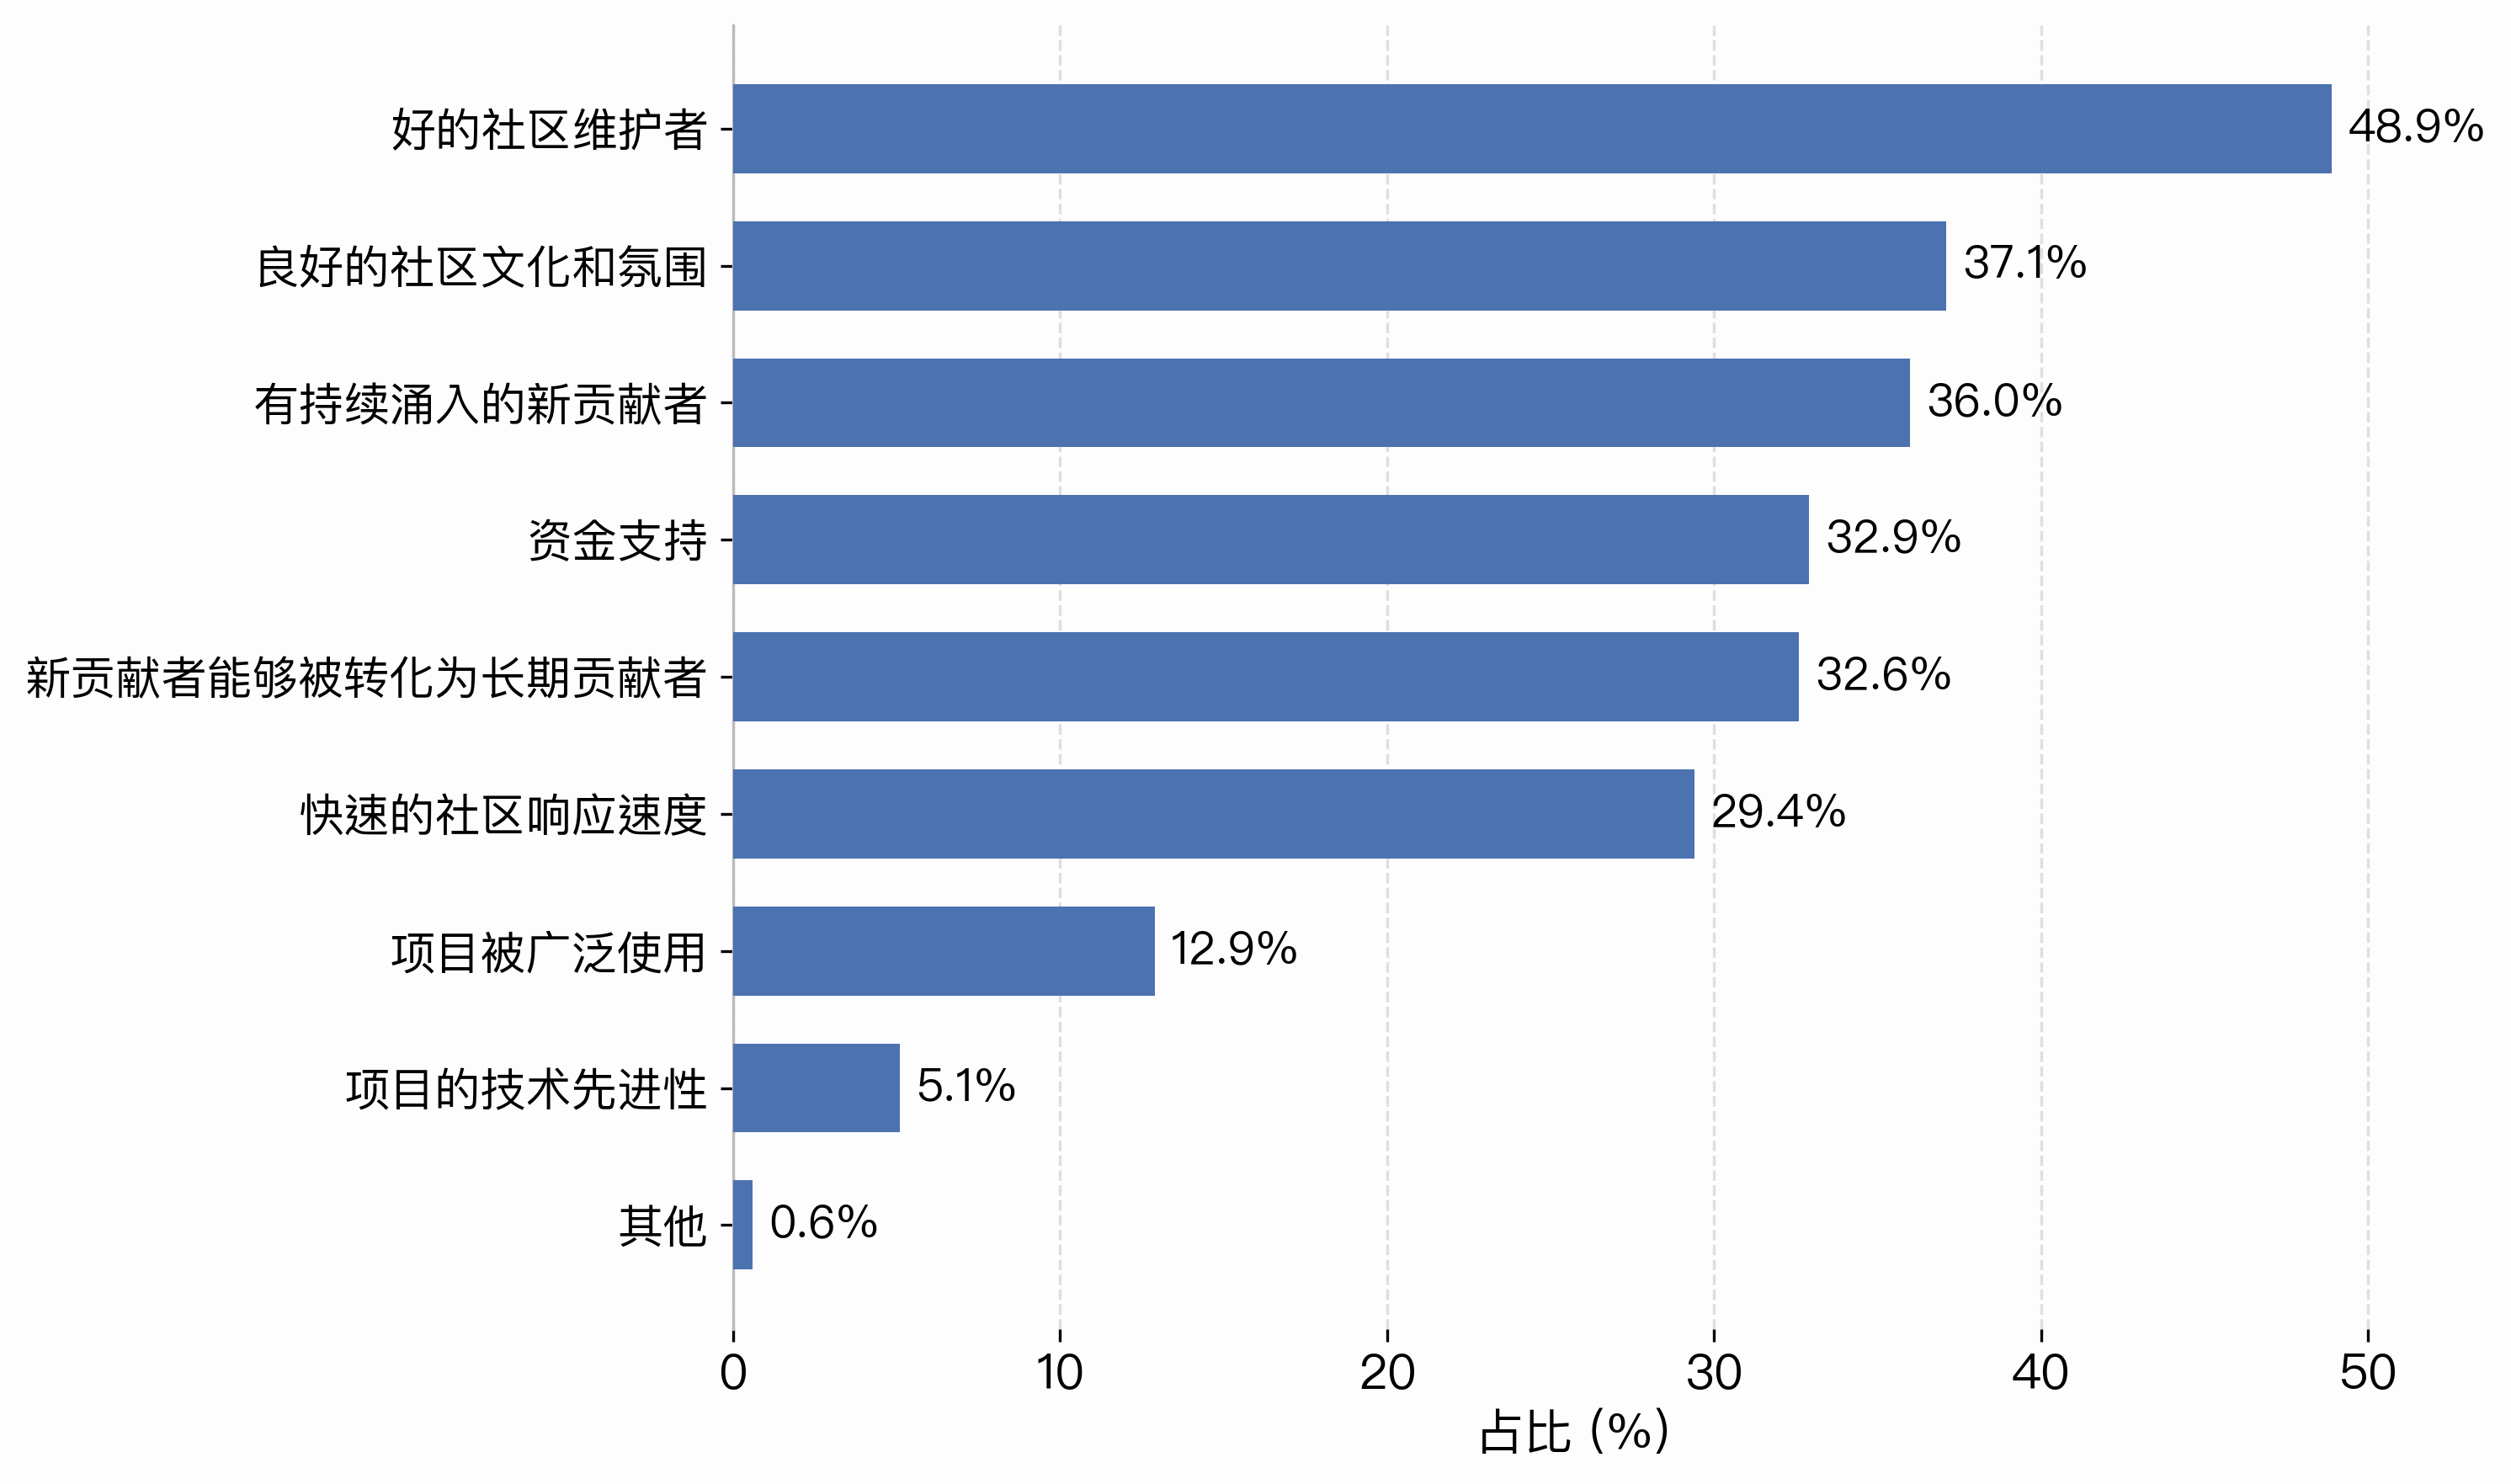
Figure 1-27 Characteristics of Sustainable Development for Open-Source Projects
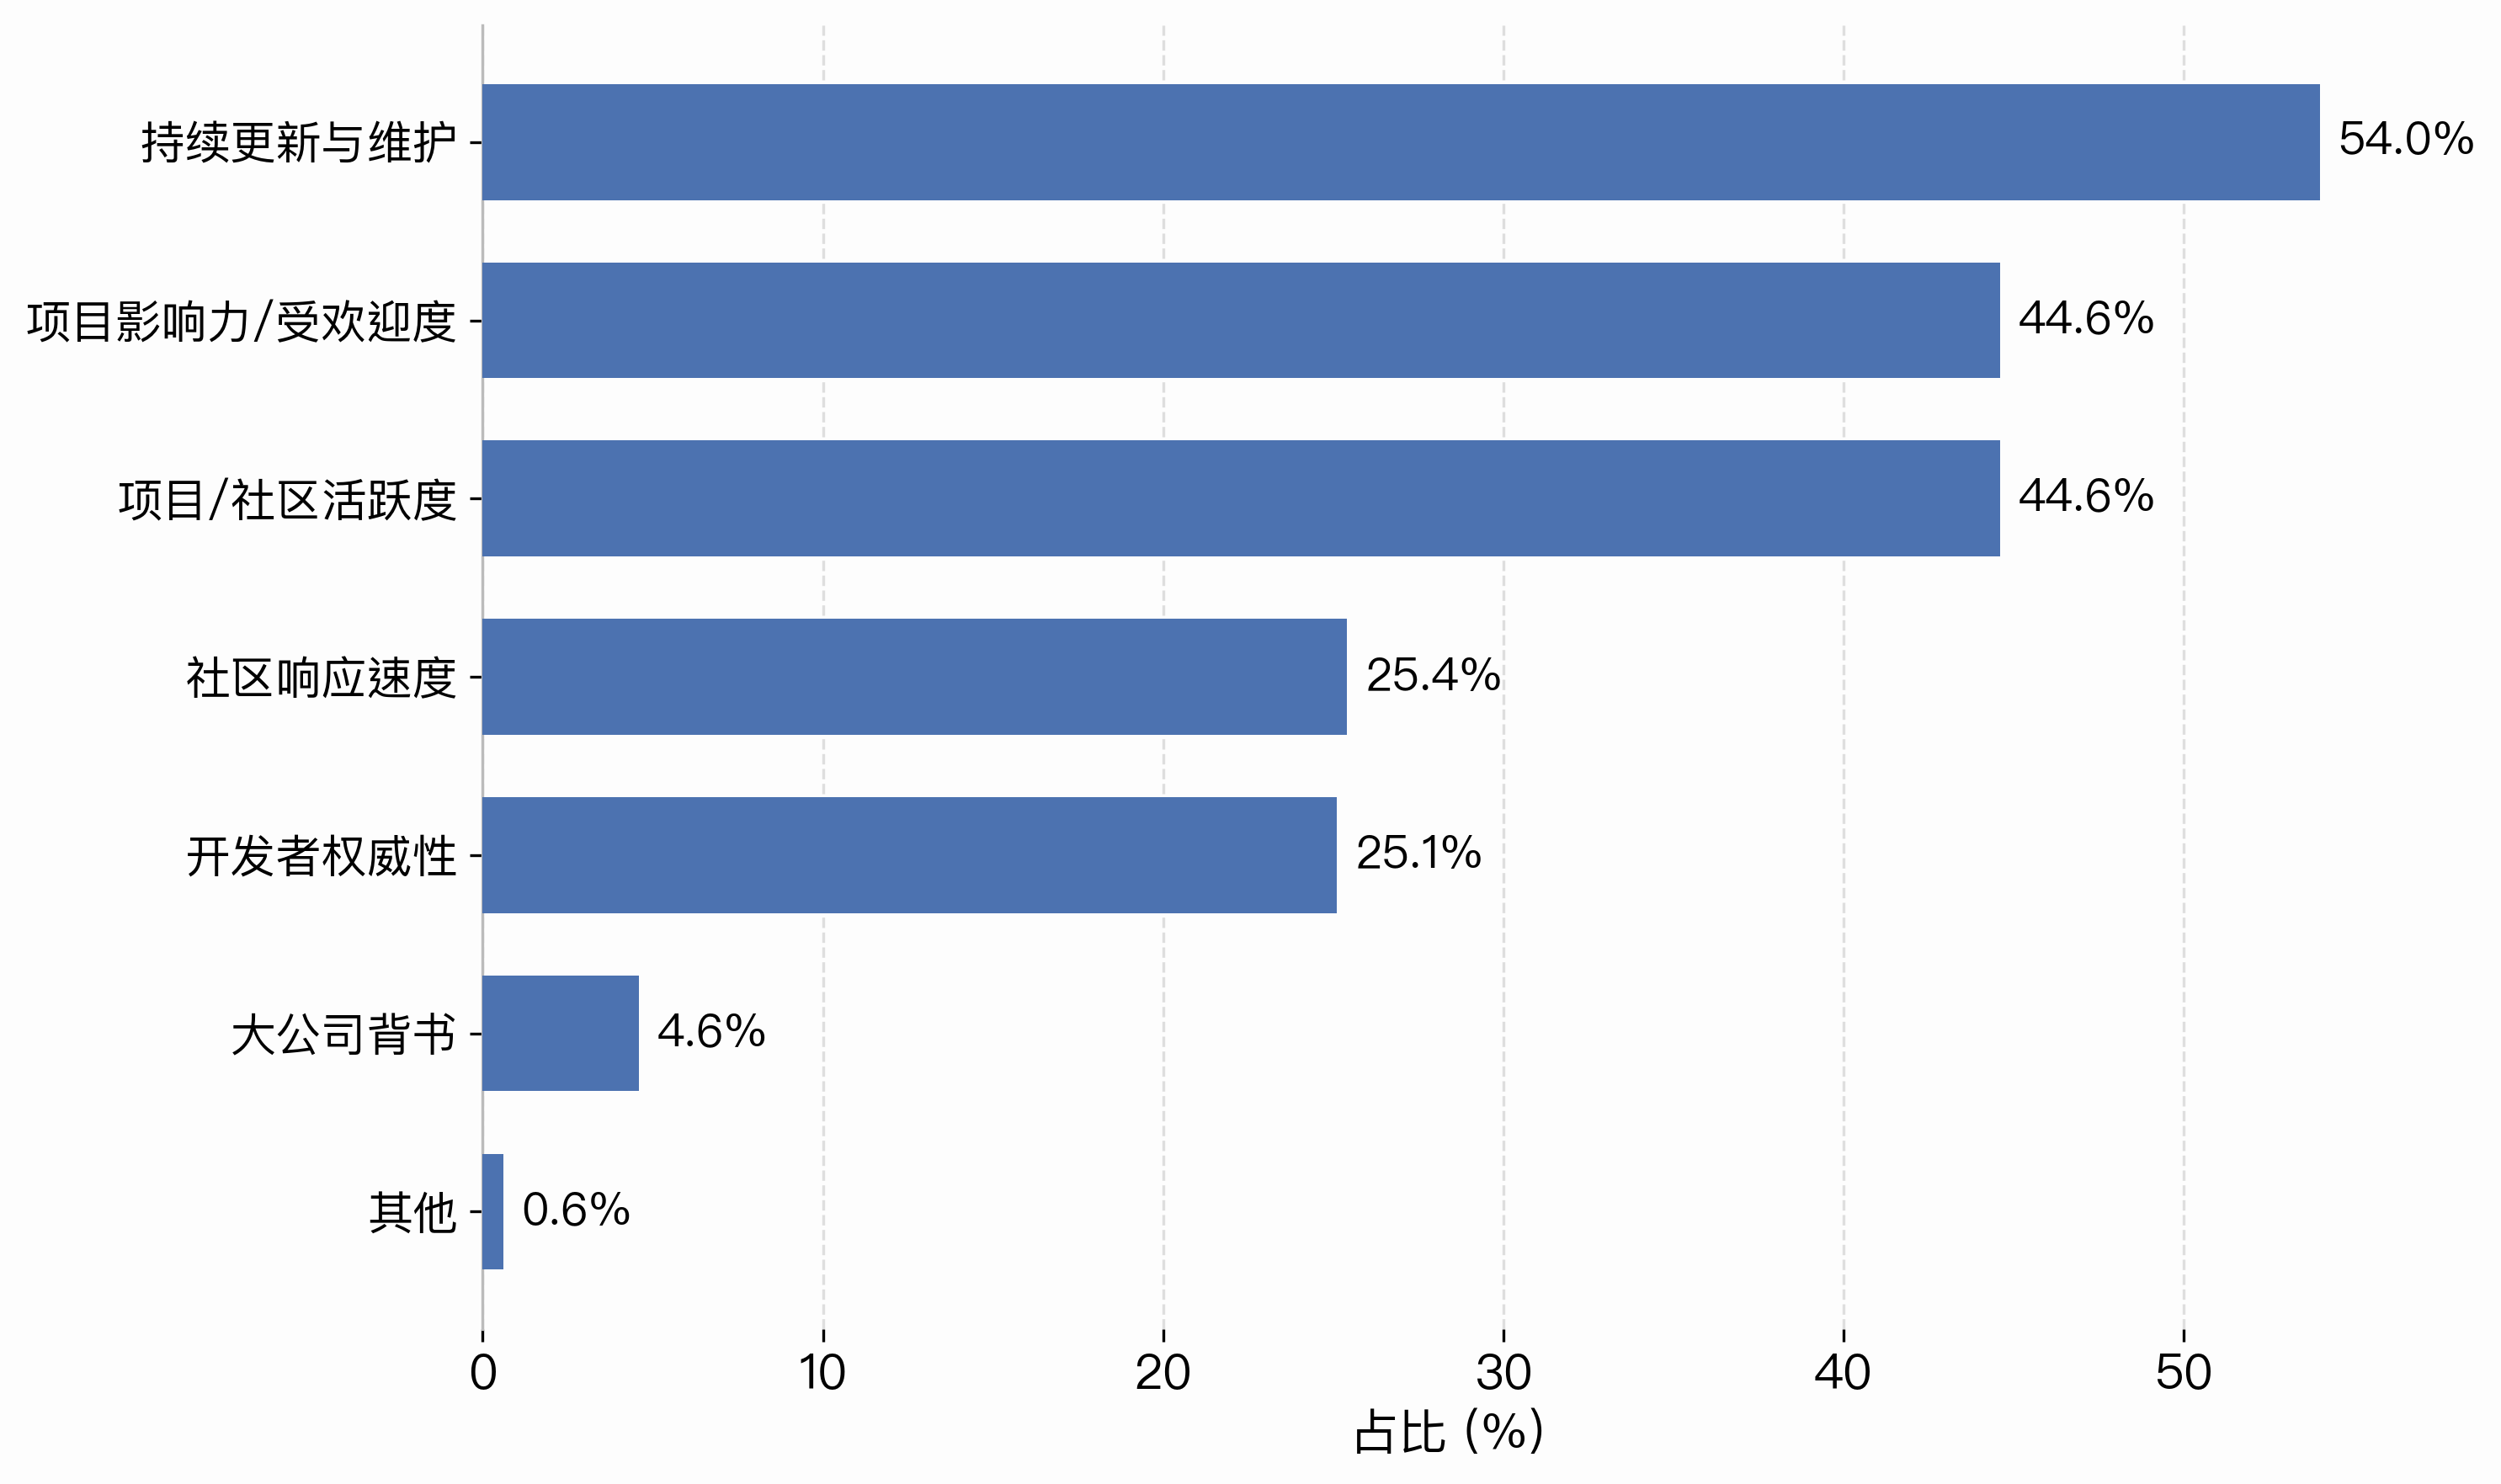
Figure 1-28 Criteria for Evaluating Open-Source Projects
Overall, respondents saw good community maintainers as the single most important factor in the healthy, sustained development of an open-source community — this option drew the highest share — followed by a strong community culture and a steady influx of new contributors. Funding, the ability to turn newcomers into long-term contributors, and fast community response times were each cited by a considerable number as well, indicating that respondents attend both to the people and culture of a community and to its wider performance in resources, conversion, and responsiveness.
In evaluating open-source projects, respondents placed the greatest weight on whether a project receives ongoing updates and maintenance – more than half regarded it as the core criterion. Whether a project has influence and enjoys broad popularity came next, alongside the level of activity in the project and its community, the two drawing roughly equal shares. Community response speed and the standing of a project’s developers made up a second tier, while endorsement from a major company mattered least. Overall, developers prize long-term maintenance, genuine usage, and community activity over mere star appeal or a single authoritative endorsement.
In addition, healthy community culture and atmosphere remain crucial to a community’s success, while funding, widespread adoption, and technical sophistication are all essential components of community development that should not be overlooked.
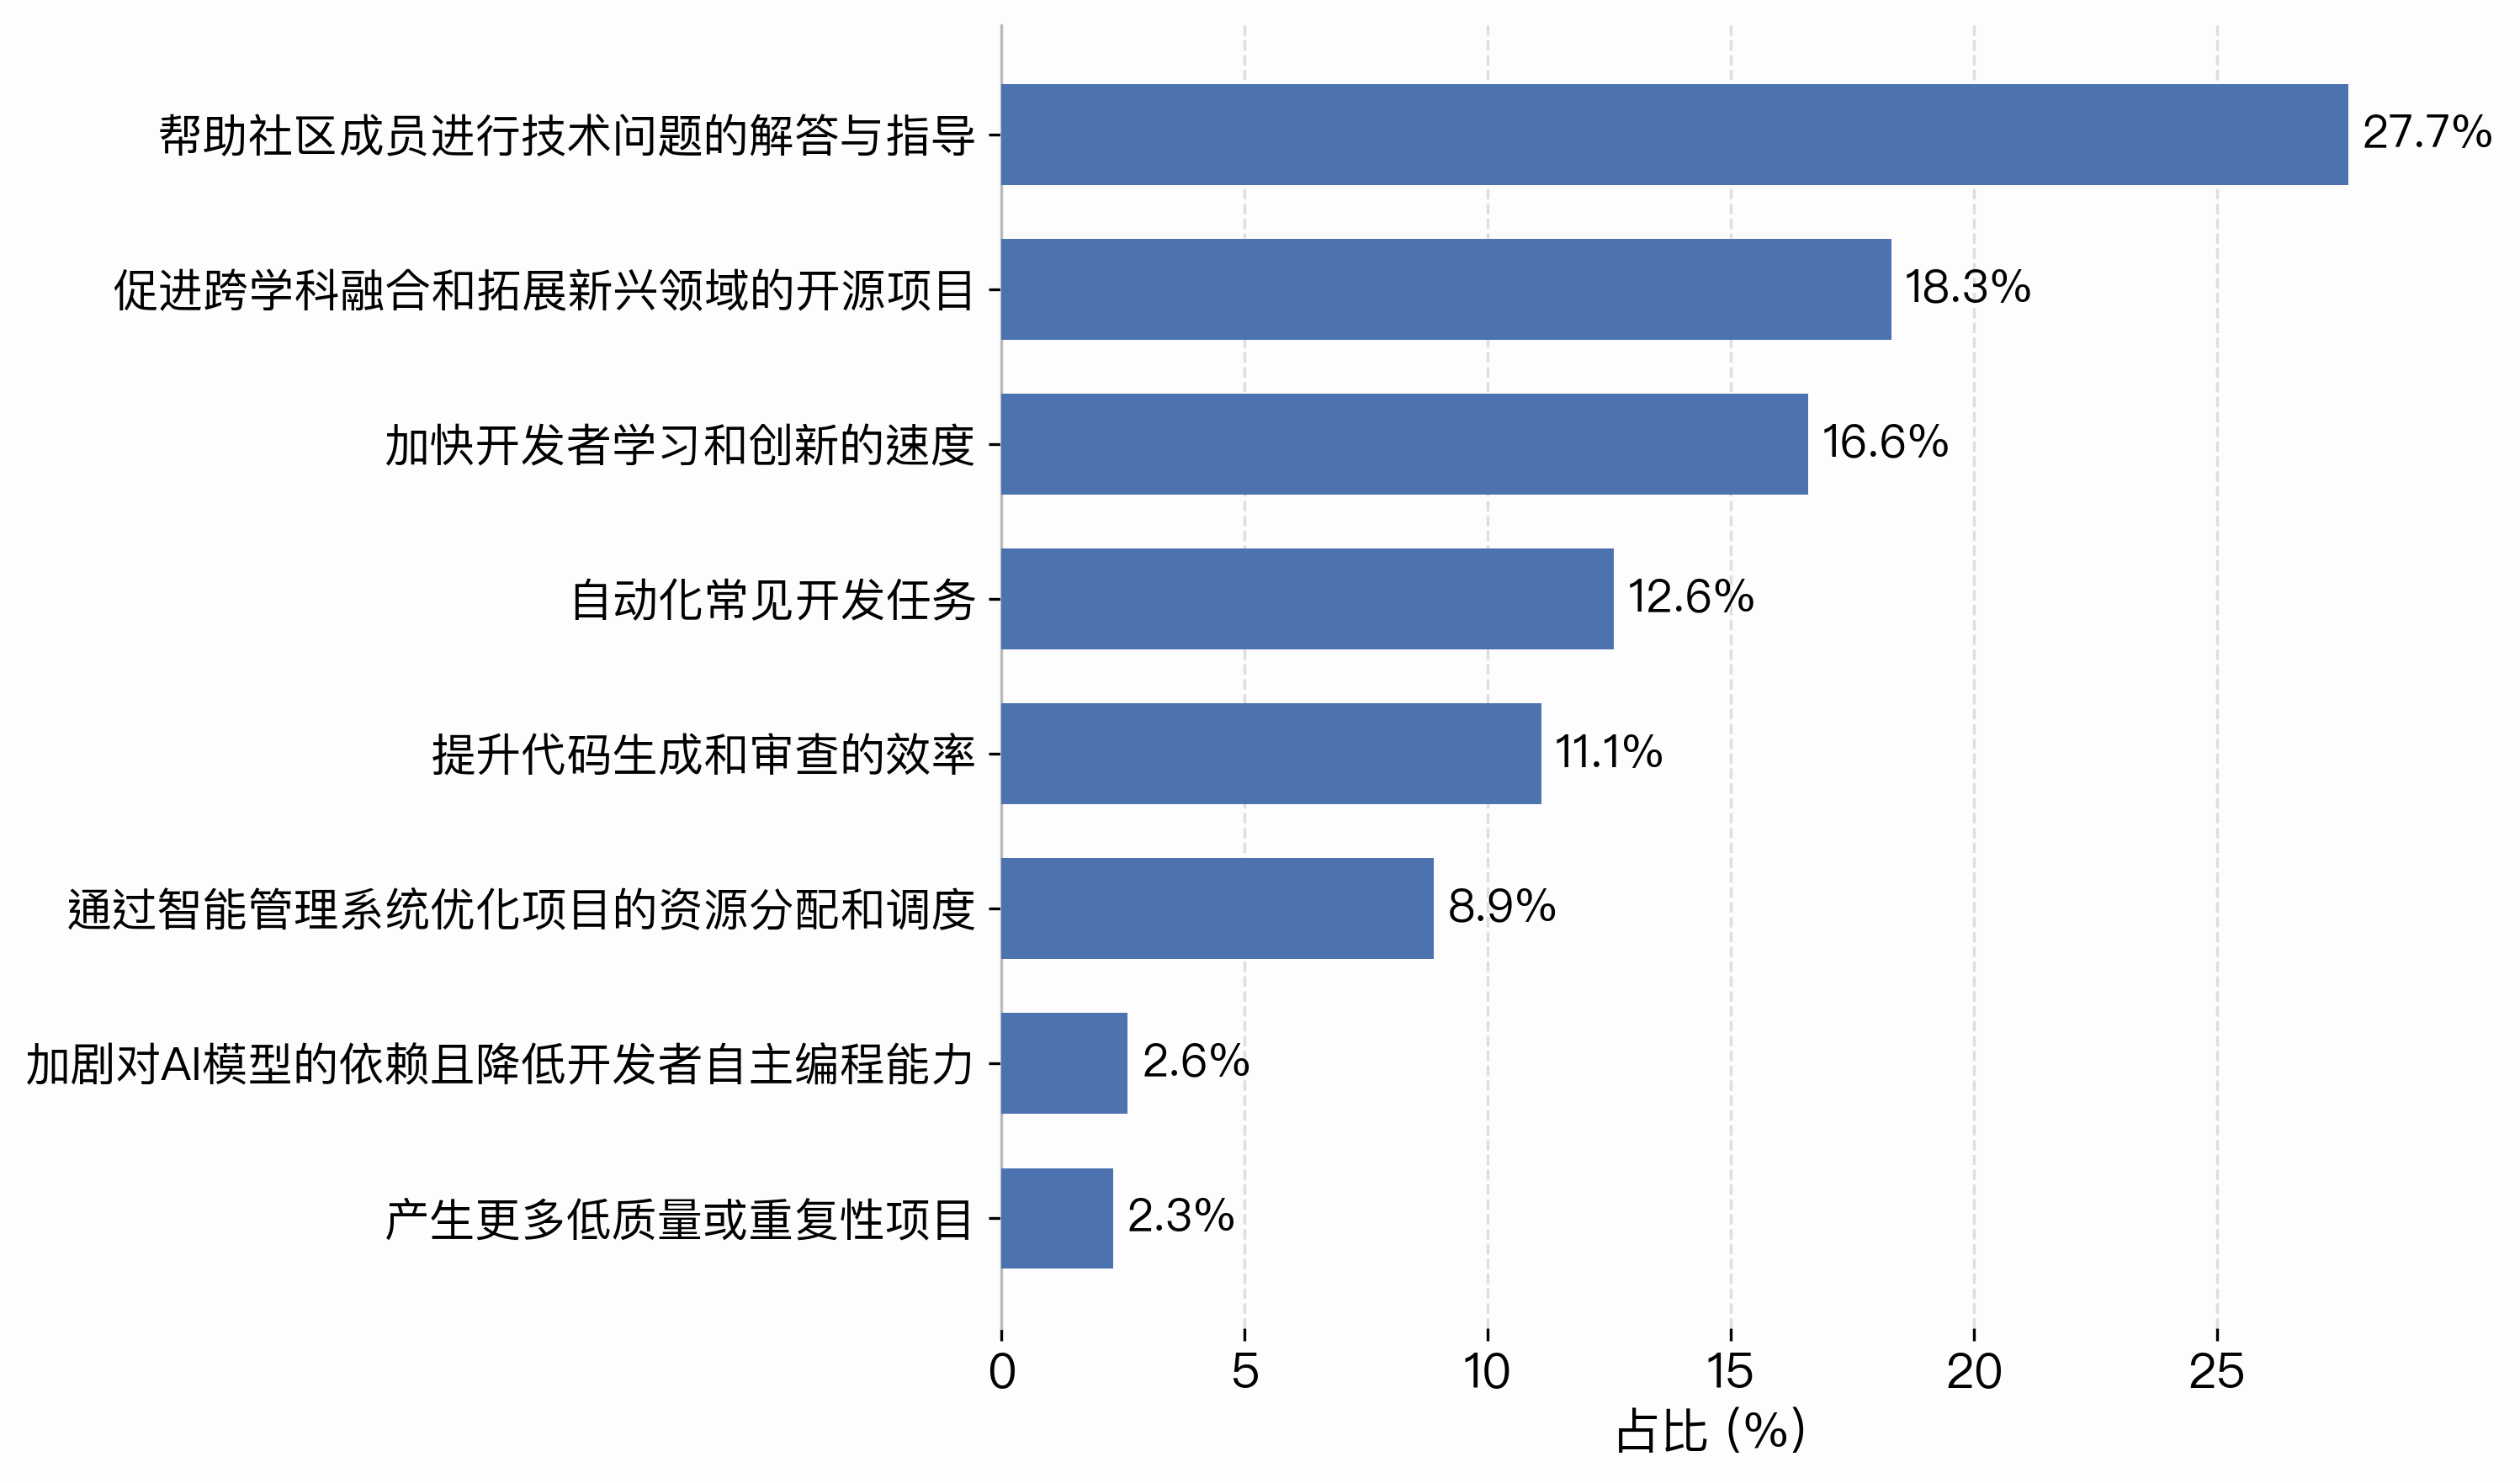
Figure 1-29 The Impact of AI on Open-Source Projects and Communities
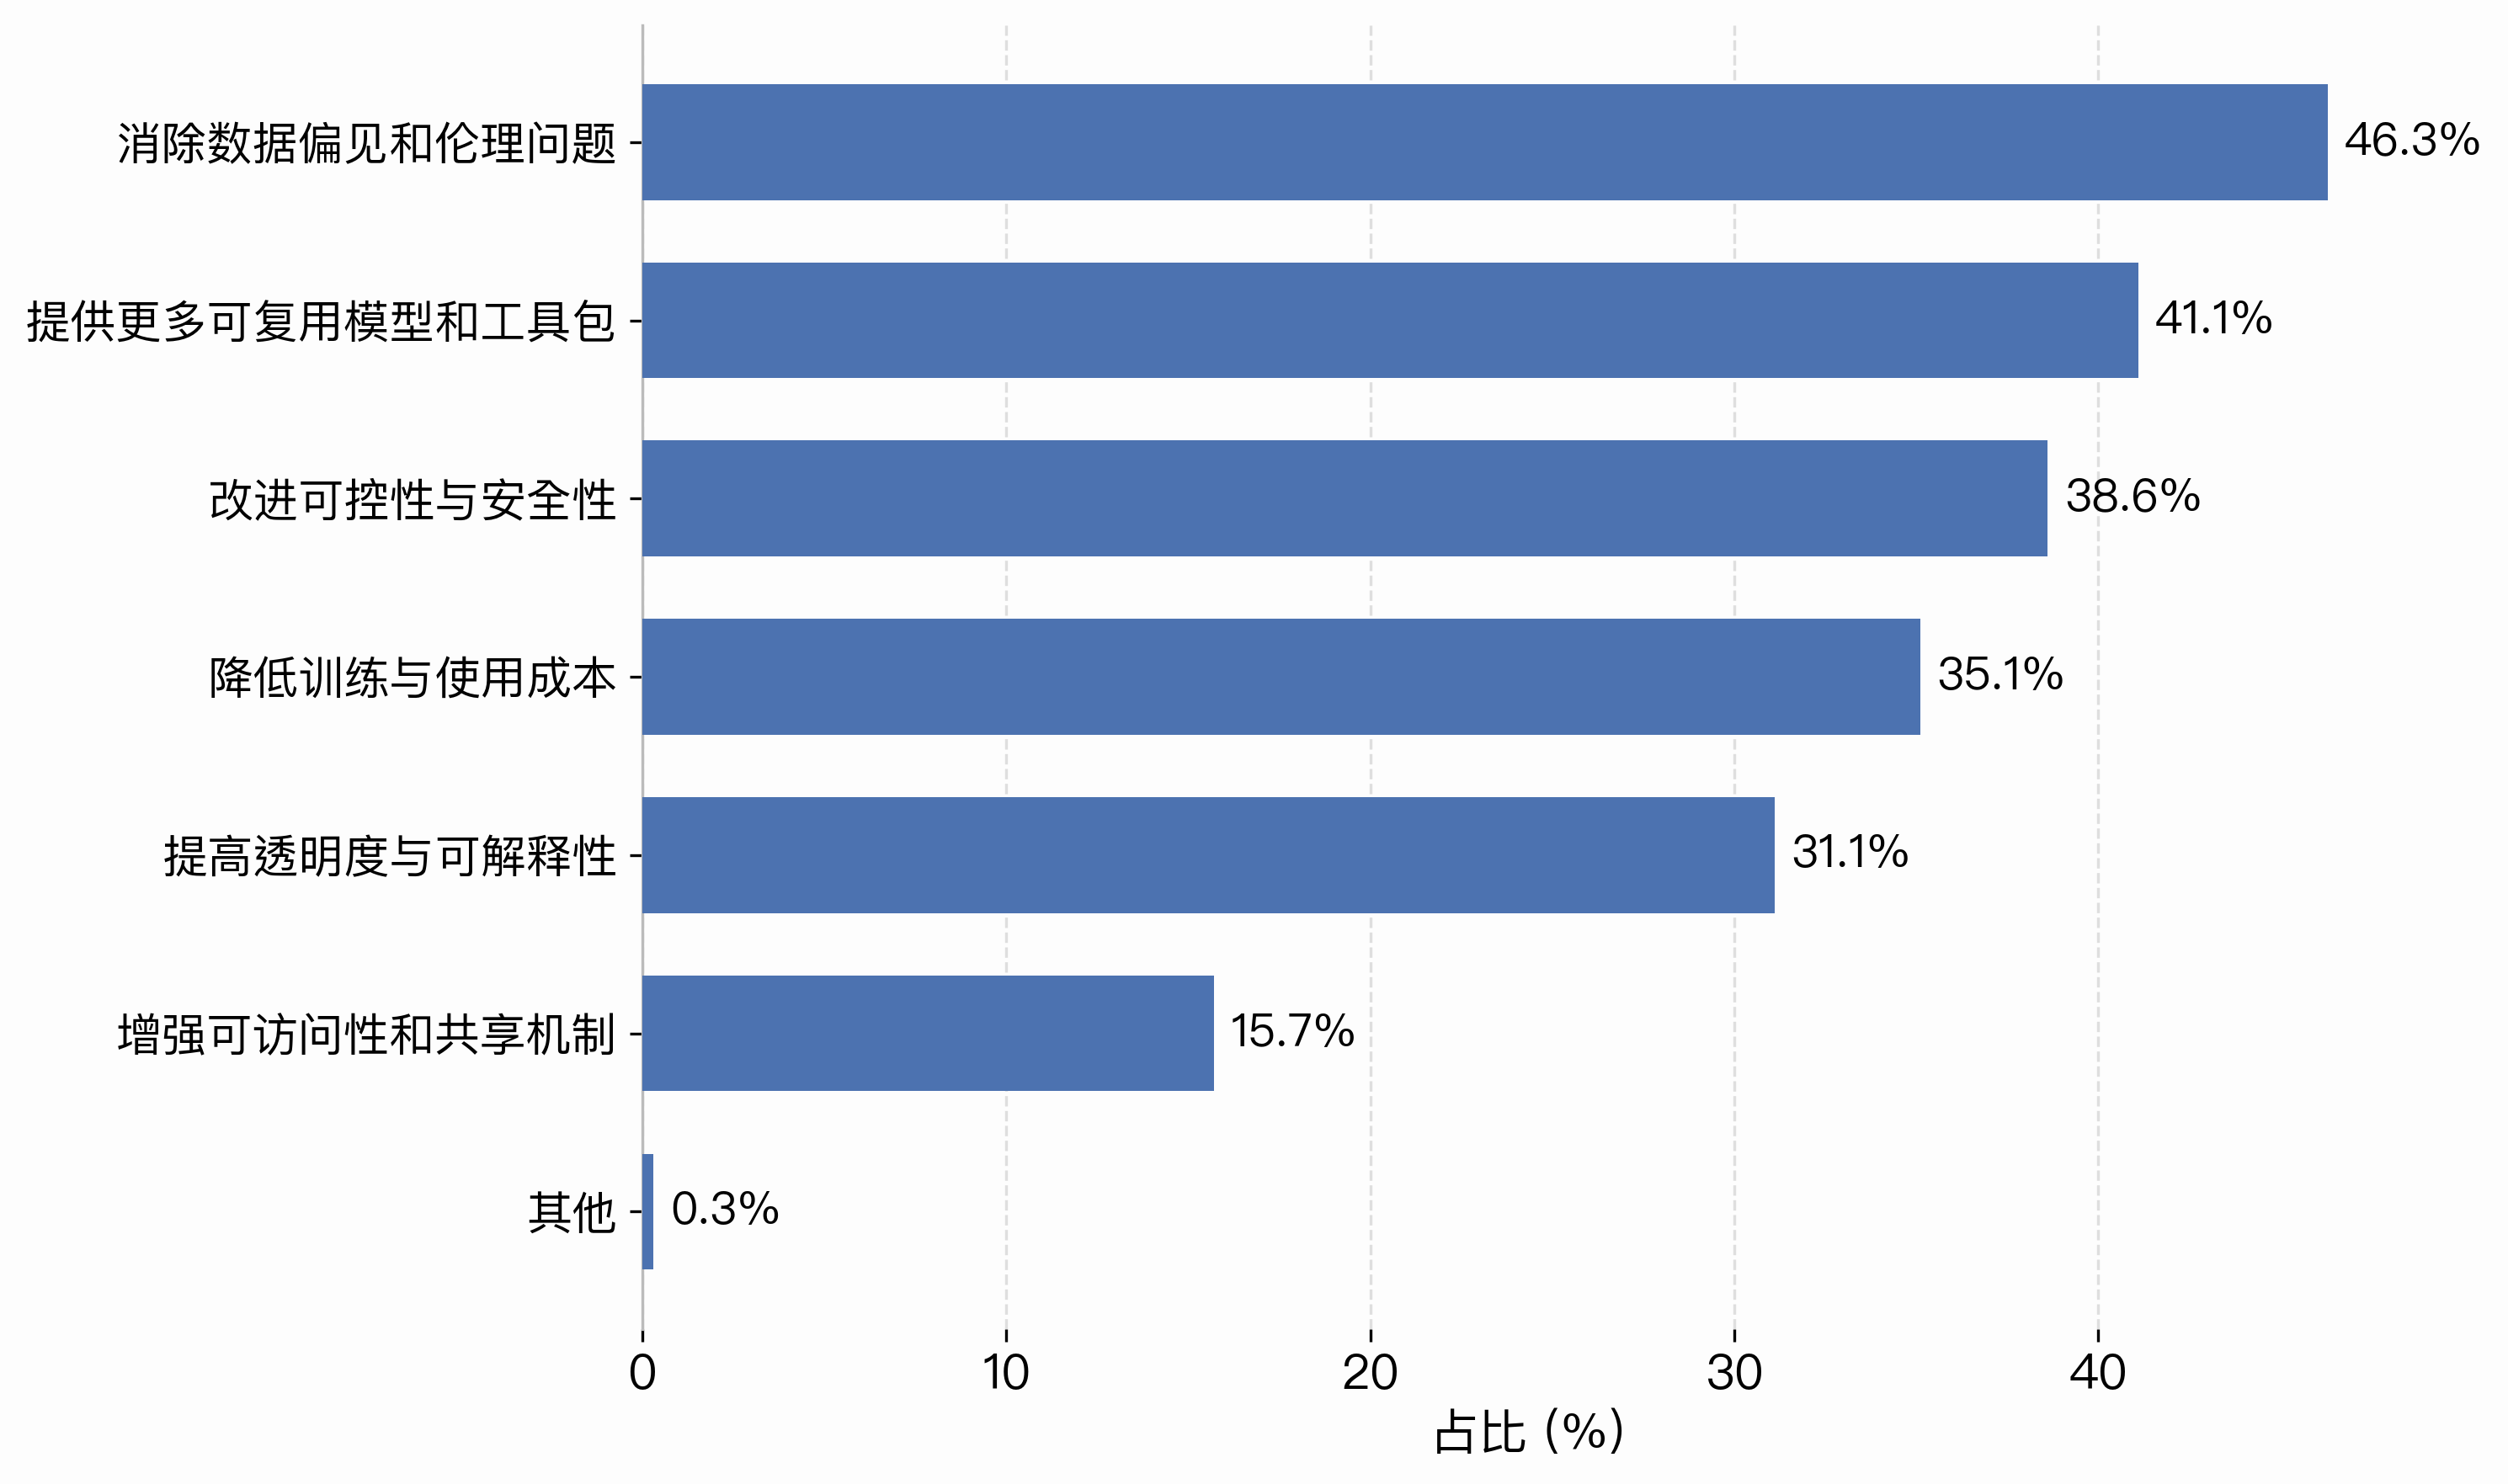
Figure 1-30 The Most Pressing Technical Challenges Facing Open-Source Large Models
Artificial intelligence has had a far-reaching effect on open-source projects and communities. The most frequently cited benefit was helping community members answer and work through technical questions, which points to AI’s direct value in knowledge access and day-to-day support. Promoting interdisciplinary work and opening up projects in emerging fields came next, followed by accelerating the pace at which developers learn and innovate. Moreover, respondents noted AI’s potential to automate routine development tasks, improve the efficiency of code generation and review, and optimize the allocation of resources. Meanwhile, a small number worried that AI may give rise to more low-quality or duplicative projects, or deepen reliance on models in ways that erode developers’ own programming ability.
The technical challenges facing open-source large models are equally varied. The most frequently cited was eliminating data bias and addressing ethical concerns embedded in models, followed by making more reusable open-source models and toolkits available, and improving the controllability and safety of large models in real-world implementation. Together these three accounted for a substantial share. Reducing the cost of training and running models, and improving transparency and interpretability, were also seen by many as critical. Meanwhile, improving accessibility and sharing mechanisms for large models within open-source communities was cited somewhat less often, though it bears just as directly on the long-term prosperity of the ecosystem. Progress on these fronts will support the healthy development and wider adoption of open-source large models.
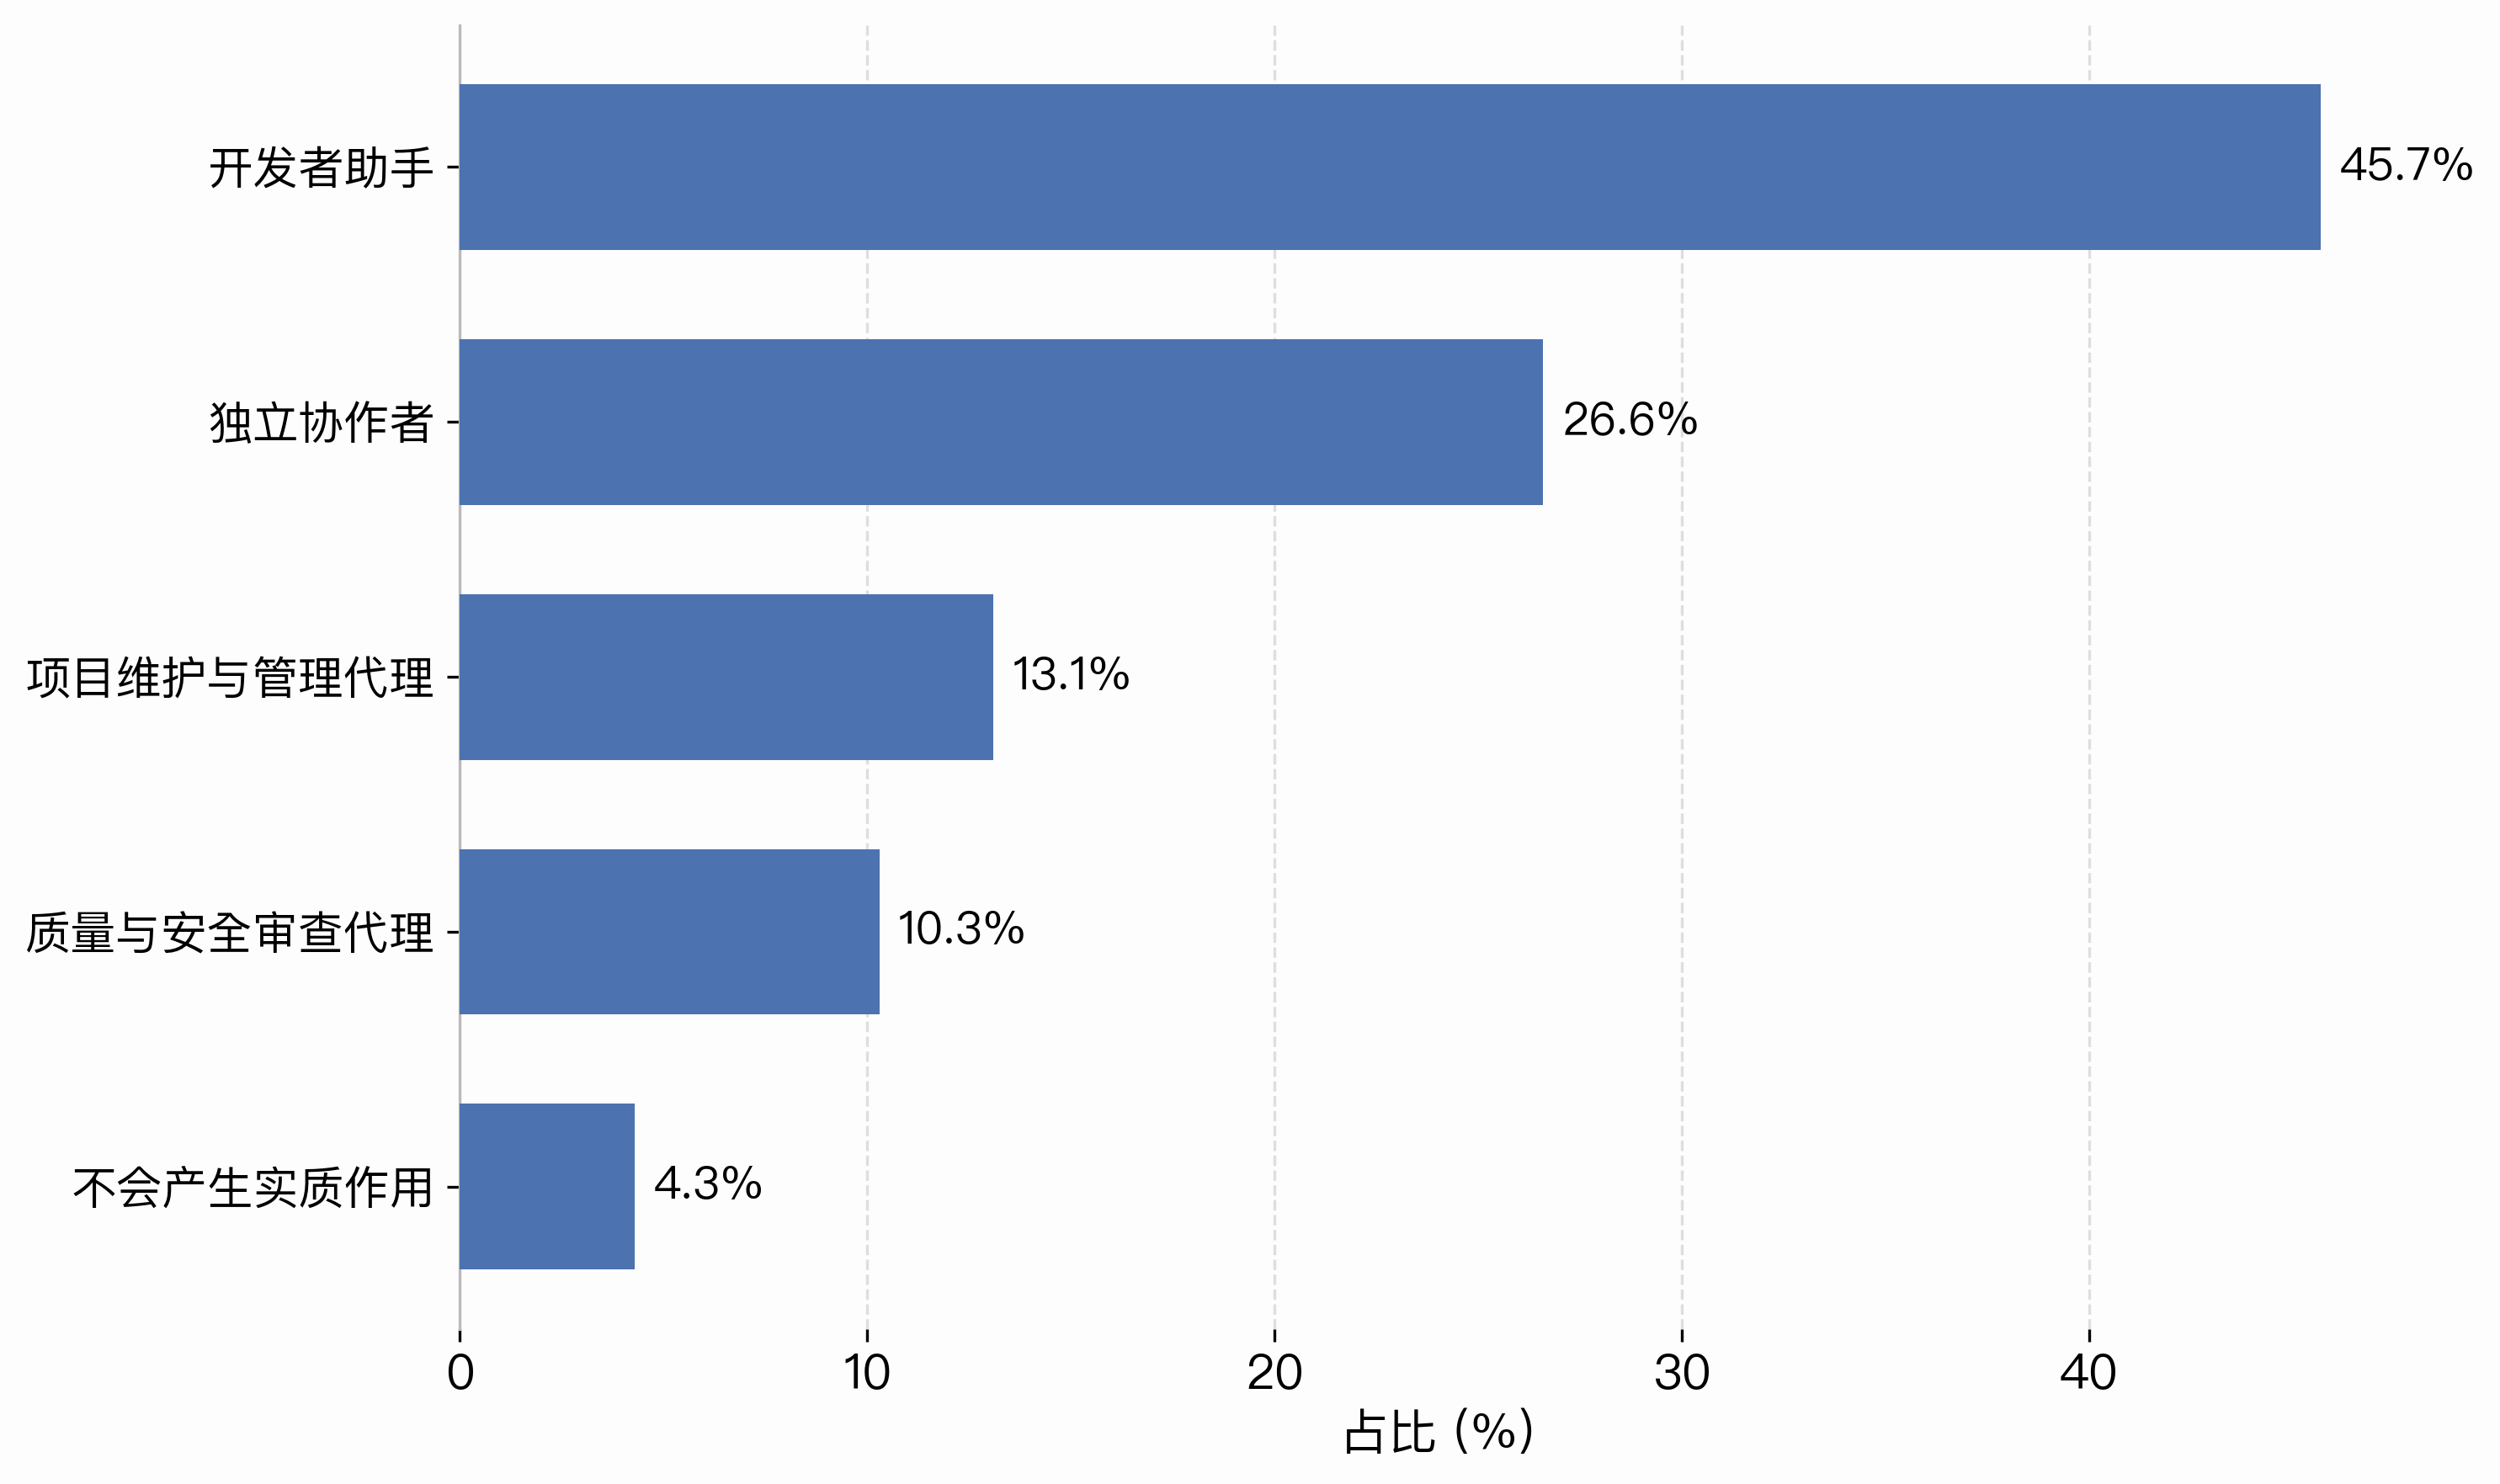
Figure 1-31 AI Agent
Views on the Role of AI Agents in Future Open-Source Communities
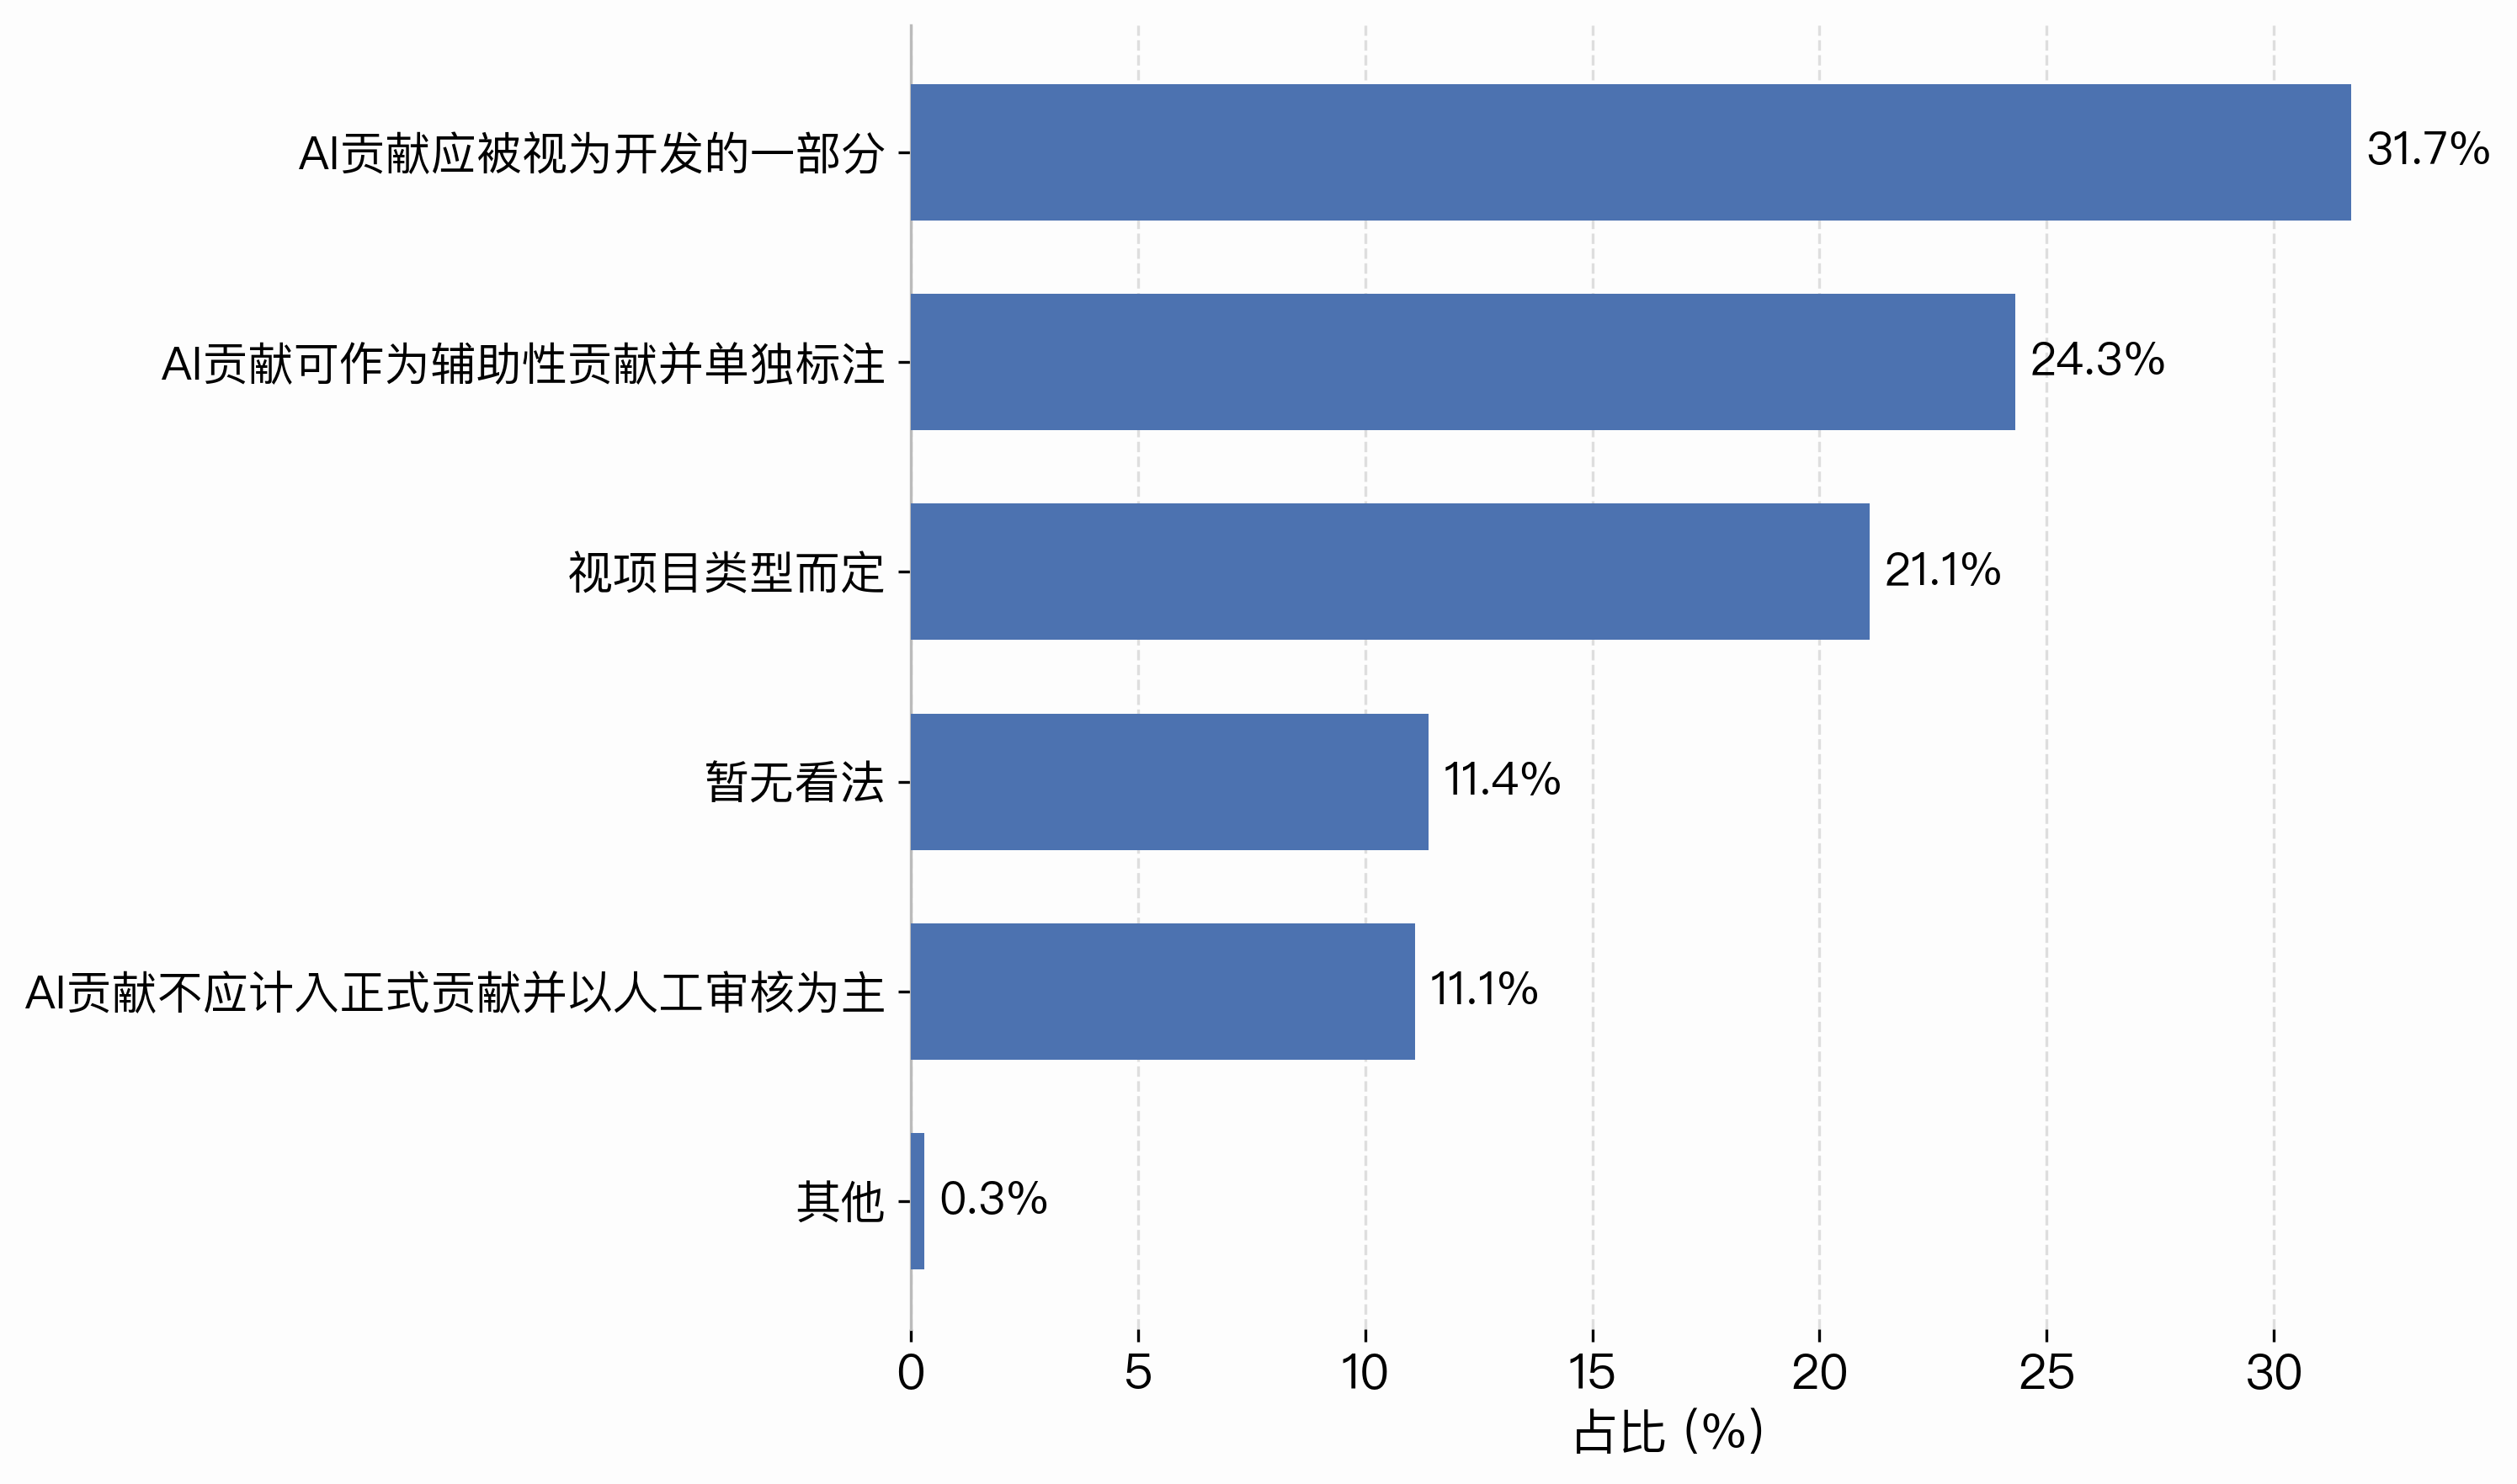
Figure 1-32 AI
Views on Whether AI-Assisted Work Should Count as a Formal Contribution
Respondents held differing views on the role AI agents will play in future open-source communities. Overall, the role of developer assistant found the widest acceptance, with close to half of respondents seeing it as the primary position. Independent collaborator and agent for project maintenance and management followed, together accounting for a sizable share. Some respondents also expected AI agents to contribute to quality and security review, while others were more reserved about their future role. Those who believed AI agents will make no substantive difference remained a minority.
On whether AI-assisted contributions should count as formal contributions, opinion was clearly divided. The largest group held that such work should be treated as part of development, followed by those who would count it as a supporting contribution requiring separate attribution, and those who said it depends on the type of project – the three positions together accounting for over 70%. Others selected “unsure” or “no opinion,” or maintained that human review should take precedence and that AI-assisted work should not count as a formal contribution. The community, in other words, is still working toward a consensus on where to draw the line between AI involvement and human contribution.
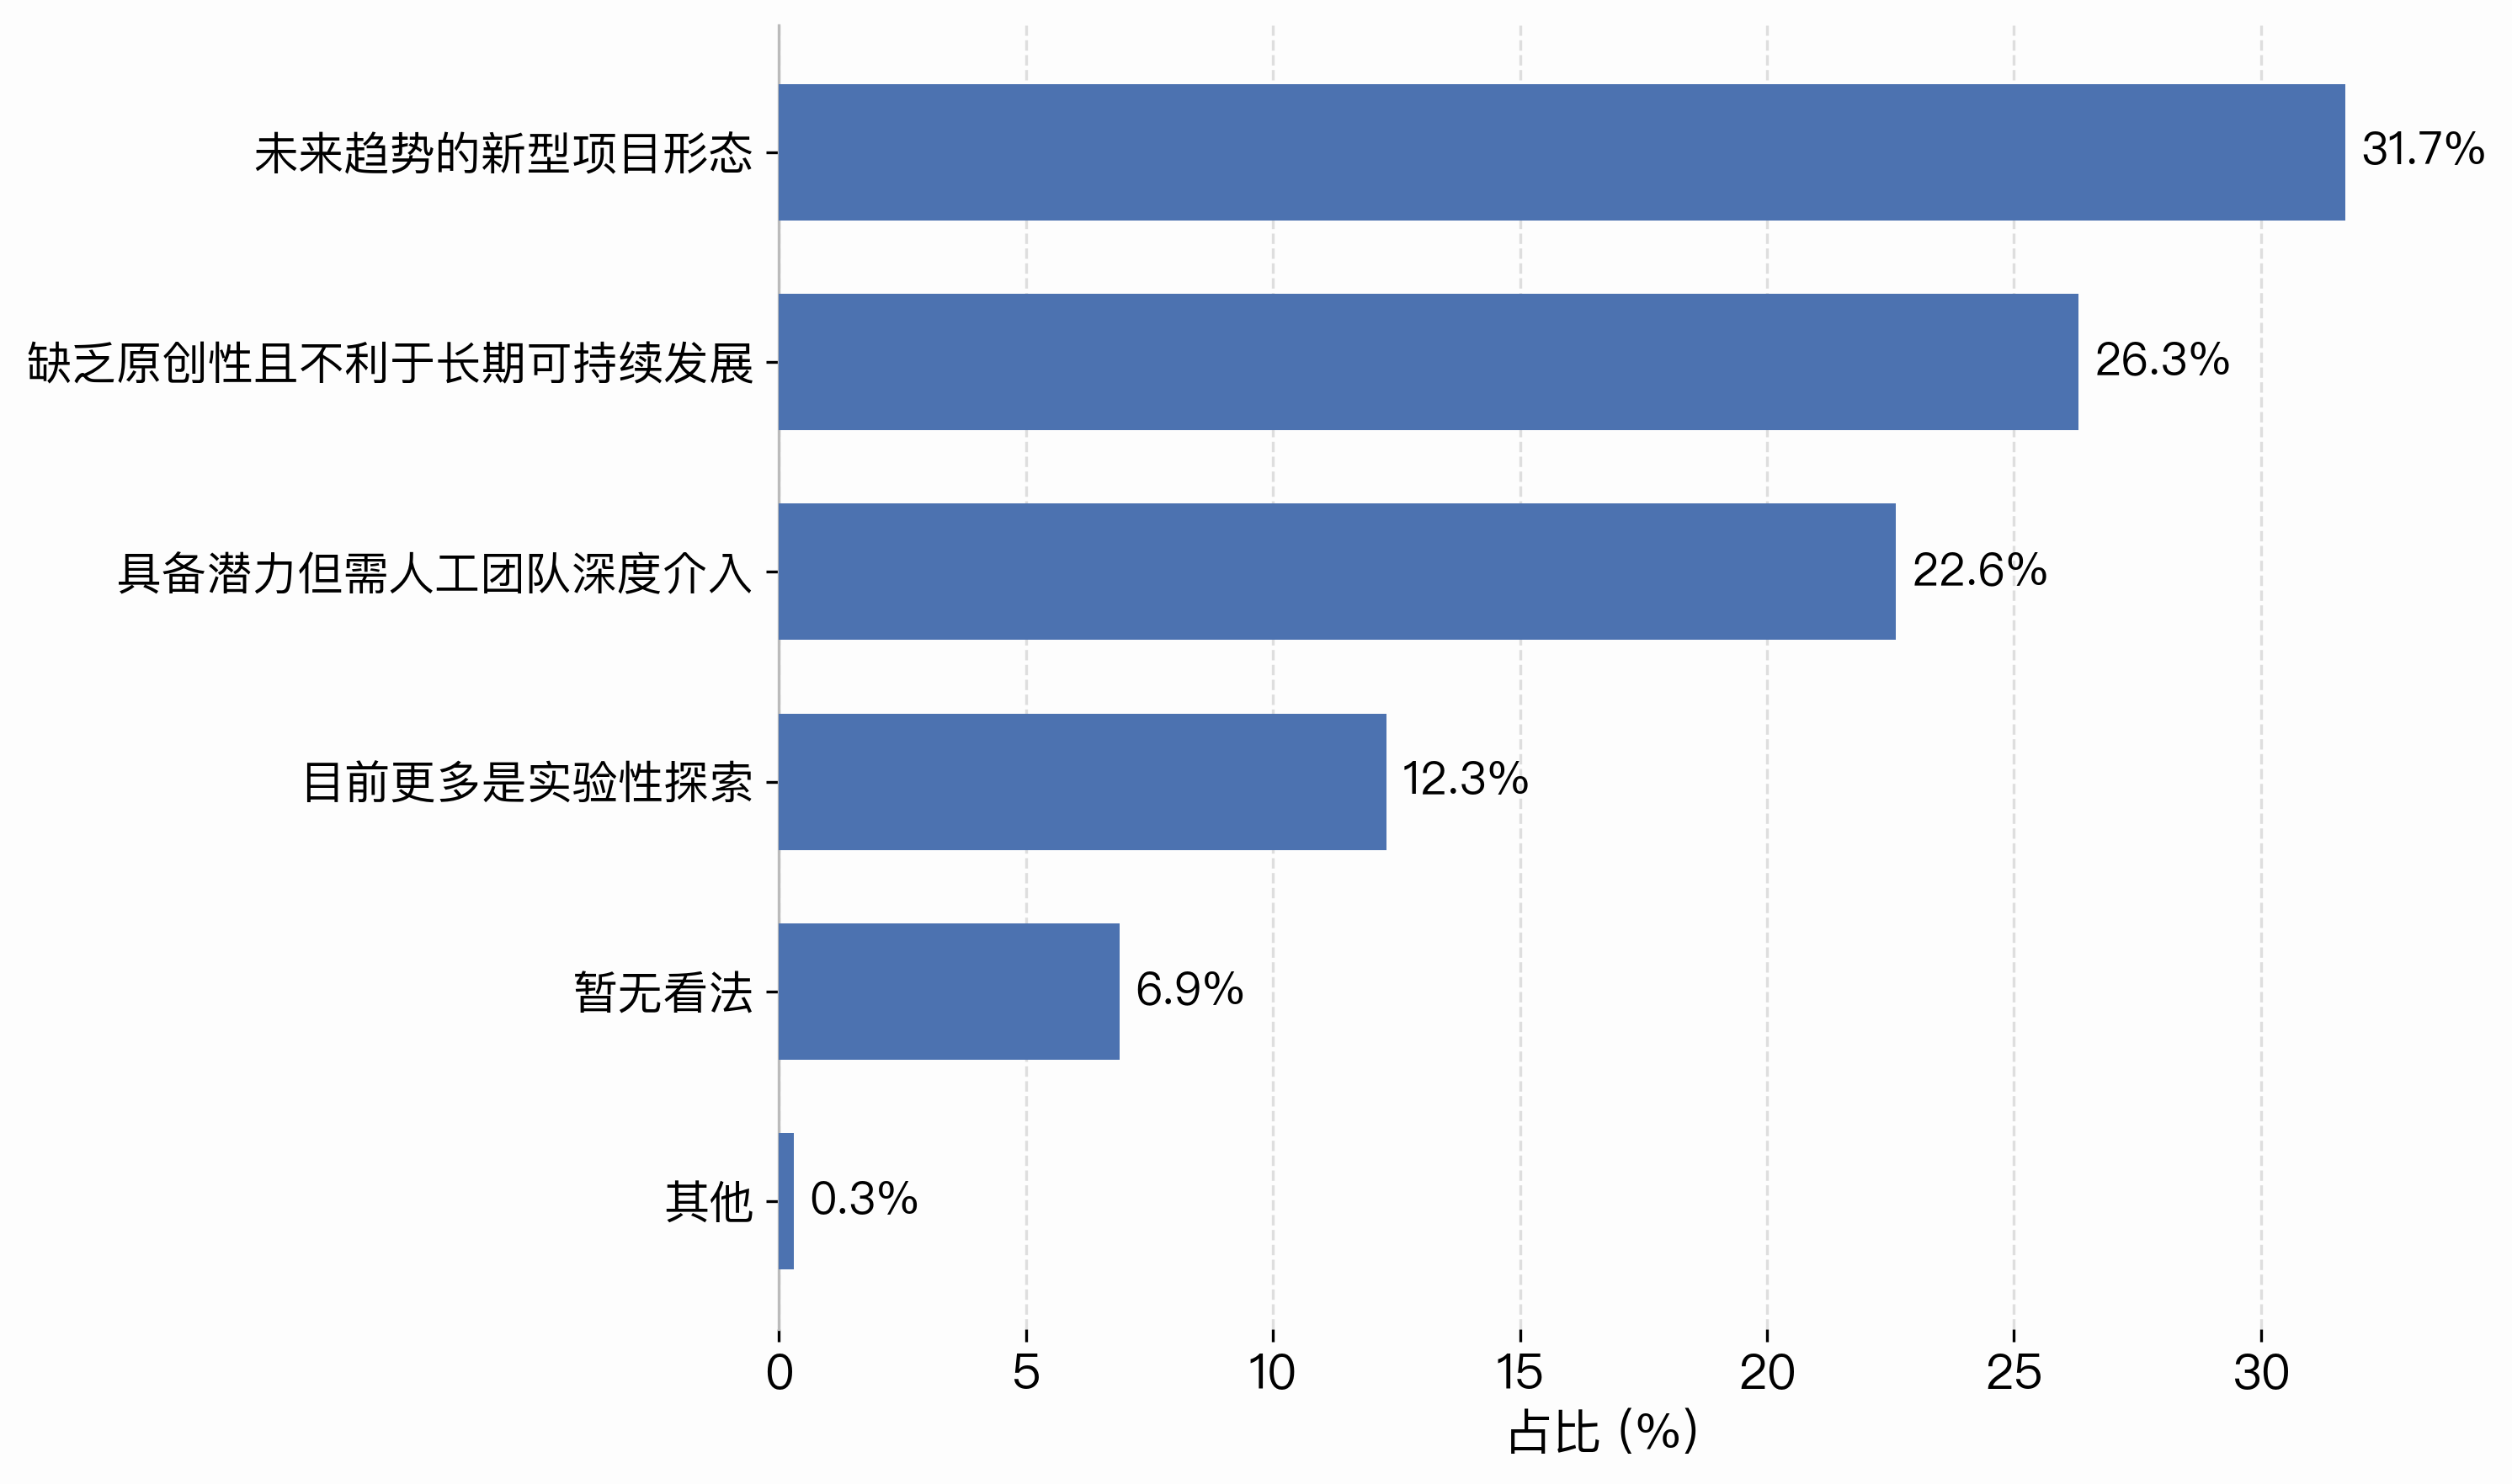
Figure 1-33 AI
Views on AI-Native Open-Source Projects
On AI-native open-source projects, respondents’ views were likewise varied. Some saw them as the direction of the future and a new form that projects will take. Others felt the approach holds potential but requires deep involvement from human teams. A considerable share worried that many current AI-native projects lack originality, which bodes ill for long-term sustainability, while others viewed the field as still largely experimental. A wait-and-see attitude was common as well.
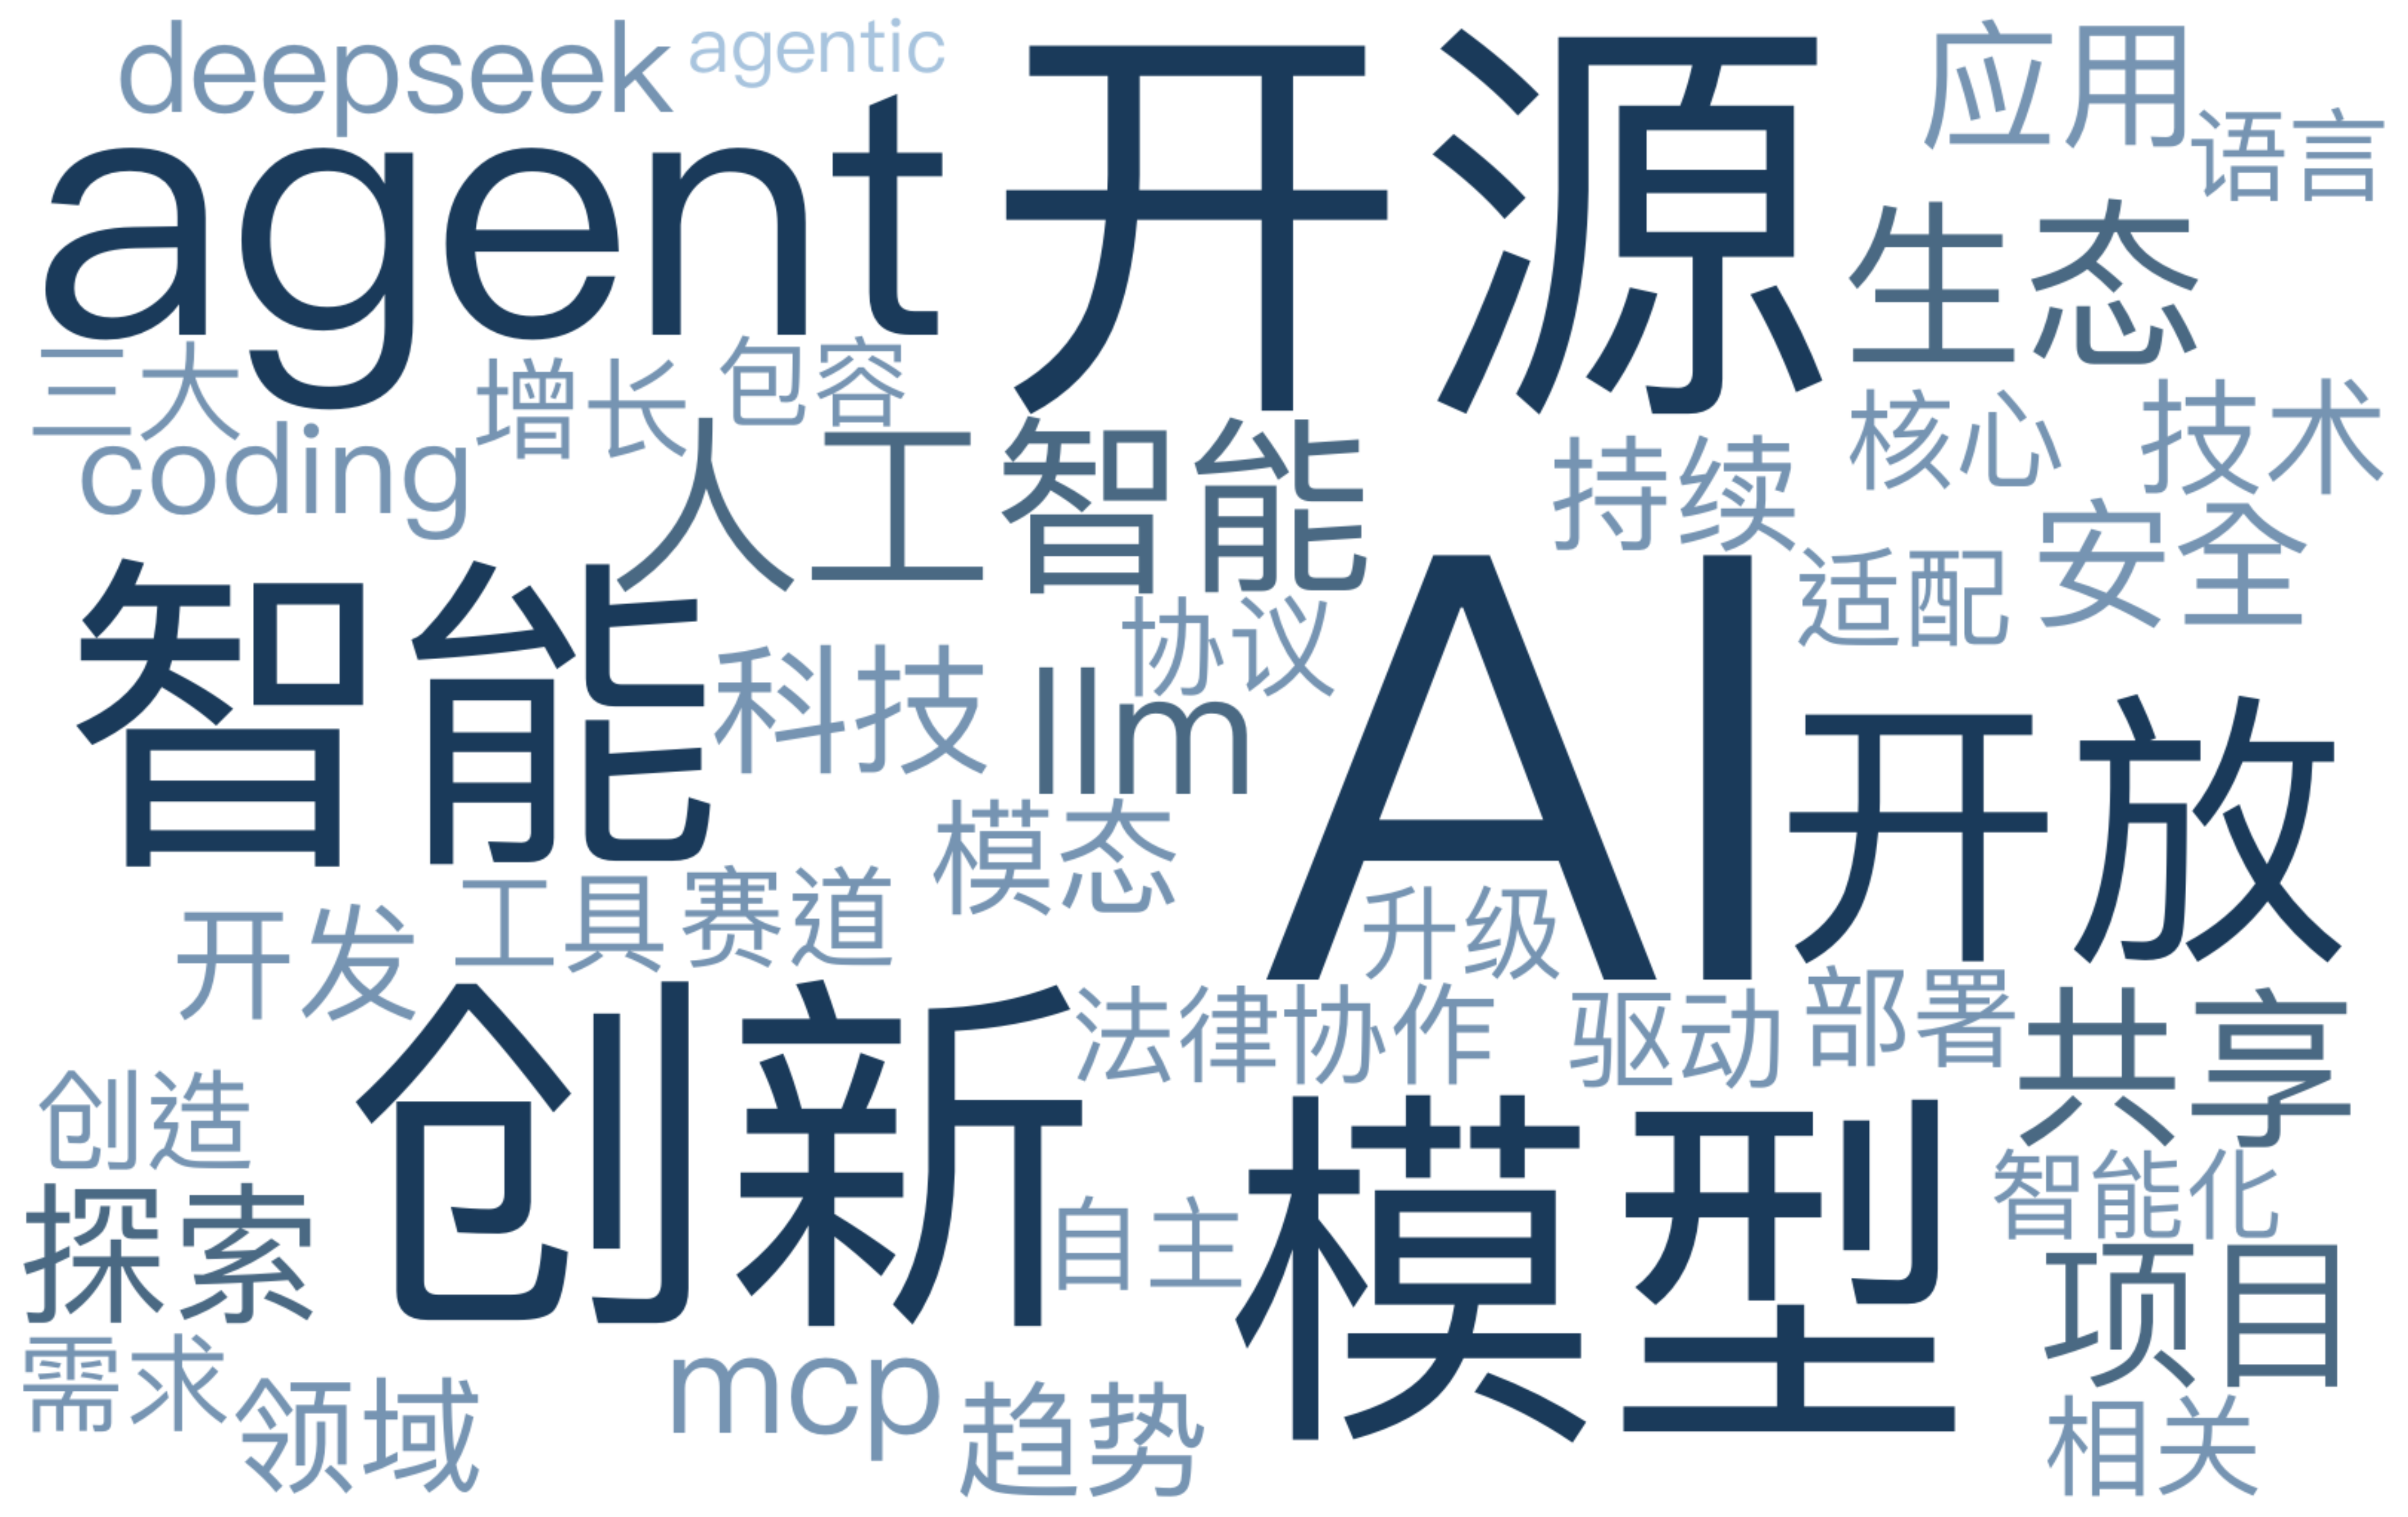
Figure 1-34 2025 Open-Source Keyword Cloud
The 2025 open-source keyword cloud shows that terms such as AI, model, intelligence, large model, innovation, and agent appeared most frequently of all, making technological innovation and large models unmistakably the dominant theme of the year. At the same time, keywords such as open source, sharing, openness, ecosystem, project, and exploration highlight the importance of the open-source ecosystem and of collaborative innovation. Terms such as security, application, and MCP indicate that respondents are concerned not only with the technology itself but also with the challenges and opportunities of real-world implementation and security.